



Table of contents

Google Ads remains the highest-intent acquisition channel for fintech brands in 2026 — the $6.45 average CPC is 12% higher than 2024, but the 5.8% conversion rate and 3.4x ROAS make search advertising one of the most efficient customer acquisition channels in the industry.
Key Takeaways
- Fintech Google Ads CPC averages $6.45 in 2026, up 12% from 2024 levels, driven by increased competition from neobanks and traditional banks entering digital acquisition (CuFinder).
- The fintech conversion rate on Google Search is 5.8%, compared to the all-industry average of 8.18%, reflecting longer consideration cycles for financial products (CuFinder).
- Finance and insurance achieves an 8.3% CTR on Google Search, well above the 6.7% cross-industry average, showing strong ad relevance (Lever Digital).
- Top fintech companies spend $140,000–$1M per month on Google Ads, with Kabbage leading at approximately $1M in monthly spend (Prometheus PPC).
- Click fraud costs fintech advertisers roughly $0.70 per click at a $12.80 average CPC in US financial services, with a 5.5% unrefunded fraud rate (FraudBlocker).
- Fintech CAC ranges from $50 for neobank consumer apps to $14,772 for enterprise SaaS depending on product complexity and sales cycle length (FoundryCRO).
- The LTV-to-CAC ratio for fintech averages 3.5:1, the benchmark threshold for sustainable growth in paid acquisition (CuFinder).
Fintech Google Ads Benchmarks at a Glance
This table consolidates 2026 performance data from multiple benchmark studies to provide a realistic baseline for fintech PPC campaigns.
| Metric | Fintech Average | All-Industry Average | Difference |
|---|---|---|---|
| CPC (Search) | $6.45 | $5.42 | +19% |
| CTR (Search) | 8.3% | 6.7% | +24% |
| Conversion Rate | 5.8% | 8.18% | -29% |
| Cost per Lead | $63–$113 | $66.69 | Variable |
| ROAS | 3.4x | 2.0x–2.5x | +36% to +70% |
Sources: CuFinder, WordStream, Lever Digital, PPCChief.
CPC and Cost Structure by Fintech Product Type
The cost of Google Ads in fintech varies dramatically based on the product being advertised. FoundryCRO's 2026 analysis segments CAC by product category:
| Product Type | CAC Range | Typical CPC | Primary Keyword Intent |
|---|---|---|---|
| Neobank (Consumer) | $50–$200 | $3.50–$6.00 | Comparison, review |
| Payments / Wallets | $30–$150 | $2.80–$5.50 | Transactional, integration |
| Lending / Credit | $150–$800 | $8.00–$15.00 | Application, pre-qualification |
| Insurance (Insurtech) | $200–$1,200 | $10.00–$25.00 | Quote, comparison |
| B2B Fintech SaaS | $2,000–$14,772 | $12.00–$30.00 | Demo, platform evaluation |
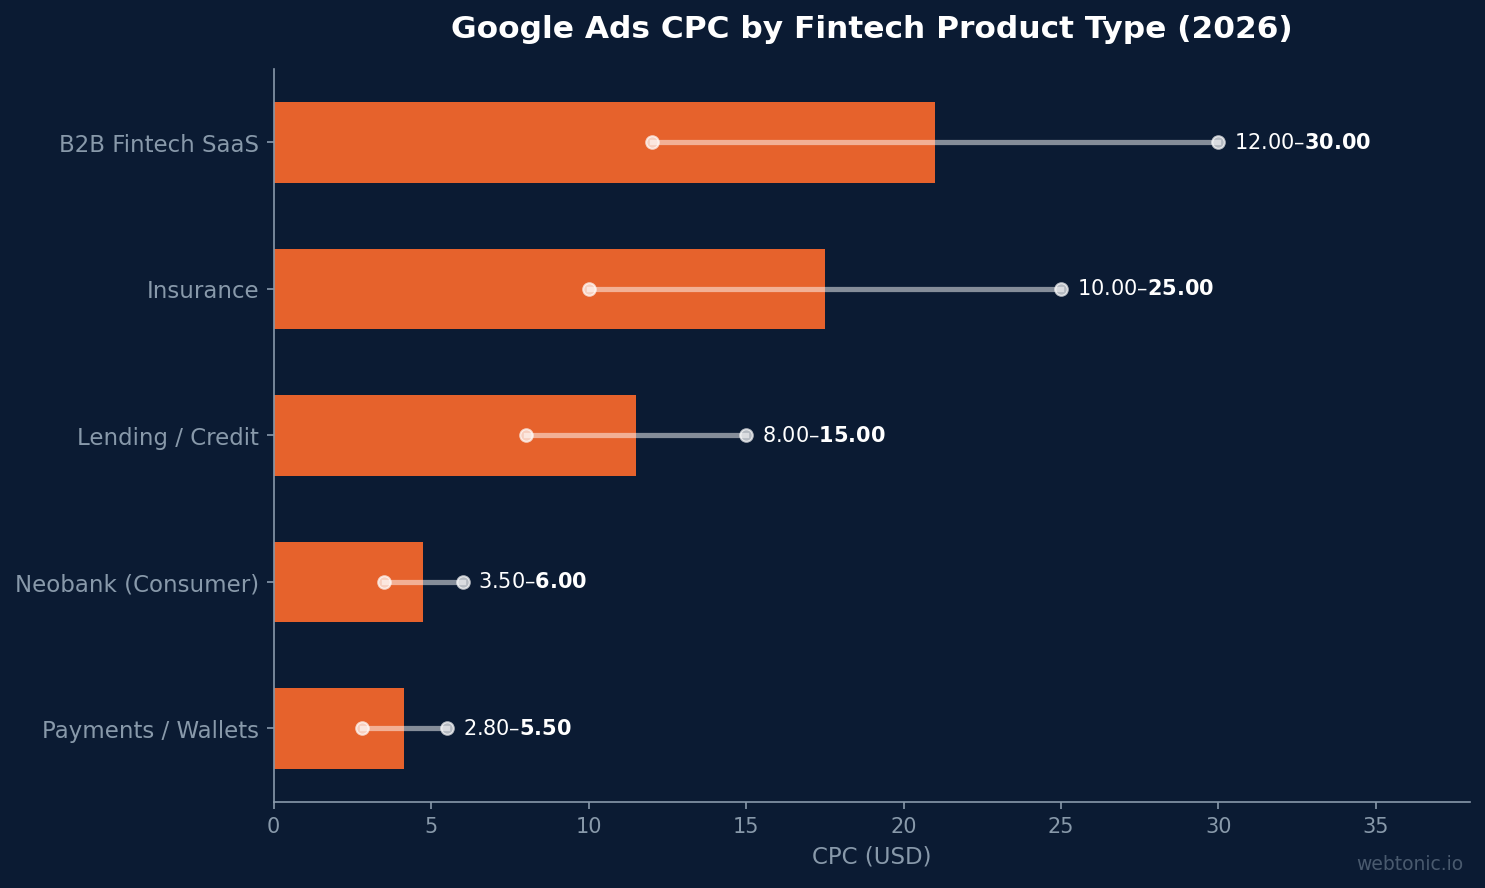
The lending and insurance verticals command the highest CPCs because keywords like "personal loan," "business insurance," and "mortgage rate" attract both fintech disruptors and established financial institutions. FraudBlocker reports that US financial services averages $12.80 per click, making it one of the most expensive verticals in Google Ads overall.
How Top Fintech Companies Allocate Ad Spend
Prometheus PPC's analysis of fintech Google Ads spending reveals the scale at which leading brands invest:
- Kabbage (US): ~$1M/month — stable spend focused on small business lending keywords.
- Novo Financial (US): ~$200K/month — declining as the brand shifts budget toward organic and referral channels.
- Brex (US): ~$140K/month — stable investment targeting business credit card and expense management terms.
- Stash (US): ~$60K/month — consistent spend on investment app and micro-investing keywords.
- Tally (US): ~$100K/month — stable focus on credit card debt management and payoff calculator queries.
These spending levels reflect the high-intent nature of Google Search for financial products. Unlike social media, where users discover fintech brands passively, search captures users actively comparing products, making the higher CPC worthwhile for brands with strong conversion funnels. For a deeper analysis of Google Ads strategy optimization, our expert guide covers the fundamentals.
Conversion Rate Analysis and Funnel Dynamics
The 5.8% fintech conversion rate on Google Ads tells only part of the story. Lever Digital's benchmark analysis highlights a critical nuance: while the 8.3% CTR exceeds the cross-industry average, the conversion rate of approximately 2.5% for high-intent financial keywords is significantly below the cross-industry average of 7.5%.
This gap exists because fintech conversion funnels involve more steps than typical lead gen:
- Initial click → landing page form submission (2.5–5.8% CVR)
- Form submission → KYC/identity verification (60–75% completion)
- KYC completion → account funding (40–55% completion)
- Account funding → active user (70–85% activation)
The end-to-end conversion from click to active funded account typically runs 0.7–2.4%, which explains why fintech brands focus heavily on post-click funnel optimization alongside ad performance. WordStream's 2026 benchmarks confirm that the all-industry conversion rate has risen to 8.18%, widening the gap that fintech brands need to close through better landing pages and onboarding flows. Fintech brands that implement progressive disclosure — showing only the minimum required fields at each stage — see 15–25% improvements in form-to-KYC completion rates. The most effective approach combines single-field email capture on the landing page with a multi-step onboarding flow that gradually requests personal and financial information.
Click Fraud Impact on Fintech Advertisers
FraudBlocker's 2026 analysis reveals that click fraud disproportionately affects financial services advertisers:
- $12.80 average CPC in US financial services — among the highest of any vertical.
- 5.5% unrefunded fraud rate — meaning $0.70 of every click is wasted on invalid traffic.
- Estimated 12–18% total invalid click rate before Google's automated filtering, which catches roughly two-thirds.
For a fintech brand spending $100,000/month, this translates to $5,500 in monthly waste from unrefunded fraudulent clicks. Third-party click fraud protection tools typically recover 30–50% of this waste, delivering a positive ROI at monthly spends above $10,000. Fintech brands in regulated verticals like lending and insurance are particularly vulnerable because their high CPCs amplify the per-click waste — a $25 CPC keyword with 5.5% fraud means $1.38 lost per fraudulent click, compared to $0.30 for a $5.42 average-industry click. Implementing IP exclusion lists, device fingerprinting, and real-time fraud detection can recover 60–80% of wasted spend.
Google Ads Performance by Campaign Type
Fintech brands use multiple Google Ads campaign types to capture demand at different funnel stages:
| Campaign Type | Best For | Typical CPC | Expected CVR |
|---|---|---|---|
| Search (Brand) | Defending brand queries | $1.50–$3.00 | 12–18% |
| Search (Generic) | High-intent prospecting | $6.00–$15.00 | 2.5–5.8% |
| Search (Competitor) | Capturing competitive traffic | $8.00–$20.00 | 1.5–3.0% |
| Performance Max | Cross-channel automation | $4.00–$8.00 | 3.0–6.0% |
| Display / Demand Gen | Awareness, retargeting | $0.50–$2.00 | 0.5–1.5% |
| YouTube / Video | Brand consideration | $0.10–$0.30 CPV | 0.3–1.0% |
Brand search delivers the highest conversion rates (12–18%) but the lowest incremental value since these users already know the brand. Generic search campaigns drive the bulk of new customer acquisition at the 2.5–5.8% conversion rate, while Performance Max offers a middle ground with automated cross-channel distribution.
Year-over-Year CPC Trends in Financial Services
Google Ads costs in financial services have risen steadily as competition intensifies. Historical data from ConversionStudio and WordStream tracks the trajectory:
| Year | Finance CPC | All-Industry CPC | Finance Premium |
|---|---|---|---|
| 2022 | $4.80 | $3.50 | +37% |
| 2023 | $5.20 | $3.80 | +37% |
| 2024 | $5.75 | $4.22 | +36% |
| 2025 | $6.10 | $4.80 | +27% |
| 2026 | $6.45 | $5.42 | +19% |
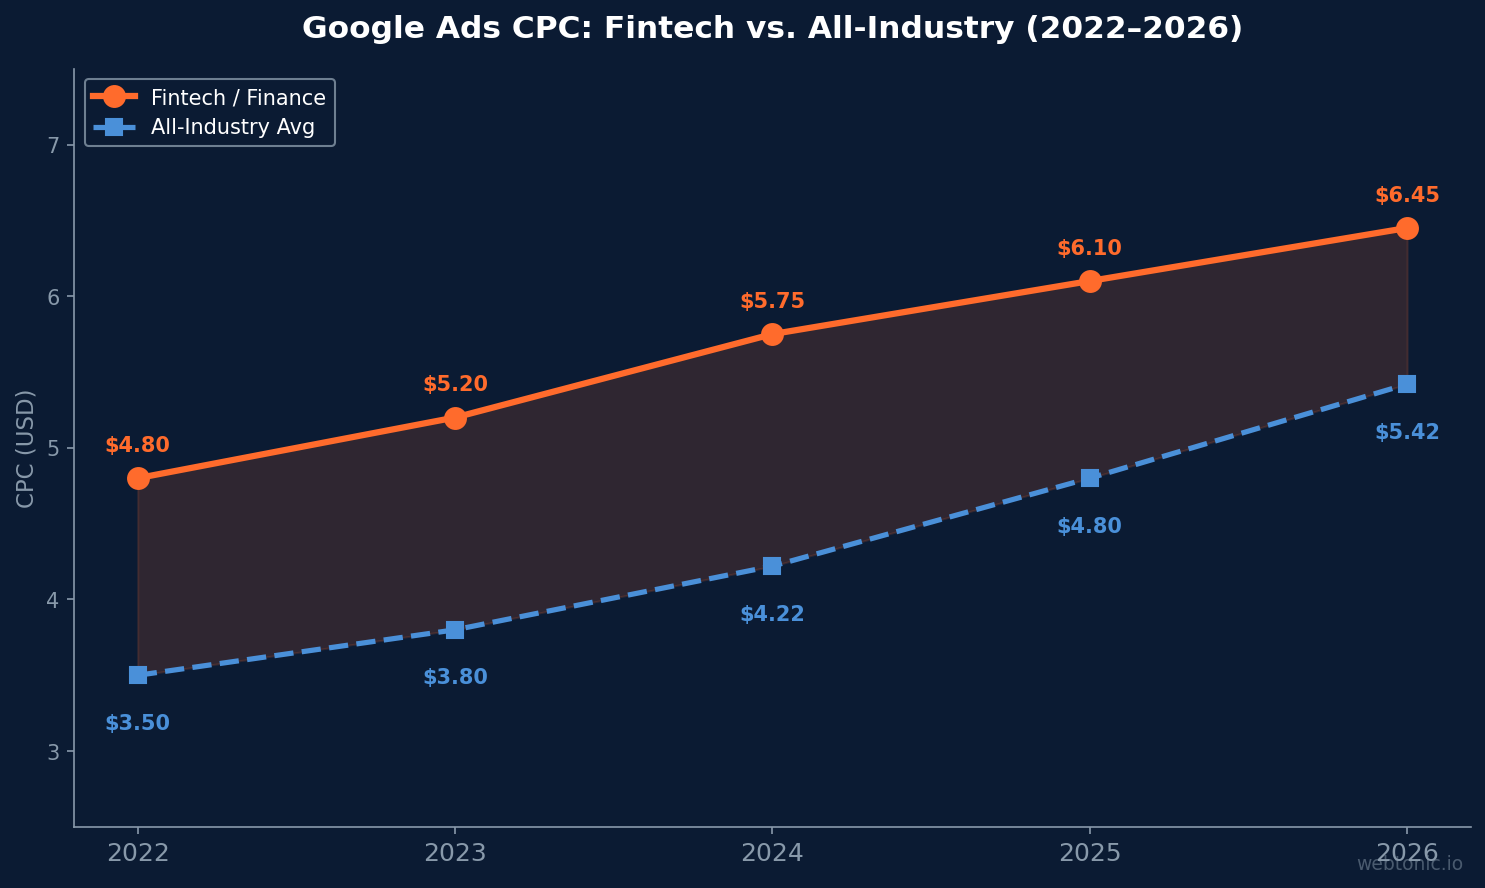
The finance CPC premium over all-industry averages has actually narrowed from 37% to 19% over four years — not because finance costs dropped, but because other industries caught up as Google Ads competition broadened. The absolute cost increase of 34% since 2022 ($4.80 to $6.45) reflects growing advertiser density in the fintech space, with neobanks, crypto platforms, and buy-now-pay-later brands all competing for the same high-intent keywords.
For fintech brands evaluating their growth marketing strategy, understanding these cost trajectories is critical for budgeting and channel allocation decisions. Brands spending $40,000–$60,000 per month on search should be projecting 8–12% annual CPC inflation into their forecasts.
Fintech vs. Other Industries on Google Ads
Where does fintech sit relative to other high-CPC industries?
| Industry | Avg CPC | Avg CVR | Avg CPL |
|---|---|---|---|
| Legal Services | $9.21 | 9.3% | $99.00 |
| Financial Services | $6.45 | 5.8% | $88.00 |
| B2B SaaS | $5.80 | 4.2% | $138.00 |
| Healthcare | $4.90 | 7.8% | $63.00 |
| E-commerce | $2.39 | 2.81% | $85.00 |
Fintech occupies a middle position between legal (highest CPC) and e-commerce (lowest), but the 5.8% conversion rate means the effective cost per lead is competitive. The $88 average CPL sits below B2B SaaS ($138) and aligns with legal ($99) despite the CPC gap — a function of the higher CTR that fintech ads achieve through strong keyword-ad alignment.
Best Practices for Fintech Google Ads Campaigns
For more context on Google Ads pricing across industries, our pricing guide provides a complete breakdown. The fintech-specific best practices below are calibrated to the unique challenges of financial advertising:
- Invest in click fraud protection — At $12.80 CPC and 5.5% unrefunded fraud, third-party tools pay for themselves above $10K monthly spend.
- Separate brand, generic, and competitor campaigns — Each segment has fundamentally different CPCs and conversion rates. Mixing them in one campaign makes performance analysis impossible.
- Optimize the post-click funnel relentlessly — The gap between the 8.3% CTR and 2.5–5.8% CVR indicates massive landing page and onboarding optimization opportunities.
- Use broad match with Smart Bidding for volume — Google's AI bidding performs best with broad match keywords and sufficient conversion data (30+ conversions per month minimum).
- Build negative keyword lists aggressively — Financial keywords trigger queries for free services, government programs, and educational content that waste budget.
- Implement enhanced conversions — Server-side conversion tracking recovers 5–15% of conversions lost to browser privacy restrictions, directly improving Smart Bidding performance.
- Test Performance Max for cross-channel reach — PMax campaigns discover inventory across Search, Display, YouTube, and Gmail at CPCs 20–40% below standalone campaigns in many fintech verticals.
Related reading
- Google Ads Quality Score: How to Read It and Fix It
- Types of Google Ads: All 9 Campaign Types and When to Use Each
- Google Ads Examples: What a Strong Ad Looks Like in All 7 Formats
- Paid Search services at Web Tonic
FAQ
What is the average CPC for fintech Google Ads in 2026?
The average CPC for fintech on Google Ads is $6.45 in 2026, up 12% from 2024 levels. However, costs vary significantly by sub-vertical: consumer neobank keywords average $3.50–$6.00, while lending and insurance keywords can reach $15–$25 per click. US financial services broadly averages $12.80 CPC.
What conversion rate should fintech companies expect from Google Ads?
Fintech companies should expect a 5.8% conversion rate on Google Search campaigns at the top of the funnel (click to form submission). The end-to-end conversion from click to funded active account typically runs 0.7–2.4%, reflecting KYC verification and account funding drop-off stages.
How much do fintech companies spend on Google Ads?
Top fintech companies spend between $60,000 and $1,000,000 per month on Google Ads. Kabbage leads at approximately $1M/month, while mid-tier fintechs like Stash and Tally invest $60K–$100K monthly. Optimal spend depends on product type, target CAC, and the available keyword inventory in your sub-vertical.
Is Google Ads more expensive than Facebook for fintech?
Yes — Google Ads CPA for fintech averages £68 (~$86) versus £52 (~$66) on Meta. However, Google delivers a higher ROAS (3.4x vs. 3.0x) because search captures higher-intent users actively researching financial products. Most fintech brands use both channels: Google for intent capture and Meta for demand generation. See our best Google Ads agencies list for partner recommendations.
How much click fraud affects fintech Google Ads?
Click fraud costs fintech advertisers approximately $0.70 per click at a 5.5% unrefunded fraud rate. At a $100K monthly budget, this represents $5,500 in wasted spend. The total invalid click rate before Google's automated filtering is estimated at 12–18%, with Google catching roughly two-thirds automatically.
Sources
https://cufinder.io/blog/benchmarks/fintech/
https://www.wordstream.com/blog/2026-google-ads-benchmarks
https://foundrycro.com/blog/fintech-marketing-benchmarks-by-product-type/
https://www.leverdigital.co.uk/post/fintech-marketing-benchmarks
https://ppcchief.com/google-ads-cost/finance
https://fraudblocker.com/articles/click-fraud/finance-industy
https://dev.prometheusppc.com/blog/how-much-do-fintech-companies-spend-on-google-ads/


