



Table of contents
Fintech Email Marketing Statistics: 2026 Benchmarks & Performance Data
Email remains the highest-ROI channel for fintech companies, generating $44 for every $1 spent in financial services. Unlike most industries where promotional emails dominate, fintech email success is built on utility — transactional alerts, security notifications, and personalized onboarding sequences that guide users through complex verification flows.
Key Takeaways
- $44 ROI per $1 spent — email marketing return in financial services, a 4,400% return (EmailMarketingForBusiness)
- 19.2% average open rate for fintech B2B emails, with transactional emails reaching 48% (42 Agency / CuFinder)
- 760% more revenue from segmented campaigns vs. non-segmented sends in financial services (EmailMarketingForBusiness)
- 42.36% open rate achieved through behavior-based personalization in financial emails (EmailMarketingForBusiness)
- 11.74% conversion rate for journey-based emails in banking and fintech (EmailMarketingForBusiness)
- 2.9% average CTR for fintech B2B emails, with top performers reaching 4.7% (42 Agency)
Fintech Email Open Rate & Engagement Benchmarks
Fintech email performance splits along two distinct lines: B2B fintech (lower volume, higher intent) and transactional/financial alerts (high open rates driven by urgency and utility). 42 Agency's analysis of 500M+ B2B marketing emails provides the most granular view of fintech-specific performance.
| Email Metric | Fintech B2B | Cross-Industry Avg. |
|---|---|---|
| Open Rate | 19.2% | 21.0% |
| Click-Through Rate (CTR) | 2.9% | 3.2% |
| Top 25% CTR | 4.7% | 5.1% |
| Bottom 25% CTR | 1.5% | 1.8% |
| Transactional Open Rate | 48% | ~35% |
| Behavior-Based Open Rate | 42.36% | ~30% |
A critical caveat: Apple Mail Privacy Protection (MPP) inflates open rates by 8–15%. Since MPP pre-loads tracking pixels, the 19.2% fintech open rate may overstate actual engagement. 42 Agency recommends using click-through rates as the primary engagement metric — the 2.9% fintech CTR is a more reliable indicator of real subscriber interest.
Transactional vs. Marketing Email Performance
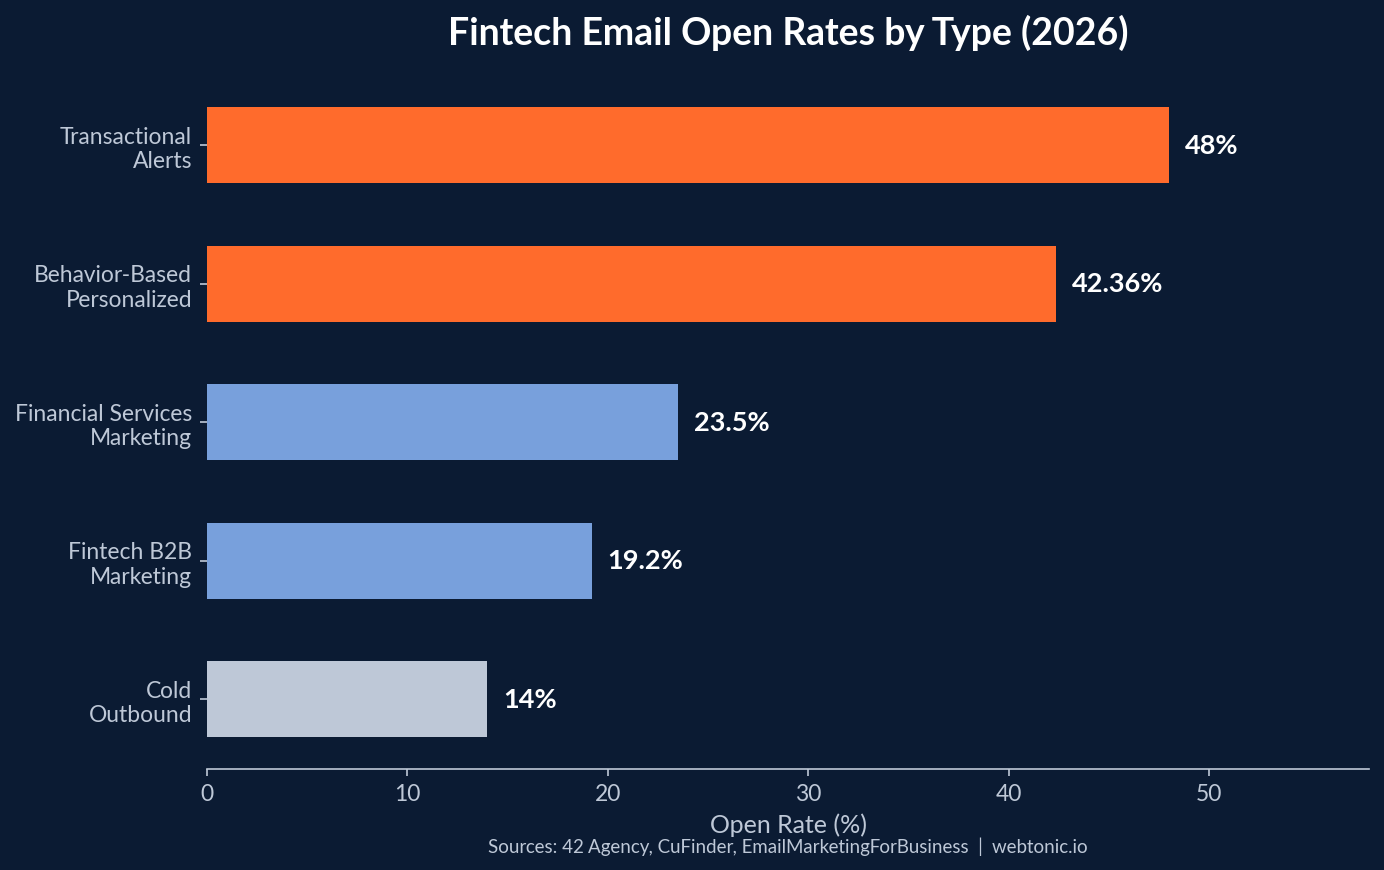
The distinction between transactional and marketing emails is particularly stark in fintech. CuFinder's 2026 benchmarks show transactional emails reaching a 48% open rate — more than double the marketing average — because they contain information users genuinely need: payment confirmations, security alerts, and account updates.
| Email Type | Open Rate | Primary Purpose | Cross-Sell Opportunity |
|---|---|---|---|
| Transactional Alerts | 48% | Payment, security, account updates | Subtle product mentions in footer |
| Behavior-Based | 42.36% | Triggered by user actions (KYC, deposits) | Contextual next-step suggestions |
| Marketing Newsletter | 23.5% | Market updates, product announcements | Feature highlights and upgrades |
| B2B Fintech Marketing | 19.2% | Lead nurture, product education | Demo requests and trial offers |
| Cold Outbound | 12–16% | Net-new prospect engagement | Single CTA, problem-specific |
The 48% transactional open rate creates a substantial cross-sell opportunity. Users who open payment confirmations and security alerts are already engaged and trusting — embedding subtle product mentions within transactional templates (while maintaining compliance) can drive incremental revenue without additional send costs.
Segmentation & Personalization Impact
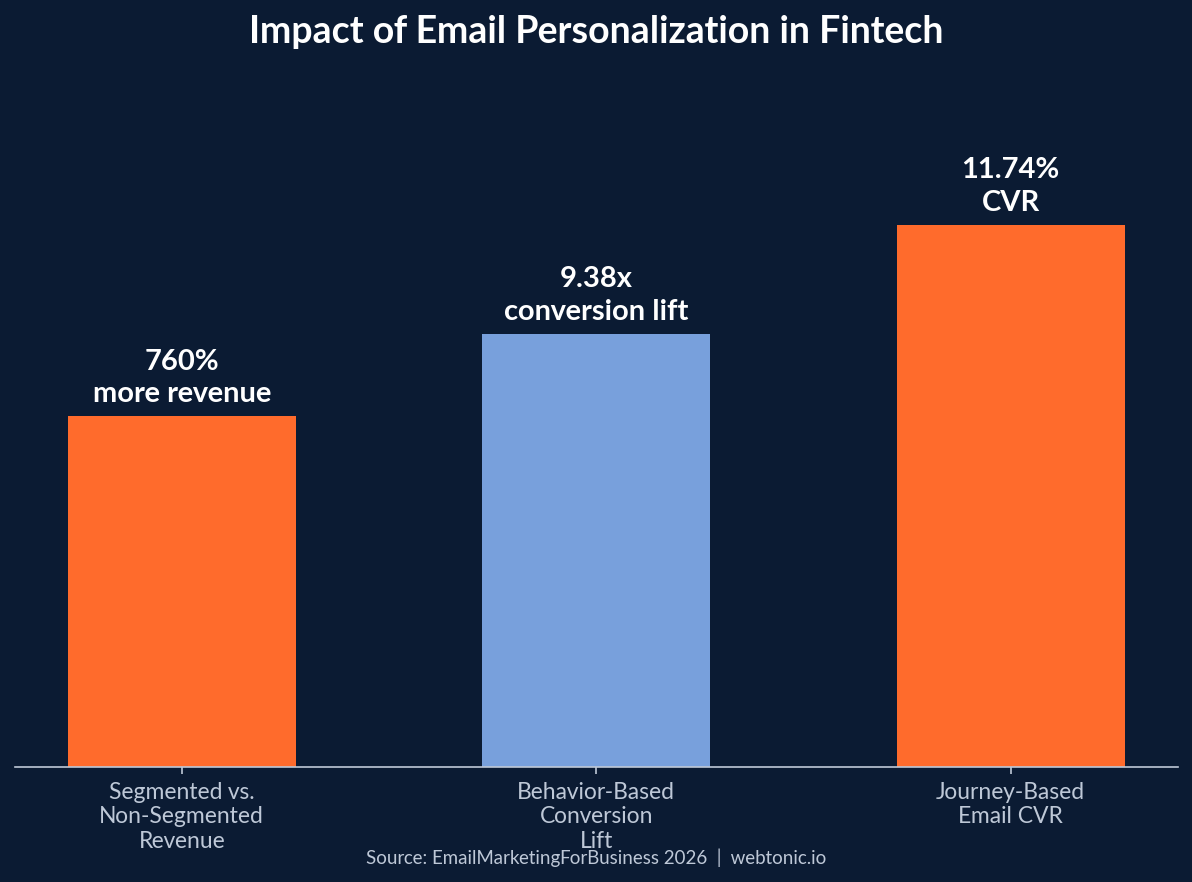
Segmentation represents the single largest performance lever in fintech email marketing. EmailMarketingForBusiness data shows that segmented campaigns generate 760% more revenue than non-segmented sends in financial services — a gap that widens further with behavior-based triggers.
| Personalization Strategy | Performance Impact |
|---|---|
| Segmented vs. Non-Segmented | 760% more revenue |
| Behavior-Based Personalization | 42.36% open rate (vs. 23.5% avg) |
| Behavior-Based Conversion Lift | 9.38x conversion rate increase |
| Journey-Based Email CVR | 11.74% conversion rate |
| Click-to-Open Rate (Personalized) | 21.64% |
When financial technology companies segment emails based on customer behavior — account type, transaction history, savings goals, and onboarding stage — open rates jump to 42.36% with click-to-open rates of 21.64%. Behavior-based emails deliver a 9.38x conversion lift compared to generic broadcasts, making personalization the highest-leverage investment in the email stack.
Onboarding Email Sequences
Fintech onboarding emails face unique challenges that standard SaaS welcome sequences cannot address. A detailed case study from a fintech platform processing 100–300 daily registrations reveals the three-cadence approach that drives activation:
- Orientation Cadence (Pre-KYC) — fires immediately after registration, explaining what the platform does, what happens next, and what documents users will need. Goal: reduce the "I am confused so I will come back later" drop-off that kills early activation
- KYC Progress Cadence — triggered when users initiate identity verification. Covers common document issues, review timelines, and clarification steps. Every message exists to help users complete KYC as fast as possible, because nothing else in the funnel matters until this step clears
- Activation Cadence (Post-KYC) — shifts tone to driving the first inbound payment. Priority changes from compliance assistance to feature adoption and value demonstration
Each cadence ties directly to the customer's real-time account status rather than arbitrary time delays. Lifecycle email systems that trigger based on milestones consistently outperform time-based drip sequences in fintech because the bottlenecks — KYC delays, document issues, compliance reviews — are unpredictable in timing.
The operational insight is that email and onboarding performance improve substantially when CRM signals, compliance team workflows, and customer support realities stay aligned. Every interaction within the lifecycle cadence feeds into lead scoring — which then syncs to sales and compliance teams — creating a closed-loop system where email engagement data informs prioritization across departments, not just the marketing function. Fintech companies that treat onboarding email as a cross-functional tool rather than a marketing-only channel see measurably faster time-to-first-transaction and higher customer satisfaction scores during the critical activation window.
Email ROI & Revenue Attribution
Financial services email marketing delivers some of the highest returns of any digital channel, but the ROI calculation in fintech requires careful attribution across long conversion windows.
| ROI Metric | Value | Source |
|---|---|---|
| ROI Per Dollar Spent | $44 (4,400% return) | EmailMarketingForBusiness |
| Financial Services Open Rate | 25.4% (highest across industries) | Folderly |
| Journey-Based CVR | 11.74% | EmailMarketingForBusiness |
| Personalized CVR Lift | 10x average ROI with compliance | Folderly |
| Mobile Email Opens | 55–65% of all opens | EmailMarketingForBusiness |
The $44 return per dollar makes email the most efficient channel in the fintech marketing stack by a wide margin. For context, paid social channels typically return $3–$8 per dollar, and paid search $2–$5. Financial services emails achieve the highest open rates across all industries at 25.4% (Folderly), driven by the critical nature of financial communications.
Deliverability & Compliance Considerations
Fintech email deliverability operates under stricter constraints than most industries. Regulatory requirements, security-sensitive content, and high-volume transactional sends create a unique deliverability profile.
- Hard bounce rate: 0.65% (fintech benchmark, CuFinder)
- Soft bounce rate: 0.90% (fintech benchmark)
- Apple MPP inflation: 8–15% on open rate metrics — use CTR as the primary reliability metric
- DMARC enforcement: progressive deployment from p=none to p=reject is critical for financial sender reputation
- Subdomain strategy: separate sending domains for transactional vs. marketing emails to protect deliverability
- Compliance requirements: GDPR, CCPA, PCI-DSS for emails containing financial data, CAN-SPAM opt-out within 10 business days
The low bounce rates (0.65% hard, 0.90% soft) reflect the fintech sector's emphasis on list hygiene — financial services companies face severe reputation penalties for hitting spam traps, and data quality directly impacts inbox placement across Gmail, Outlook, and Yahoo.
Email Performance by Financial Sub-Vertical
Email benchmarks vary significantly across fintech sub-verticals, reflecting different user relationships and communication patterns.
| Sub-Vertical | Open Rate | CTR | Key Driver |
|---|---|---|---|
| B2B Fintech (SaaS) | 19.2% | 2.9% | Product education + lead nurture |
| Consumer Neobanking | 28–35% | 3.5–4.2% | Account alerts + spending insights |
| Investment / WealthTech | 24–30% | 2.8–3.6% | Market updates + portfolio alerts |
| Lending / InsurTech | 22–27% | 2.2–3.0% | Application status + policy updates |
| Payments / P2P | 30–40% | 4.0–5.5% | Transaction confirmations + receipts |
Fintech Email Marketing vs. Other Industries
Financial technology email marketing occupies a unique position among industries — benefiting from high-utility communications that drive engagement while operating under regulatory constraints that limit creative freedom. Here is how fintech compares to peer verticals.
| Industry | Open Rate | CTR | Key Differentiator |
|---|---|---|---|
| FinTech (B2B) | 19.2% | 2.9% | Transactional utility drives 48% alert opens |
| SaaS / Software | 21.3% | 3.2% | Product update notifications + onboarding |
| Healthcare Tech | 23.4% | 3.8% | Appointment reminders + compliance content |
| Professional Services | 24.6% | 3.8% | Relationship-driven, high personalization |
| E-commerce | 15–18% | 2.0–2.5% | Promotional volume dilutes engagement |
| Manufacturing | 17.4% | 2.1% | Low frequency, specification-driven |
While fintech B2B open rates (19.2%) trail healthcare tech (23.4%) and professional services (24.6%) in marketing email metrics, fintech compensates through its transactional email advantage. The 48% open rate on payment confirmations and security alerts has no parallel in most other verticals, and these high-engagement touchpoints create a compounding trust effect that lifts marketing email performance over time. Companies that successfully bridge transactional and marketing messaging — by adding subtle cross-sell content to alerts — effectively operate a dual-channel email strategy within a single subscriber relationship.
The 760% revenue lift from segmentation is also larger than most industries see. Financial services benefit from rich behavioral data — transaction patterns, spending categories, account balances, and product usage — that enables hyper-specific segments unavailable to most B2B or e-commerce senders. A data-driven marketing approach that leverages these signals consistently outperforms generic broadcast strategies.
Best Practices for Fintech Email Marketing
- Build milestone-based sequences, not time-based drips — trigger emails from real account status changes (KYC initiated, first deposit made) rather than "Day 3 after sign-up"
- Segment by behavior, not just demographics — behavior-based campaigns deliver 9.38x conversion lift and 42.36% open rates vs. 23.5% for generic sends
- Leverage transactional email real estate — the 48% open rate on transactional messages represents the highest-attention touchpoint in your email program
- Separate sending infrastructure — use distinct subdomains for transactional and marketing emails to protect deliverability reputation
- Track CTR over open rate — Apple MPP inflates opens by 8–15%, making click-through rate the more reliable performance indicator
- Optimize for mobile — 55–65% of fintech emails are opened on mobile devices, requiring thumb-friendly design and fast load times
- Implement progressive DMARC — move from p=none to p=reject to protect sender reputation and comply with Gmail and Yahoo authentication requirements
Related reading
- 42 Networking Email Subject Lines That Get Opened
- 68 Email Newsletter Ideas, Sorted by the Job Each Send Does
- Video Email Marketing Budgets for 2026
- Email Marketing services at Web Tonic
FAQ
What is the average fintech email open rate?
Fintech B2B emails average a 19.2% open rate (42 Agency), while broader financial services marketing emails reach 23.5% (CuFinder). Transactional fintech emails achieve 48% open rates, and behavior-based personalized campaigns hit 42.36%. Note that Apple MPP inflates all open rates by 8–15%.
What ROI does email marketing deliver for fintech companies?
Financial services email marketing generates $44 for every $1 spent — a 4,400% return. This makes email the highest-ROI channel in the fintech marketing mix, significantly outperforming paid social ($3–$8 per dollar) and paid search ($2–$5 per dollar).
How does segmentation affect fintech email performance?
Segmented campaigns generate 760% more revenue than non-segmented sends in financial services. Behavior-based segmentation delivers a 9.38x conversion lift and pushes open rates from 23.5% to 42.36%. Journey-based emails achieve an 11.74% conversion rate.
What is a good click-through rate for fintech emails?
The average fintech B2B email CTR is 2.9%, with top 25% performers reaching 4.7%. Consumer fintech sub-verticals like payments and neobanking tend to see higher CTRs (3.5–5.5%) due to the utility-driven nature of their communications.
How should fintech companies structure onboarding emails?
Use a three-cadence approach tied to real account milestones: orientation (pre-KYC), KYC progress (during verification), and activation (post-approval). Each cadence should trigger based on the user's actual account status rather than arbitrary time delays, because KYC bottlenecks are unpredictable in timing.
Sources
42 Agency — B2B Email Marketing Benchmarks 2026 (500M+ emails)
CuFinder — FinTech Industry Marketing Benchmarks 2026
EmailMarketingForBusiness — 45 Email Marketing Stats for Banks (2026)
Daniel Liu — Rebuilding Fintech Onboarding Email System
Folderly — Financial Services Email Marketing Compliance & Security
FoundryCRO — Fintech Marketing Benchmarks by Product Type


