



Table of contents
Fintech Analytics & Tracking Statistics: 2026 Benchmarks
The fintech analytics market reached $5.3 billion in 2026, expanding at a 25% CAGR toward a projected $40 billion by 2035. Here are the numbers shaping how financial technology companies measure, track, and optimize performance across fraud detection, onboarding, engagement, and revenue.
Key Takeaways
- $5.3 billion — fintech business analytics market size in 2026, up from $4.3B in 2025 (Research Nester)
- 25% of organizations now use AI/ML in anti-fraud analytics, up from 18% in 2024 (ACFE/SAS)
- 8+ verification steps in typical fintech onboarding funnels require discrete event tracking (Kissmetrics)
- 68% of fintech traffic comes from mobile devices, demanding mobile-first analytics architecture (CuFinder)
- 70% of businesses expect fraud and abuse to limit revenue growth without stronger analytics (Adyen)
- 6–12 engineering months to build in-house fintech analytics vs. 2–6 weeks with embedded platforms (DataBrain)
Fintech Analytics Market Size & Growth
Business analytics in fintech is expanding as companies seek competitive edges through data-driven decisions. The market reached $4.3 billion in 2025 and is on track for $5.3 billion in 2026, with a 25% compound annual growth rate through 2035.
| Metric | Value | Source |
|---|---|---|
| 2025 Market Size | $4.3 billion | Research Nester |
| 2026 Market Size | $5.3 billion | Research Nester |
| 2035 Projected Size | $40 billion | Research Nester |
| CAGR (2026–2035) | 25% | Research Nester |
| Largest Region | North America (38% share) | Research Nester |
| Fastest Growing Region | Asia Pacific | Research Nester |
| Global Fintech Revenue (2025) | $500B+, 22% YoY growth | CuFinder / industry reports |
| Equity Funding (2025) | $58B, up 53% YoY | Industry reports |
North America dominates with a 38% market share, driven by the concentration of fintech headquarters and data infrastructure investment. Cloud deployment leads adoption patterns, accounting for the majority of new implementations as financial technology firms prioritize scalability, real-time processing, and regulatory-compliant data storage across multiple jurisdictions.
AI & Machine Learning in Fraud Analytics
Fraud detection represents the fastest-growing application of analytics in financial technology. The ACFE/SAS 2026 Anti-Fraud Technology Benchmarking Report reveals that 25% of organizations now use AI/ML in their anti-fraud analytics programs, a significant jump from 18% in 2024. Another 28% plan to adopt within two years, pushing projected adoption past 53% by 2028.
| AI/ML Fraud Analytics Metric | Value |
|---|---|
| Current AI/ML Adoption | 25% of organizations (2026) |
| Previous AI/ML Adoption | 18% of organizations (2024) |
| Expected Adoption by 2028 | 53%+ (28% plan to adopt in 1–2 years) |
| Cloud-Native Fraud Detection | 10% of organizations currently |
| Automated Red Flag Analysis | ~50% of organizations |
| AI Preparedness (Detecting AI-Powered Fraud) | Only 7% moderately+ prepared |
According to Adyen's 2026 Fraud Report — which analyzed $1.6 trillion in transaction data — fraud losses from chargebacks declined 20% in 2025, yet the average fraudulent dispute value dropped 23%. This indicates fraud is shifting to higher volumes of lower-value transactions that are harder to detect with rules-based systems. Nearly 70% of businesses expect fraud to constrain revenue growth, and 50% report an increase in false declines, creating a direct conflict between fraud prevention and customer experience.

Onboarding Funnel & Conversion Tracking
Fintech onboarding is structurally different from standard SaaS sign-ups. According to Kissmetrics' fintech analytics guide, a typical neobank account opening requires eight or more discrete verification steps, each demanding individual event instrumentation:
- Email registration
- Phone verification
- Personal information entry
- Identity document upload
- Selfie verification
- Address verification
- Regulatory disclosures acknowledgment
- Initial deposit
Each step carries its own failure modes and drop-off patterns. Treating onboarding as a single conversion event — a surprisingly common analytics mistake — obscures where users actually abandon. Kissmetrics recommends instrumenting every step as a discrete event and tracking anonymized transaction metadata: counts, aggregated average values, feature usage patterns, and funnel completion rates.
The practical impact is substantial. CuFinder benchmarks show that while landing page registration conversion hits 4.6%, only 18% of registrants progress to a funded account. That means 82% of users who start never complete the journey — and without step-level tracking, analytics teams cannot identify where or why.
Web & Mobile Analytics Benchmarks
CuFinder's 2026 benchmarks reveal how users interact with fintech platforms across devices and sessions, highlighting the mobile-first reality that drives analytics architecture decisions.
| Engagement Metric | Value |
|---|---|
| Mobile Traffic Share | 68% |
| Desktop Traffic Share | 29% |
| Avg. Time on Page (Mobile) | 54 seconds |
| Avg. Time on Page (Desktop) | 2 min 15 sec |
| Pages Per Session | 3.2 |
| Avg. Bounce Rate | 48.5% |
| Mobile Bounce Rate | 54% |
| Desktop Bounce Rate | 38% |
| Day 1 App Retention | 28% |
| Day 30 App Retention | 14% |
| Sub-2s Load Time Engagement Lift | 40% higher |
The 28% to 14% retention drop between Day 1 and Day 30 is the industry's most critical analytics signal. Acquisition metrics may look strong, but retention cohort tracking reveals half of new users churn within a month. Applications with sub-2-second load times see 40% higher engagement rates, making performance monitoring an essential part of the analytics stack, not just an infrastructure concern.
Mobile analytics architecture deserves particular attention. With 68% of traffic on mobile and a 16-percentage-point gap between mobile and desktop bounce rates (54% vs. 38%), desktop-first dashboards and analytics configurations miss the primary user experience. Session duration is also dramatically different — users spend 54 seconds on mobile compared to 2 minutes and 15 seconds on desktop, requiring different engagement measurement frameworks for each platform.
Traffic Source Attribution
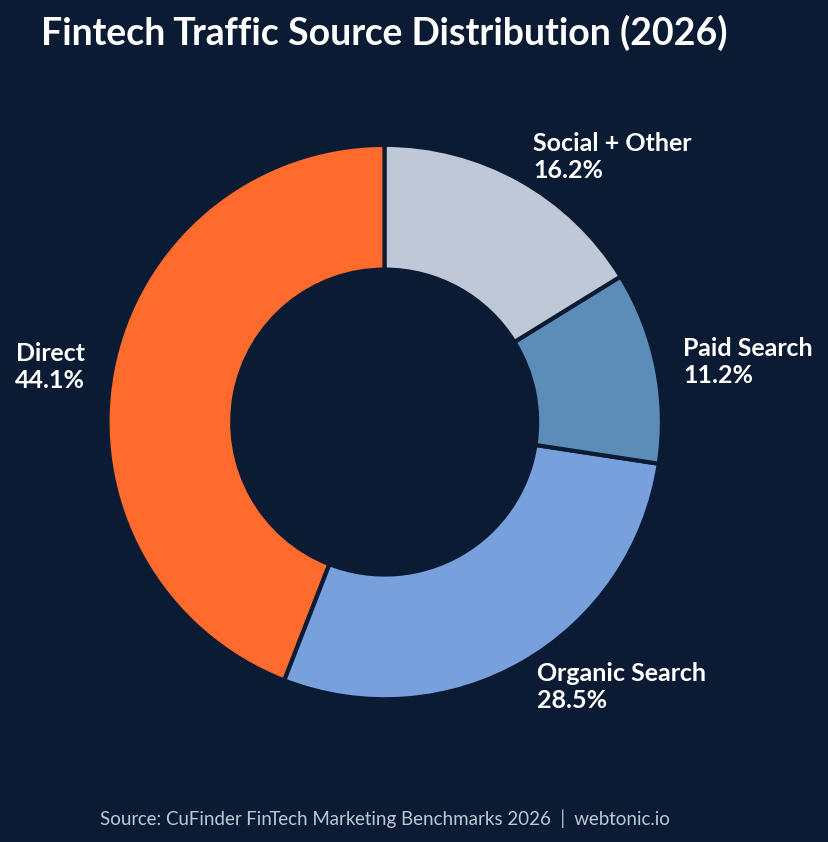
Understanding how users discover fintech platforms shapes attribution modeling and data intelligence strategy. Direct traffic leads at 44.1%, signaling strong brand recognition across the sector.
| Traffic Source | Share | Analytics Implication |
|---|---|---|
| Direct | 44.1% | Brand maturity; app launches + returning users |
| Organic Search | 28.5% | Primary new customer acquisition channel |
| Paid Search | 11.2% | High-intent but expensive; $6.45 avg CPC |
| Social + Other | 16.2% | Growing via B2B LinkedIn + consumer social |
Fintech companies with 40%+ direct traffic spend 35% less on customer acquisition than competitors relying on paid channels. This dynamic makes multi-touch attribution models essential — when nearly half of all traffic arrives with no referrer data, first-touch and last-touch models dramatically misallocate credit.
Embedded Analytics & Platform Architecture
Fintech companies increasingly embed customer-facing analytics directly into their products. According to DataBrain's 2026 analysis, fintech embedded analytics faces four simultaneous architectural constraints that other verticals do not encounter together:
- PCI-DSS scope minimization — every dashboard view must comply with payment card data security standards
- Real-time + historical data layering — payments require sub-minute freshness while wealth-tech AUM reports are daily
- Audit-log immutability — SOC 2, GDPR, and CFPB Section 1033 require permanent records of all data access
- Multi-currency / multi-entity default — international operations are the rule, not the exception
Building this stack in-house typically takes 6–12 engineering months for a Series A fintech, while embedded analytics platforms deliver equivalent capability in 2–6 weeks. The emerging pattern in 2026 includes AI-powered anomaly detection on customer-facing metrics, natural-language querying for self-service, and predictive views such as forecasted cashflow and reconciliation variance analysis.
Conversion & Revenue Tracking Benchmarks
Fintech conversion measurement requires calibration that standard growth marketing frameworks do not provide. The gap between top-of-funnel and revenue-stage metrics is significantly wider than in most industries.
| Conversion Metric | Benchmark | Context |
|---|---|---|
| Landing Page CVR | 4.6% | Registration only, not activation |
| Registration → Funded | 18% | 82% never complete onboarding |
| Neobank Signup → Active | 60–70% | After KYC completion |
| Lending Signup → Active | 40–60% | Credit check attrition |
| P2P Payments Signup → Active | 70–85% | Low friction, high viral coefficient |
| LTV:CAC Ratio | 3.5:1 | Industry sustainability benchmark |
| YoY Traffic Growth | +14.5% | Across small-to-mid-cap fintechs |
Fintech Analytics vs. Traditional Financial Services
Fintech analytics differs from traditional banking analytics in speed, granularity, and user expectations. While incumbent banks typically rely on batch-processed daily reports and rules-based fraud detection, fintech platforms demand sub-minute data freshness for payments processing, real-time anomaly detection, and self-service customer dashboards embedded directly into the product experience.
| Dimension | Fintech | Traditional Banking |
|---|---|---|
| Data Freshness | Sub-minute (payments) | Daily / batch processing |
| User-Facing Dashboards | Embedded, self-service | Portal logins / PDF reports |
| Fraud Detection | 25% AI/ML adoption (growing) | Rules-based (~50%) |
| Onboarding Steps Tracked | 8+ discrete events | 1–3 aggregate events |
| Mobile Analytics Priority | 68% traffic, primary focus | Secondary channel |
| Compliance Overlay | PCI-DSS + SOC 2 + GDPR + CFPB | Established regulatory frameworks |
The compliance gap is particularly notable. Fintech analytics must navigate PCI-DSS scope minimization, SOC 2 audit requirements, GDPR data access rights, and increasingly CFPB Section 1033 open banking mandates — often simultaneously across multiple jurisdictions. Traditional banks face similarly heavy regulation but through established compliance frameworks rather than the build-from-scratch approach most fintechs encounter. This regulatory overhead directly impacts analytics architecture decisions, adding 15–30% to development timelines for any customer-facing data product.
Best Practices for Fintech Analytics
- Instrument every onboarding step — track 8+ events from registration through first transaction, not one aggregate conversion
- Separate behavioral from financial data — clicks, sessions, and funnel progression are generally safe to collect; individual transaction data requires additional compliance controls
- Build mobile-first dashboards — with 68% mobile traffic and a 54% mobile bounce rate, desktop-centric analytics miss the primary user experience
- Adopt multi-touch attribution — 44.1% direct traffic makes single-touch models unreliable for budget allocation
- Track retention cohorts weekly — the Day 1 to Day 30 drop from 28% to 14% requires cohort analysis to diagnose churn triggers
- Invest in AI/ML for fraud analytics — organizations using AI/ML detect fraud earlier and reduce false declines; adoption is projected to exceed 53% by 2028
- Evaluate embedded analytics platforms — unless analytics is the core product, the 2–6 week implementation path typically outperforms 6–12 months of in-house development
Related reading
- Insurance Tracking and Analytics Data on Lead Attribution Errors
- Family Law Analytics and Intake Data Statistics for Firms
- DUI Arrest Recurrence Trends In Criminal Law Tracking Data
- Marketing Analytics services at Web Tonic
FAQ
What is the fintech analytics market size in 2026?
The business analytics in fintech market is valued at $5.3 billion in 2026, growing at a 25% CAGR from $4.3 billion in 2025 toward a projected $40 billion by 2035. North America holds the largest share at 38%, with Asia Pacific as the fastest-growing region.
How many organizations use AI for fraud detection in fintech?
25% of organizations now use AI and machine learning in their anti-fraud analytics programs, up from 18% in 2024. An additional 28% plan adoption within two years, pushing projected usage past 53% by 2028 according to the ACFE/SAS 2026 report.
What are the key fintech web analytics benchmarks?
Fintech platforms average a 48.5% bounce rate, 3.2 pages per session, and 54-second average time on page for mobile (vs. 2 min 15 sec on desktop). Mobile accounts for 68% of traffic, and applications with sub-2-second load times see 40% higher engagement.
How should fintech companies track onboarding conversions?
Track each of the 8+ onboarding steps — registration, phone verification, KYC document upload, selfie verification, and beyond — as discrete analytics events. With only 18% of registrants reaching funded-account status, step-level tracking is essential to identify and fix specific drop-off points.
What is a good LTV:CAC ratio for fintech?
The industry benchmark is 3.5:1. Customer acquisition costs range from $50 for consumer neobanks to $14,772 for enterprise fintech, so maintaining this ratio requires full-lifecycle analytics tracking, not just first-conversion measurement.
Sources
Research Nester — Business Analytics in Fintech Market 2026–2035
ACFE/SAS — 2026 Anti-Fraud Technology Benchmarking Report
Adyen — 2026 Fraud Report ($1.6T transaction data)
CuFinder — FinTech Industry Marketing Benchmarks 2026
Kissmetrics — Analytics for Fintech: Track User Behavior
DataBrain — Embedded Analytics for Fintech SaaS (2026)
FoundryCRO — Fintech CAC Benchmarks by Product Type


