



Table of contents
Fintech Ad Creative Statistics for 2026
Creatives fatigue in 14-21 days and 30+ fresh variations per month are the new baseline. Here are 55+ fintech ad creative benchmarks from Q1 2026.
Key Takeaways
- Median fintech ad creative lifespan is 28 days — 26% longer than the cross-industry average (Benly)
- UGC outperforms studio creative by 1.6-2.4x on CPA across fintech Meta accounts (BrighterClick)
- Video content represents 48.6% of all fintech creatives on Meta platforms (Benly)
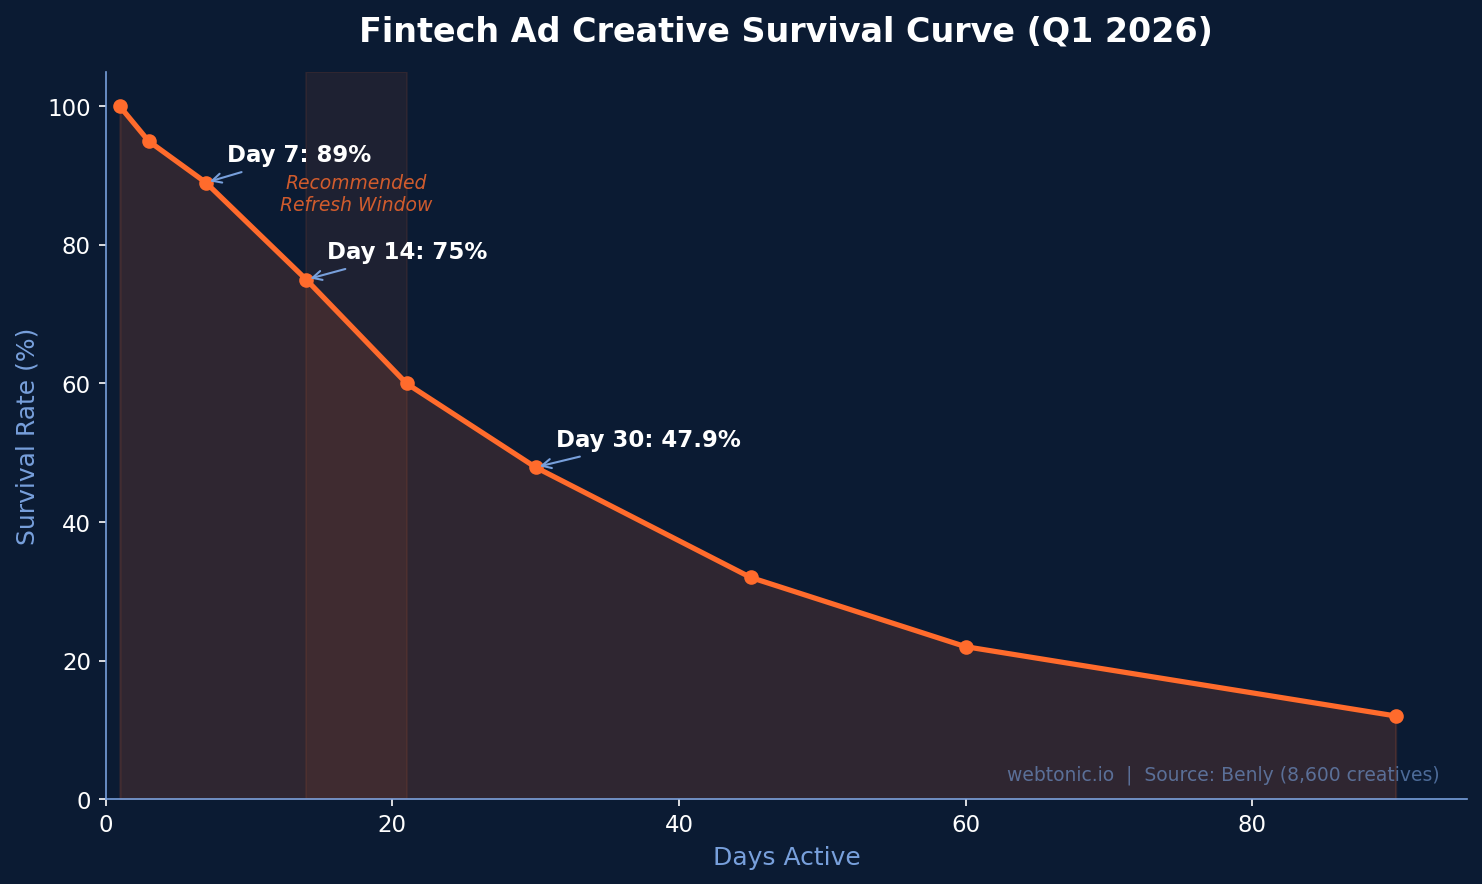
- Neobank CPMs range $18-$28 while lending hits $25-$45 on Meta (AdLibrary)
- Dynamic display ads achieve 0.76% CTR — 117% higher than static fintech ads (Viewst)
- N26 cut acquisition costs 65% with creative diversification including UGC (Creative Milkshake)
- Fintech CAC crossed $1,450 per funded customer in Q1 2026 (BrighterClick)
Creative Lifespan and Fatigue Benchmarks
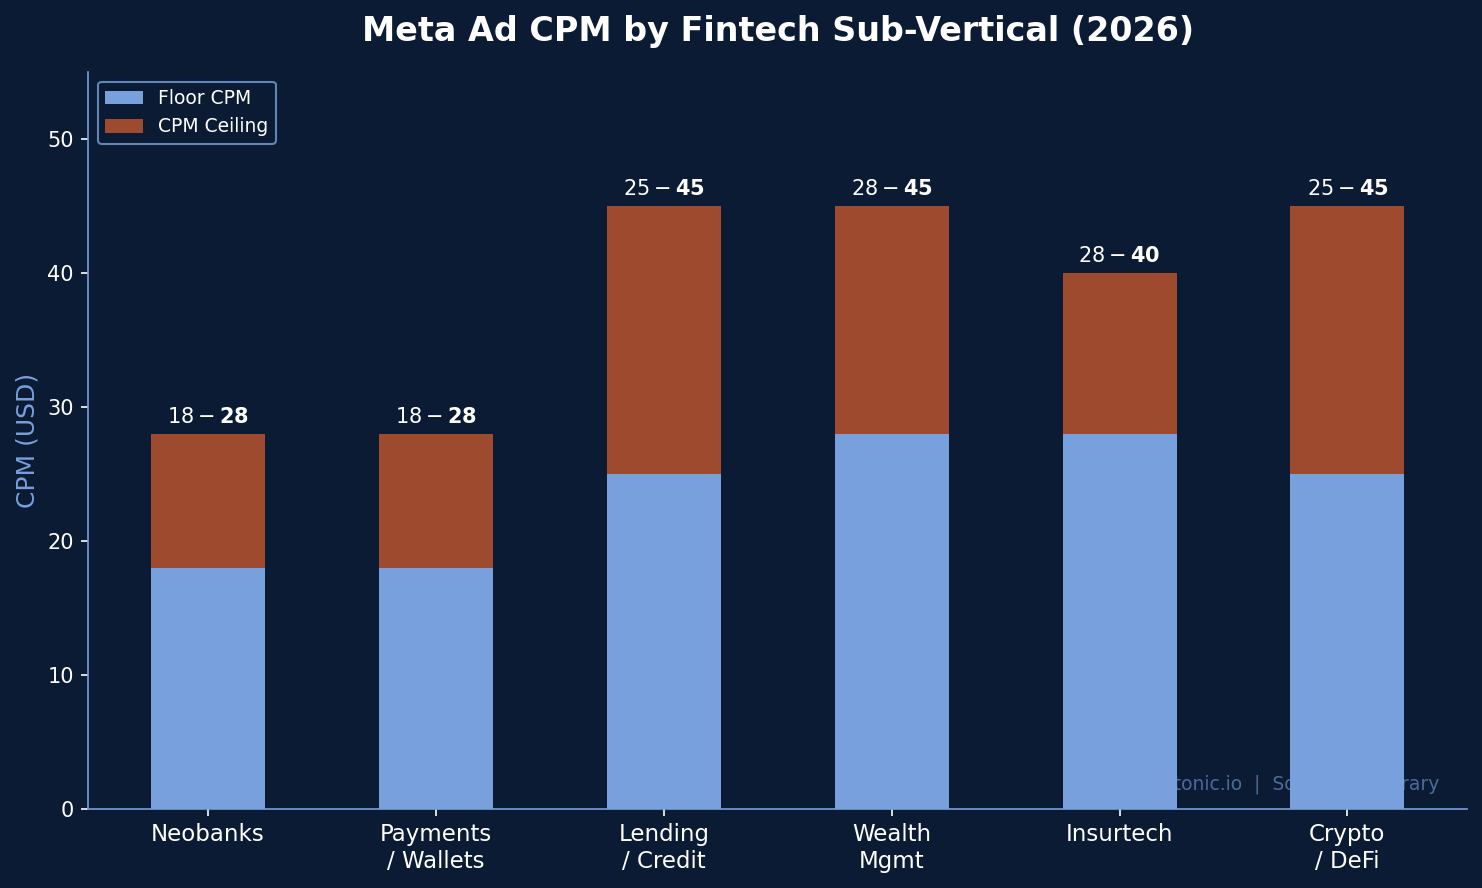
Creative fatigue is the defining constraint in fintech advertising. Benly analyzed 8,600 unique ad creatives from 70 finance and fintech brands running on Meta platforms during Q1 2026, representing an estimated 31,000 total ad impressions tracked through their AI-powered creative analysis engine.
| Creative Fatigue Metric | Fintech Benchmark | vs. Cross-Industry Avg. |
|---|---|---|
| Median creative lifespan | 28 days | +26% |
| 30-day survival rate | 47.9% | +10.8 percentage points |
| Day 7 survival rate | 89% | Baseline |
| Day 14 survival rate | 75% | Baseline |
| Recommended refresh cadence | 14-21 days | N/A |
| Recommended fresh variations/month | 30+ per product | N/A |
The data shows an interesting tension: while fintech creatives survive 26% longer than average, the recommended refresh cadence is actually shorter (14-21 days). This is because the single biggest CPA lever is creative quality and freshness — letting creatives run past their optimal window does not kill them immediately, but it steadily inflates acquisition costs as frequency rises and engagement drops. Brands running performance creative programs with systematic refresh cycles consistently outperform those with ad-hoc creative production.
Meta Ad Benchmarks by Fintech Sub-Vertical
Generic "financial services" benchmarks are misleading because CPMs, CPAs, and CTRs vary by as much as 5x between fintech sub-verticals. AdLibrary's 2026 analysis breaks down the structural drivers behind each range, revealing why comparing a neobank to a wealth management platform produces meaningless averages.
| Sub-Vertical | CPM Range | CPA Range | Key Driver |
|---|---|---|---|
| Neobanks / Digital Banking | $18-$28 | $35-$90 per account open | Low friction onboarding |
| Payments / Wallets | $18-$28 | $25-$60 | Transaction volume focus |
| Lending / Credit | $25-$45 | $80-$250 | Higher regulatory friction |
| Wealth Management / Investment | $28-$45 | $120-$400+ | Special Ad Category + high ACV |
| Insurtech | $28-$40 | $45-$150 | Consideration cycle length |
| Crypto / DeFi | $25-$45 | Highly variable | Platform restrictions + trust deficit |
The structural reason wealth management CPMs run 50-100% higher than neobank CPMs is the Special Ad Category designation. Housing, credit, and employment ads face restricted targeting, which compresses the available audience and drives up auction prices. For fintech marketers benchmarking their Meta ad performance, comparing against the right sub-vertical is essential — a $60 CPA is excellent for neobanks but catastrophic for payment apps targeting high-volume, low-margin transactions.
Video vs. Static Creative Performance
The shift toward video creative in fintech is accelerating, driven by both platform algorithm preferences and measurable performance differences across every key metric from click-through rates to app installs.
| Format Metric | Statistic | Source |
|---|---|---|
| Video share of fintech creatives | 48.6% of all creatives | Benly |
| Video ad install likelihood vs. banner | 14x more likely to drive install | Liftoff |
| Financial services video creation growth | +189% YoY | Vidyard via Vidico |
| Dynamic display CTR vs. static | 0.76% vs. 0.35% (+117%) | Viewst |
| Finance/insurance display CVR | 1.19% | Viewst |
| Most common opening hook style | "Bold Statement" | Benly |
| Predominant production style | Graphic Design | Benly |
Video ads are 14x more likely to drive an app install than banner ads, which explains the rapid shift in budget allocation: financial services companies increased video creation by 189% year-over-year. On Meta specifically, format-native vertical video is required for Reels placement, and brands achieving low CPM with acceptable CPA on Reels are running authentic-feeling short-form video that does not look like a TV commercial reformatted for mobile. The predominant production style remains Graphic Design over live-action, suggesting that motion graphics and animated explainers outperform talking-head content for fintech audiences.
UGC and Creator-Led Creative Performance
User-generated content has emerged as the dominant creative strategy for consumer fintech companies, with data showing consistently superior performance over polished studio production across multiple measurement periods and account types.
- UGC outperforms studio creative by 1.6-2.4x on CPA across fintech Meta accounts over 18 months (BrighterClick)
- The CPA gap is widest on consumer fintech products where trust is the primary conversion blocker for new users (BrighterClick)
- N26 achieved a 65% drop in acquisition cost with creative diversification including lo-fi UGC and audience alignment (Creative Milkshake)
- Salt Bank's Video Action Campaign performed comparably to branded search using authentic-feeling video creative for neobank account opens (Data Revolt Agency)
- Instagram Feed static ads with dense text copy underperform — visual quality and brand identity matter more than copy volume (AdLibrary)
The N26 case study is particularly instructive: by diversifying from polished studio ads to include lo-fi UGC and audience-matched creative variations, the neobank cut acquisition costs by 65% across every measured metric. This aligns with BrighterClick's finding that UGC-driven Meta campaigns consistently deliver 1.6-2.4x better CPA because they overcome the trust barrier that blocks conversions for financial products. The authentic, relatable format signals "real person, real experience" — exactly what hesitant prospects need before trusting an app with their money.
Placement Performance and Instagram Feed Benchmarks
Placement selection significantly impacts creative performance in fintech advertising. AdLibrary's sub-vertical analysis reveals that creative quality requirements vary dramatically by placement, with Instagram Feed demanding stronger visual design than other surfaces.
- Instagram Feed CPM for fintech: $18-$38, with CTR ranging 0.55-0.90% depending on sub-vertical (AdLibrary)
- Neobanks and investment apps with strong brand visual identity outperform lenders who rely on copy-heavy static ads in Feed placement (AdLibrary)
- Static ads with dense text copy systematically underperform on Instagram Feed — visual quality is the dominant signal for engagement and click-through (AdLibrary)
- Finance and insurance display ads convert at 1.19% CVR, outperforming most industries and proving that trust barriers can be overcome with well-designed creative (Viewst)
- Reels requires format-native vertical video — brands hitting low CPM on Reels are running authentic short-form content, not reformatted horizontal ads (AdLibrary)
The placement data reinforces a core lesson for fintech advertisers: each placement has its own creative language. What works in Feed (clean visual design, minimal text, strong brand identity) fails on Reels (which rewards authenticity and motion), and what works in Stories (urgency-driven, swipe-up CTAs) underperforms in Audience Network. Brands running a single creative across all placements are leaving significant efficiency on the table compared to those building placement-specific creative variants.
Paid Search and Cross-Channel Benchmarks
While Meta and social ads dominate fintech creative discussions, search and cross-channel benchmarks provide essential context for budget allocation decisions and full-funnel performance measurement.
| Channel Metric | Fintech Benchmark | Source |
|---|---|---|
| Google Ads CPC (fintech) | $6.45 | CuFinder |
| Search Ads CTR | 3.9% | CuFinder |
| Social Ads CTR | 0.90% | CuFinder |
| Landing page CVR | 4.6% | CuFinder |
| Registration to funded account CVR | 18% | CuFinder |
| LTV to CAC ratio benchmark | 3.5:1 | CuFinder |
| Fintech CAC (funded customer) | $1,450 (Q1 2026) | BrighterClick |
| Day 30 app retention | 14% | CuFinder |
The $6.45 average CPC for fintech Google Ads is 12% higher than 2024 levels, reflecting intensifying competition from both established banks and venture-backed challengers. Combined with the $1,450 CAC for a funded customer, this data underscores why creative quality is the primary lever — small improvements in CTR and conversion rate compound dramatically at these cost levels. The 14% Day 30 retention rate also highlights that acquisition without activation and retention strategy is increasingly unsustainable, pushing the most efficient fintechs toward full-funnel optimization rather than top-of-funnel spend increases alone.
Creative Strategy Recommendations from the Data
The data points toward six actionable strategies that separate efficient fintech advertisers from those burning through creative budgets without sustainable results.
- Refresh creative every 14-21 days with 30+ variations per product to prevent CPA inflation (AdFuse AI)
- Prioritize UGC and authentic content over polished studio production for consumer-facing products (BrighterClick)
- Lead with "Bold Statement" hooks — the most effective opening format across fintech verticals (Benly)
- Invest in format-native vertical video for Reels — authentic short-form, not reformatted TV spots (AdLibrary)
- Test dynamic display ads — 117% higher CTR than static for fintech brands (Viewst)
- Benchmark CPA by sub-vertical not generic "financial services" — a $60 CPA is excellent for neobanks but catastrophic for payment apps
The Cost of Creative Stagnation
The aggregate data paints a clear picture of what happens when fintech brands underinvest in creative production. With a $1,450 CAC per funded customer and a 14% Day 30 retention rate, the margin for error is razor-thin. Every creative that runs past its optimal window inflates CPA, every placement served with non-native formats wastes impressions, and every month without fresh UGC variations cedes ground to competitors who have systematized their creative operations. The fintechs that treat creative production as a continuous, data-informed process rather than an occasional campaign asset are the ones achieving sustainable unit economics in 2026. The benchmarks in this guide provide the baseline against which creative teams should measure their output — not as targets to hit once, but as ongoing standards to maintain through disciplined testing, rapid iteration, and placement-specific optimization across every active channel.
Related reading
- Construction Materials Ad Creative Statistics: 65+ Data Points for 2026
- Countertops Ad Creative Statistics: Performance Benchmarks, Trends & Design Data
- Dental Ad Creative Statistics & Data 2026
- Branding services at Web Tonic
Frequently Asked Questions
How long do fintech ad creatives last before fatigue?
The median fintech ad creative stays active for 28 days, 26% longer than the cross-industry average. About 47.9% of creatives survive past 30 days. However, the recommended refresh cadence is 14-21 days with 30+ fresh variations per product per month to keep CPA optimized.
What is the average CTR for fintech ads?
Fintech search ads average 3.9% CTR, while social ads average 0.90%. Instagram Feed fintech ads see 0.55-0.90% CTR, with visual quality mattering more than copy density. Neobanks and investment apps with strong brand identity outperform lenders relying heavily on copy.
Do UGC ads outperform studio creative for fintech?
Yes. UGC formats outperform polished studio creative by 1.6-2.4x on CPA across fintech Meta accounts over 18 months. N26 achieved a 65% drop in acquisition cost through creative diversification including lo-fi UGC. The gap is widest on consumer fintech products where trust is the primary conversion blocker.
What is the average CPA for fintech ads?
Fintech CPA varies by sub-vertical: neobanks run $35-$90 per account open, lending and wealth management face $80-$400+ per lead. The overall fintech CAC for a funded customer crossed $1,450 in Q1 2026.
What percentage of fintech ads are video?
Video represents 48.6% of all fintech creatives on Meta platforms. Video ads are 14x more likely to drive an app install than banner ads. Financial services increased video creation by 189% YoY. "Bold Statement" is the most used opening hook, with Graphic Design as the predominant production style.
Sources
https://benly.ai/benchmarks/finance-fintech
https://adlibrary.com/posts/meta-ad-benchmarks-fintech-2026
https://adfuseai.com/cpa-benchmarks/fintech
https://viewst.com/best-display-ads-fintech/
https://www.brighterclick.com/blog-post/fintech-marketing-trends
https://cufinder.io/blog/benchmarks/fintech/
https://www.creativemilkshake.com/case-studies/n26-meta-ads-creative-diversification
https://datarevolt.agency/revolt-case-study/boosting-neobank-adoption-how-salt-bank-scaled-account-creations-with-video-action-campaigns/
https://vidico.com/news/fintech-ads-best-practices-for-visual-creative-that-actually-converts-2026/


