



Table of contents

Key Takeaways
- Webflow powers approximately 500,000+ active websites globally in 2026, holding a 1.2% CMS market share and growing at 66% annual revenue growth.
- Webflow generated $213 million in annual revenue in 2024, up from $128 million in 2023, with enterprise revenue growing 8× from $1M to $8M in 2021 alone.
- 3.0% of UK wealth management firms (54 of 1,799) use Webflow as their CMS, reflecting growing adoption in financial services.
- Business and Finance is the most popular category among Webflow websites, with financial services firms choosing Webflow for its design flexibility and compliance-ready output.
- Average financial advisor website converts at 0.5–1.5%, while optimized sites reach 3–8%, making platform selection critical for lead generation.
- 60%+ of financial advisor website traffic arrives on mobile, but desktop converts 2× better (4.8% vs. 2.1%), demanding responsive design platforms.
- Financial advisor website form submissions jumped 110% in 2025, driven by AI-influenced investor research behavior changes.
The website platform a financial advisory firm chooses directly impacts its ability to generate leads, build trust, and maintain regulatory compliance. Webflow has emerged as a leading choice for forward-thinking advisory firms — its visual development environment, clean code output, and CMS flexibility address the specific needs of financial services websites without the plugin overhead and security vulnerabilities of WordPress. With 500,000+ active websites and $213 million in revenue, Webflow's market position is now established rather than experimental (Popupsmart, GetLatka). This article compiles the most current Webflow adoption data, financial advisor website benchmarks, and performance statistics that matter for advisory firms evaluating or optimizing their web presence in 2026.
Webflow Market Position and Growth Statistics (2026)
Webflow has transitioned from a designer-focused niche tool to an enterprise-ready website platform. Revenue, adoption, and market share data from Popupsmart and GetLatka shows consistent upward momentum.
| Metric | Value | Source Year | Context |
|---|---|---|---|
| Active Websites | 500,000+ | 2026 | Up from 320K in early 2024 |
| CMS Market Share | 1.2% | 2026 | Top 20 globally; 6.08% of page builders |
| Annual Revenue | $213M (2024) | 2024 | +66% YoY from $128M in 2023 |
| Estimated Revenue | $260M (2025) | 2025 | Continued enterprise expansion |
| Community Growth | 23% CAGR | 2026 | Ensures talent pool availability |
| Enterprise Revenue | 8× growth ($1M→$8M) | 2021 | Enterprise tier now core growth driver |
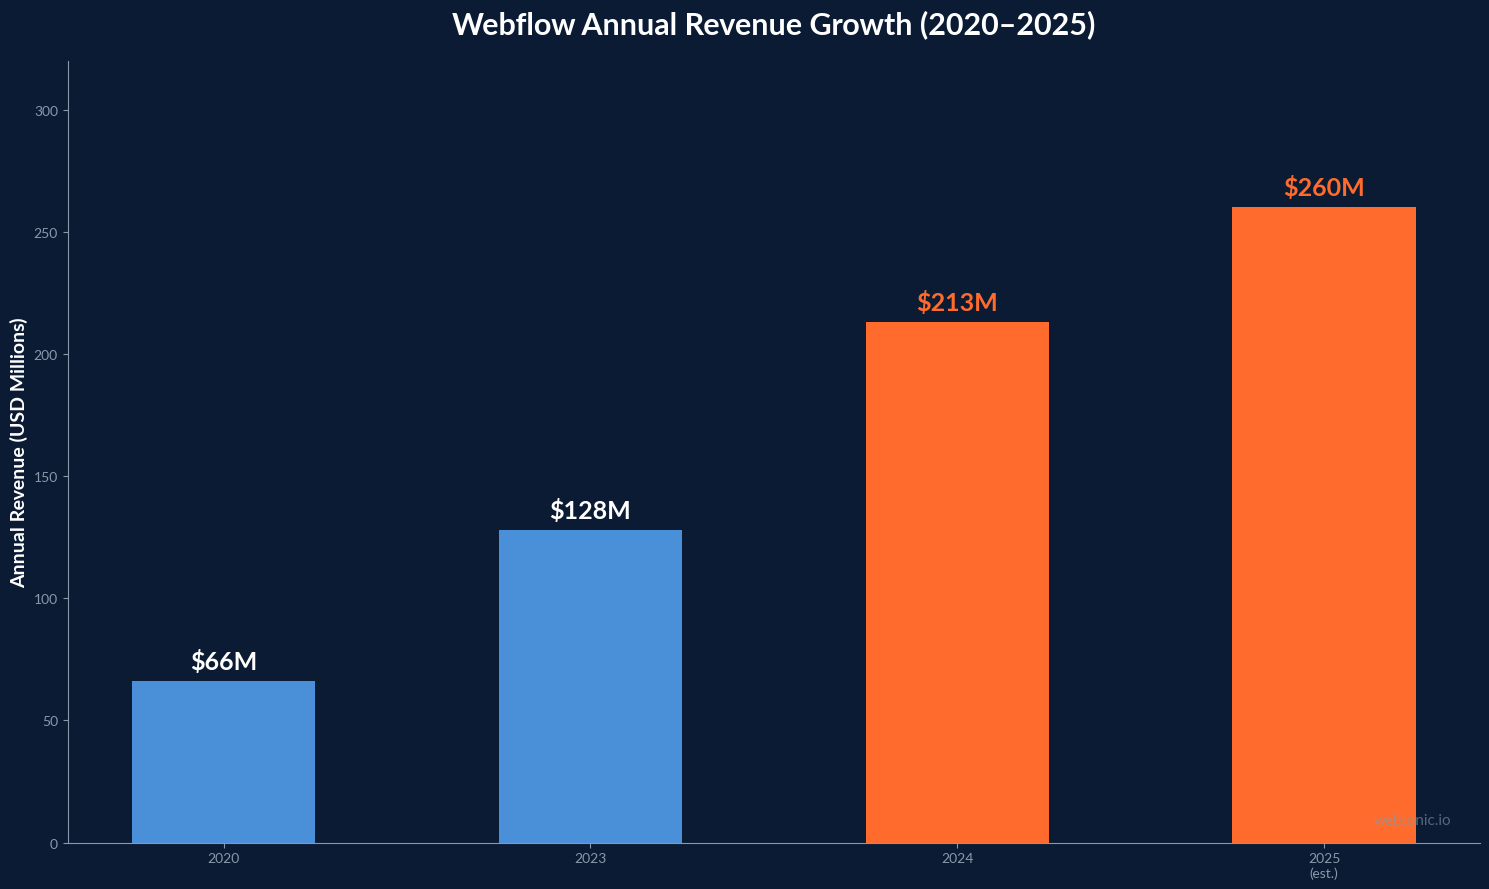
The 66% revenue jump from $128M to $213M in a single year reflects not just more websites being built, but higher-value enterprise contracts. For financial advisory firms, this means Webflow now offers the infrastructure, uptime guarantees, and security posture that regulated industries require — a significant shift from its earlier reputation as a freelancer's tool.
Webflow Adoption in Financial Services
Financial services is among the most popular verticals for Webflow adoption. Data from Alpha Quantum and Firmbase highlights how advisory firms are choosing Webflow over legacy CMS platforms.
- Business and Finance is the #1 category among Webflow websites, indicating the platform's design and content flexibility resonates with financial brands that need to project credibility and professionalism.
- 3.0% of UK wealth management firms (54 of 1,799) use Webflow — a meaningful share for a platform with just 1.2% global CMS market share, suggesting over-indexing in financial services.
- Major wealth management firms like Keller Wealth Management, Lewellyn Wealth, and Lucia Capital ($2B+ AUM) have built their web presence on Webflow, validating the platform for high-stakes advisory brands.
- Webflow's clean code output and built-in SSL address two key financial services requirements: SEO performance and data security compliance without additional plugin management.
- Financial advisors leveraging growth marketing services alongside Webflow see stronger alignment between website design and performance creative campaigns.
Financial Advisor Website Performance Benchmarks
Website performance directly impacts lead generation for financial advisory firms. Benchmarks from OJay Media, CUFinder, and Borah Labs provide the context for evaluating platform effectiveness.
| Metric | Industry Average | Optimized Sites | Impact |
|---|---|---|---|
| Conversion Rate | 0.5–1.5% | 3–8% | 5–16× more leads from same traffic |
| Mobile Traffic Share | 58–60%+ | 60–70% | Mobile-first design is non-negotiable |
| Desktop CVR | 4.8% | 6–10% | 2× higher than mobile (2.1%) |
| Mobile CVR | 2.1% | 3–5% | Critical gap to close |
| Form Submissions (YoY) | +110% | +150–200% | AI-driven research changing behavior |
| Bounce Rate | 45–55% | 30–40% | Trust architecture reduces exits |
The gap between average advisor site conversion (0.5–1.5%) and optimized sites (3–8%) represents the single largest performance lever for most advisory firms. The 110% increase in website form submissions in 2025 — driven by AI-influenced investor research behavior — makes website optimization more urgent than ever (FinancialContent).

Financial Services Website Speed and Core Web Vitals
Page speed is both a ranking factor and a conversion factor for financial advisor websites. Industry-wide performance data from Borah Labs reveals significant room for improvement, which is where Webflow's clean code output provides an advantage.
- Average financial services LCP (Largest Contentful Paint): 10.7 seconds — more than 4× Google's 2.5-second passing threshold, indicating widespread performance issues across the industry.
- Average performance score for financial services sites: 59/100 in Google PageSpeed Insights, with SEO scores averaging 84/100.
- SSL adoption in financial services: 82.4% — still lagging behind e-commerce (95%+) despite handling sensitive client data.
- WordPress powers 8% of financial advisory websites surveyed, but plugin bloat contributes to the poor speed scores. Webflow sites typically score 85–95 on PageSpeed out of the box due to clean code generation and built-in CDN hosting.
- HTTP/3 adoption in financial services: only 8.2%, compared to 30%+ in e-commerce and SaaS — an easy infrastructure win that Webflow handles automatically.
- Integrating data intelligence for conversion tracking on fast-loading Webflow sites ensures accurate attribution without the tag-manager bloat that degrades page speed.
These speed metrics matter because every additional second of load time reduces conversion rates by 4.4% on average. For a financial advisory site generating 5,000 monthly visitors at a 1.5% conversion rate, improving from the industry-average 10.7-second LCP to a 2.5-second LCP (achievable with Webflow) could increase monthly leads from 75 to 90–100. Webflow's AWS-backed CDN, automatic image optimization, and minified code output deliver these speed improvements without manual performance tuning.
Webflow vs WordPress for Financial Advisory Websites
The Webflow vs. WordPress decision is the most common platform evaluation for financial advisory firms. Each platform has distinct advantages depending on the firm's technical resources, compliance needs, and growth objectives.
| Factor | Webflow | WordPress | Winner for Advisors |
|---|---|---|---|
| Page Speed (avg) | 85–95 PageSpeed | 40–65 PageSpeed | Webflow |
| Security | Built-in SSL, managed hosting | Requires plugins + maintenance | Webflow |
| Design Flexibility | Full visual control | Theme-dependent | Webflow |
| CMS Capabilities | Structured collections | Unlimited via plugins | WordPress |
| Developer Ecosystem | Growing (23% CAGR) | Massive, established | WordPress |
| Compliance Readiness | Clean output, audit-friendly | Plugin conflicts risk | Webflow |
| Total Cost of Ownership | $29–$49/mo (hosting incl.) | $20–$100/mo + plugins + security | Comparable |
Webflow Revenue Growth and Platform Trajectory
Webflow's growth trajectory provides important context for financial advisory firms evaluating long-term platform viability. A platform's financial health determines its future feature development, security investments, and community support — all critical factors for firms that need their website infrastructure to remain stable and improving over time.
| Year | Revenue | YoY Growth | Key Milestone |
|---|---|---|---|
| 2020 | $66M | — | First disclosed revenue figure |
| 2023 | $128M | +94% (vs 2020) | Enterprise tier launch |
| 2024 | $213M | +66% | AI-assisted design features |
| 2025 (est.) | $260M | +22% | Enterprise revenue acceleration |
The $66M → $260M growth trajectory over five years represents nearly 4× revenue expansion. More importantly for financial advisory firms, the shift toward enterprise customers means Webflow is investing heavily in the exact capabilities these firms need: uptime SLAs, advanced security controls, role-based access, and compliance-ready hosting infrastructure. The 23% CAGR in community growth also ensures that finding qualified Webflow developers and designers will become easier, not harder, over time.
Best Practices for Financial Advisory Webflow Sites
Financial advisory firms achieving top-quartile website performance on Webflow follow specific patterns validated by conversion data from OJay Media and platform adoption trends.
- Design mobile-first — with 60%+ of traffic arriving on mobile devices, the mobile experience must be the primary design consideration. Desktop adaptation follows, not the reverse.
- Build a single, clear conversion path per page — most advisor sites fail because they present too many options. Each page should have one primary CTA (schedule a call, download a guide, request a plan).
- Implement trust architecture above the fold — credentials (CFP, CFA, RIA), AUM figures, client count, and regulatory disclosures must be visible without scrolling. Firms doing this report 2–3× higher conversion rates.
- Use Webflow's CMS collections for blog content and resources — financial advisors publishing 2–4 articles per month see 44.1% of traffic from organic search, making content a lead generation engine.
- Add FinancialService schema markup for enhanced search visibility — Webflow's custom code injection makes schema implementation straightforward without developer dependencies.
- Track form submissions with server-side events using data intelligence tools — client-side tracking alone misses 15–25% of conversions due to ad blockers and cookie restrictions.
- Pair Webflow sites with Meta Ads landing page variants — Webflow's visual editor enables rapid A/B testing of landing pages without developer bottlenecks, supporting 2–4 week testing cycles versus 6–8 weeks on WordPress.
Frequently Asked Questions
Is Webflow good for financial advisor websites?
Webflow is an excellent choice for financial advisor websites. Its clean code output delivers 85–95 PageSpeed scores compared to WordPress averages of 40–65. The visual editor allows design changes without developer dependencies, built-in SSL provides baseline security, and structured CMS collections support content marketing programs. Business and Finance is the #1 category among Webflow websites, validating its fit for the sector.
How much does a Webflow financial advisor website cost?
Webflow hosting costs range from $29–$49/month for a CMS-enabled business site, with no additional security plugin or managed hosting fees. Professional design and development typically costs $5,000–$25,000 depending on complexity. Total first-year investment is $5,350–$25,600, often comparable to or less than WordPress with premium theme, plugins, managed hosting, and security monitoring.
What conversion rate should financial advisors expect from their website?
The average financial advisor website converts at 0.5–1.5%. Optimized sites consistently reach 3–8% by implementing single conversion paths, above-fold trust architecture, and mobile-first design. Desktop visitors convert at 4.8% versus 2.1% for mobile, making responsive design critical for bridging this gap.
How does Webflow compare to WordPress for financial services?
Webflow outperforms WordPress in page speed (85–95 vs. 40–65 PageSpeed), security (built-in SSL and managed infrastructure), and design flexibility. WordPress maintains advantages in CMS extensibility via plugins and developer ecosystem size. For financial advisory firms prioritizing performance, compliance readiness, and low maintenance, Webflow is typically the stronger choice.
For firms considering a migration from WordPress to Webflow, working with a specialized growth marketing agency ensures that SEO equity is preserved through proper 301 redirect mapping, URL structure planning, and technical SEO implementation during the transition. The typical migration timeline is 4–8 weeks for a standard advisory site.
Why are financial advisor website form submissions increasing?
Financial advisor website form submissions jumped 110% in 2025, with Q4 conversion rates rising 106%. This surge is attributed to AI-driven changes in investor research behavior — prospects are conducting more thorough online research before contacting advisors, and those who do submit forms are higher-intent. Website visitors increased 10.3% between 2024 and 2025, but form submissions grew at 10× that rate.
Sources
popupsmart.com
getlatka.com
alpha-quantum.com
firmbase.co
ojaymediamarketing.com
cufinder.io
borahlabs.us
financialcontent.com


