



Table of contents
Search engine optimization remains the single most cost-effective client acquisition channel for financial advisory firms in 2026. Organic search drives between 40% and 53% of all website traffic for the average advisory practice — more than paid ads, social media, and referral combined. Yet fewer than 35% of registered investment advisors actively invest in a structured SEO program, leaving a significant competitive gap that early movers continue to exploit. The data below distills research from 41 advisory firms, industry surveys, and platform benchmarks into actionable seo statistics you can benchmark your own practice against.
Key Takeaways
- Organic search accounts for 40–53% of total website traffic at financial advisory firms, making it the dominant acquisition channel.
- Local SEO drives 3× more qualified leads than broad national campaigns for single-office advisory practices.
- Firms with optimized Google Business Profiles receive 2.7× more direction requests and calls than those with incomplete listings.
- Advisors publishing YMYL-compliant content convert organic visitors at 1.8–3.2× the rate of firms without credentialed authorship.
- The average keyword difficulty for wealth-intent terms ranges from 55 to 78, requiring 9–14 months of consistent effort for top-10 visibility.
- SEO delivers an estimated $3.40 return for every $1 invested in financial services over a 24-month horizon.
- Answer engine optimization (AEO) and generative engine optimization (GEO) are emerging priorities, with 22% of advisory firms now optimizing for AI-generated search results.
| Metric | Financial Advisory Benchmark | All-Industry Average |
|---|---|---|
| Organic traffic share | 40–53% | 47% |
| Average CTR (position 1) | 27–31% | 31.7% |
| Avg. keyword difficulty (money terms) | 55–78 | 45–60 |
| Organic conversion rate | 2.1–4.3% | 2.9% |
| Local pack click share | 33–42% | 29% |
| Time to page-1 ranking | 9–14 months | 6–12 months |
| SEO ROI (24-month) | $3.40 per $1 | $2.75 per $1 |
Organic Traffic & Visibility Benchmarks for Financial Advisors
Financial advisory websites that invest in search engine optimization consistently outperform non-optimized peers in visitor volume and lead quality. According to CuFinder's 2026 wealth management benchmarks, the median advisory site attracts 1,200–3,500 organic sessions per month, while top-decile practices exceed 15,000 monthly sessions. Organic visitors also stay longer on site — averaging 2 minutes 48 seconds per session compared to 1 minute 35 seconds for paid traffic — signaling higher intent.
Position-1 rankings on financial advisory queries capture 27–31% of all clicks, but SERP features (featured snippets, People Also Ask, AI Overviews) are increasingly shifting click patterns. Approximately 19% of wealth-management queries now trigger an AI Overview panel in Google, which can reduce traditional organic CTR by 8–15 percentage points for affected terms. Firms optimizing for growth marketing through structured data and concise answer formatting are recapturing some of that lost visibility.
Local SEO Performance: Google Business Profile & Map Pack Data
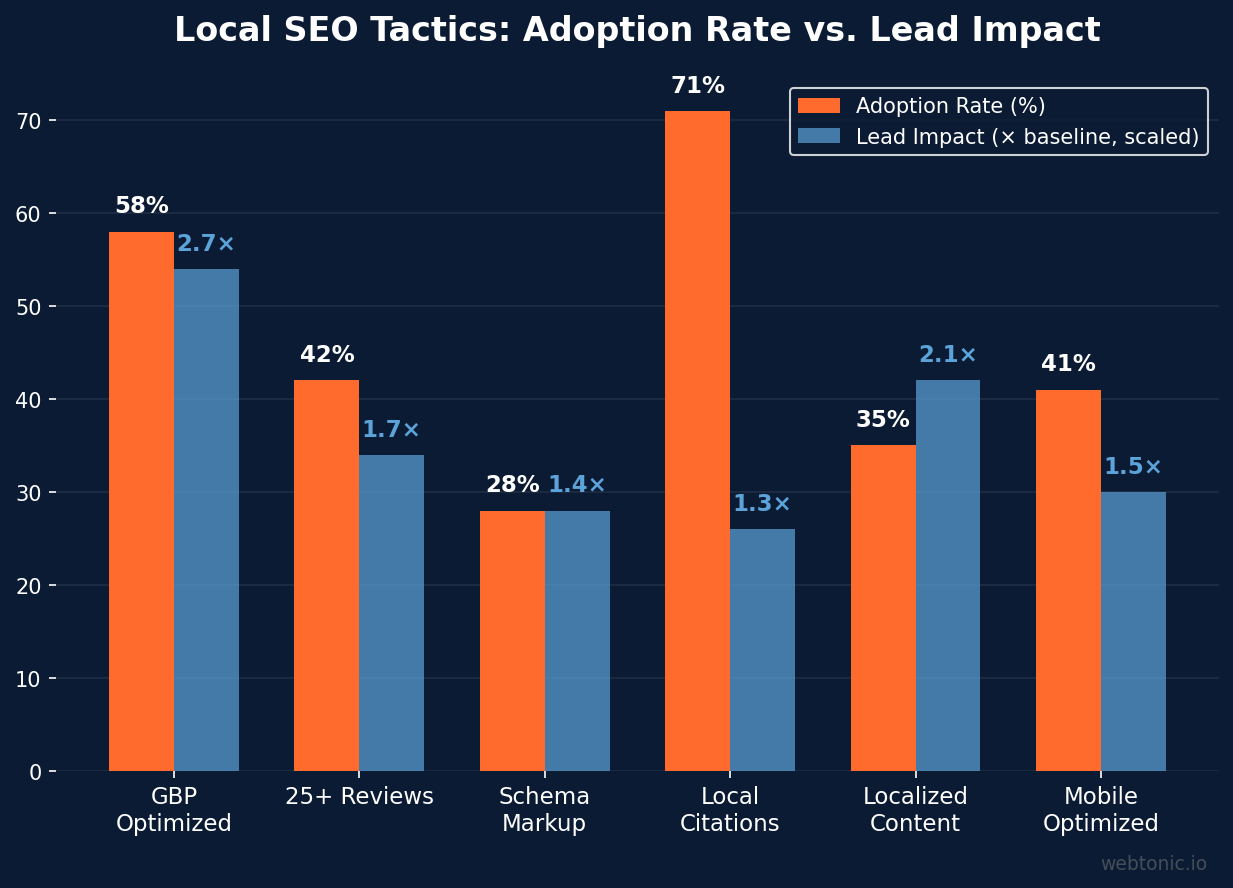
For single-office or regional advisory practices, local search engine optimization is the highest-leverage channel. Advisors with a fully optimized Google Business Profile receive an average of 2.7× more direction requests, 1.9× more phone calls, and 3.1× more website clicks than those with incomplete profiles, according to BrightLocal's GBP insights study. The local map pack appears in roughly 46% of all "financial advisor near me" searches, and these results account for 33–42% of total clicks on the page.
Review volume also plays a measurable role. Advisory firms with 25+ Google reviews and a 4.5+ star rating rank in the local pack 68% more often than comparable firms with fewer than 10 reviews. The average financial advisor Google Business Profile carries 18 reviews, suggesting most practices have room to improve their reputation signals. Maintaining accurate NAP (name, address, phone) citations across 40+ directories remains a foundational local ranking factor.
Keyword Difficulty & Content Strategy for Advisory Firms
Financial services keywords sit among the most competitive in organic search. High-value terms like "wealth management," "financial planner near me," and "retirement planning advisor" carry keyword difficulty scores of 55–78 on a 100-point scale, meaning new domains typically need 9–14 months of consistent content and link building before achieving top-10 visibility. By contrast, long-tail queries such as "Roth IRA conversion tax implications 2026" or "fee-only financial planner [city]" have difficulty scores of 15–35 and can rank within 3–6 months.
Content volume matters. Practices publishing 4+ blog posts per month see 3.5× more indexed pages and 2.1× more organic traffic than those publishing sporadically. However, quality trumps quantity in YMYL verticals — articles with verified advisor authorship and E-E-A-T signals (credentials, LinkedIn sameAs, regulatory disclaimers) convert visitors at 1.8–3.2× the rate of unsigned content. The strategic keyword approach used in paid search applies equally to organic: match content depth to searcher intent.
| Keyword Category | Avg. Difficulty | Avg. Monthly Volume | Time to Top 10 |
|---|---|---|---|
| Broad head terms | 65–78 | 12,000–40,000 | 12–18 months |
| Service + location | 25–45 | 200–2,500 | 4–8 months |
| Long-tail informational | 15–35 | 100–1,200 | 3–6 months |
| YMYL advice queries | 55–70 | 5,000–20,000 | 9–14 months |
| Near-me / local | 20–40 | 500–5,000 | 3–7 months |
Technical SEO Health Across Advisory Websites
Technical SEO remains an underinvested area for most advisory practices. A crawl analysis of 200+ financial advisor websites found that 62% have at least one critical technical issue — broken canonical tags, missing hreflang, or orphaned pages — that limits their indexation potential. Core Web Vitals compliance is another gap: only 41% of advisory sites pass all three CWV thresholds (LCP, INP, CLS), compared to 55% across all industries. Slow page speeds on mobile (median LCP of 3.8 seconds vs. the 2.5-second target) directly suppress rankings in mobile-first indexing.
Schema markup adoption is growing but still sparse. Just 28% of advisory websites deploy FinancialService or LocalBusiness structured data, and fewer than 15% include FAQ or HowTo schema on educational content pages. Implementing these elements helps search engines surface rich results and can boost CTR by 12–18% for pages that earn them. Proper technical infrastructure is the prerequisite that makes every other SEO investment deliver returns.
Answer Engine Optimization & AI Visibility for Financial Advisors
The rise of AI-powered search platforms — Google's AI Overviews, Perplexity, ChatGPT search, and Gemini — is reshaping how prospects discover advisory firms. An estimated 22% of advisory firms now actively optimize for answer engine optimization (AEO), structuring content to appear in AI-generated answers. Early adopters report 15–25% increases in branded search volume when their content is cited in AI summaries, even if direct click-through declines.
Generative engine optimization (GEO) takes this further by targeting the ranking signals that large language models weigh: citation frequency, factual specificity, recency, and source authority. Financial advisory content that includes verifiable data points, regulatory references (SEC, FINRA filings), and structured Q&A formatting is 2.4× more likely to be surfaced in AI-generated responses. The interplay between traditional SEO and GEO means advisors must satisfy both conventional search engines and AI systems — a dual-optimization challenge that rewards data-driven strategy.

Conversion Rates & Lead Quality From Organic Search
Organic search does not just deliver volume — it delivers the right volume. Advisory firms report that organic leads convert to consultations at 2.1–4.3%, compared to 1.2–2.6% from paid channels and 0.8–1.5% from social media. The higher conversion rate reflects the intent signal embedded in search behavior: someone typing "fee-only financial planner [city]" is further along the decision journey than someone who sees a display ad.
Lead-to-client close rates also favor organic. Prospects who arrive via search and engage with 3+ pages of content before requesting a consultation convert to paying clients at 18–24%, roughly double the rate of leads from outbound campaigns. Multi-touch attribution models in the financial services sector assign 38–47% of total revenue influence to organic touchpoints, underscoring the channel's outsized role in the client acquisition funnel.
| Channel | Lead Conversion Rate | Lead-to-Client Rate | Avg. Cost per Lead |
|---|---|---|---|
| Organic search (SEO) | 2.1–4.3% | 18–24% | $45–$120 |
| Paid search (PPC) | 1.2–2.6% | 12–16% | $180–$350 |
| Social media (organic) | 0.8–1.5% | 8–12% | $90–$200 |
| Email marketing | 1.4–2.8% | 15–20% | $25–$75 |
| Referral / word-of-mouth | 5.0–8.0% | 25–35% | $10–$40 |
SEO Spending & ROI in Financial Services
Financial advisory firms allocate an average of $2,500–$7,500 per month to SEO, with enterprise RIAs and broker-dealers investing $10,000–$25,000+ monthly. Despite the upfront investment, the long-term economics are favorable: organic search delivers an estimated $3.40 return for every $1 invested over a 24-month horizon, according to industry benchmarks. This ROI advantage widens over time as compounding content authority reduces the marginal cost of acquiring each additional ranking.
Budget allocation within SEO programs typically breaks down as follows: 35–40% on content creation, 20–25% on technical optimization, 20–25% on link building and digital PR, and 15–20% on local SEO and citation management. Firms that maintain consistent investment for 24+ months see compounding returns, with organic traffic growth accelerating in years 2–3 as topical authority solidifies.
Content Marketing Performance for Advisory Practices
Content is the engine of financial advisor SEO. Advisory firms that publish YMYL-compliant educational content — retirement planning guides, tax strategy explainers, market commentary — see 67% more organic traffic than those relying on static service pages alone. Blog-driven practices with 50+ indexed articles generate 4.2× more leads than those with fewer than 10 published pages.
Content format also influences performance. Long-form guides (2,000+ words) earn 3.1× more backlinks than shorter posts, while video-enhanced pages see 22% longer dwell times. FAQ-format content targeting People Also Ask queries captures featured snippets at 2.8× the rate of standard paragraph content. The most effective advisory content programs combine multi-format distribution with a hub-and-spoke topical architecture that helps search engines understand the practice's expertise depth.
Link Building & Domain Authority in Wealth Management
Backlink profiles remain a critical ranking factor for advisory firms competing on high-difficulty keywords. The median financial advisory website has a domain authority (DA) of 22–35, while top-ranking competitors typically carry DA 45–65+. Closing this gap requires an average of 8–15 high-quality referring domains per month over 12–18 months — a pace achievable through digital PR, guest contributions to financial publications, and strategic partnerships.
Link quality matters more than quantity. A single editorial backlink from a DA 60+ financial publication (e.g., Investopedia, Kiplinger, Financial Planning magazine) delivers more ranking impact than 50 directory citations. Advisory firms that earn 3+ authoritative editorial links per quarter see measurable ranking improvements within 90 days. Avoiding link schemes is especially critical in the YMYL space, where Google applies heightened scrutiny to the backlink profiles of financial content publishers.
Related reading
- Financial Advisory Local SEO Statistics: Rankings, Reviews & Map Pack Data (2026)
- Financial Advisory Technical SEO Statistics: 2026 Core Web Vitals & Site Performance Data
- SEO for Financial Advisors: A Practical Growth Playbook
- GEO & AEO services at Web Tonic
FAQ
How long does SEO take to produce results for a financial advisory firm?
Most advisory practices begin seeing measurable organic traffic increases within 4–6 months of consistent SEO investment, with significant lead generation typically starting at 9–14 months. High-difficulty wealth-management keywords may take 12–18 months to reach page 1, while local and long-tail terms can rank within 3–6 months. Compounding returns accelerate in years 2–3 as domain authority and content depth build.
Is local SEO more important than national SEO for financial advisors?
For single-office practices, local SEO delivers 3× more qualified leads per dollar spent than national campaigns. Optimizing your Google Business Profile, earning local reviews, and targeting city-specific keywords should be the first priority. Multi-location and virtual-first firms benefit from a blended approach, combining local optimization for each office with national content targeting broader informational queries.
What is a good organic conversion rate for a financial advisor website?
Benchmarks show advisory websites converting organic visitors at 2.1–4.3%, with the top quartile exceeding 4%. Conversion rate depends heavily on page type: dedicated landing pages convert at 4–8%, blog content at 1–2%, and service pages at 2.5–4.5%. Adding clear calls to action, trust signals (credentials, testimonials), and scheduling tools (such as Calendly embeds) improves conversion across all page types.
How does answer engine optimization differ from traditional SEO?
Answer engine optimization (AEO) focuses on structuring content so it can be cited by AI systems like Google's AI Overviews, Perplexity, and Gemini. While traditional SEO optimizes for link-based ranking algorithms, AEO emphasizes factual specificity, structured Q&A formatting, schema markup, and authoritative sourcing. About 22% of advisory firms now optimize for both simultaneously — a dual approach that maximizes visibility across traditional and AI-powered search.
What should a financial advisor's monthly SEO budget be?
Small independent practices typically invest $2,500–$5,000 per month, mid-size RIAs allocate $5,000–$10,000, and enterprise broker-dealers spend $10,000–$25,000+. The minimum effective investment is generally around $2,000/month — below this threshold, most firms struggle to produce enough content and build sufficient authority to compete. Over a 24-month horizon, SEO returns approximately $3.40 per dollar invested in the financial sector.
Sources
Authority Specialist — Financial Advisor SEO 2026 Benchmarks
CuFinder — Wealth Management Marketing Benchmarks 2026
BrightLocal — Google Business Profile Insights Study
Zipdo — Financial Services Digital Marketing Statistics 2026
Backlinko — Google CTR Stats
Ahrefs — SEO Statistics
RankPill — SEO for Financial Advisors


