



Table of contents
LinkedIn delivers the highest lead-to-opportunity conversion rates of any paid social channel for financial advisors, with financial-services advertisers paying $7.80–$15.20 per click and generating qualified leads at $100–$200 per lead. Below is a data-backed breakdown of every metric that matters for RIAs and wealth managers running LinkedIn campaigns in 2026. See how our growth marketing services help advisory firms scale their paid social programs.
Key Takeaways
- Financial-services LinkedIn CPC ranges from $7.80 to $15.20, making it 3–5× more expensive than Meta but delivering higher-intent prospects.
- Cost per qualified lead via Lead Gen Forms sits at $100–$200, while Sponsored Content CPL runs $150–$300 for advisory firms.
- LinkedIn ROAS for B2B financial services reached 121 % in 2025, up from 113 % the prior year — the only major paid social channel above breakeven.
- Lead Gen Form conversion rates average 10 % for financial services, compared to 3 % for landing-page-driven campaigns.
- LinkedIn now captures 41 % of total B2B paid-social ad spend, the single largest individual channel in the Dreamdata dataset.
- Conversation Ads convert at 4–10 % on lead-generation offers, 5–10× higher than equivalent Sponsored Content campaigns.
- RIA-specific LinkedIn MQL cost runs $200–$500, with 5–10 % of warm-flow MQLs converting to funded accounts.
LinkedIn Ads Benchmarks for Financial Advisors at a Glance
| Metric | Financial Services Benchmark | All-Industry Avg. |
|---|---|---|
| Cost per Click (CPC) | $7.80–$15.20 | $5.00–$8.50 |
| Cost per Lead (LGF) | $100–$200 | $68–$140 |
| Click-Through Rate (CTR) | 0.35–0.74 % | 0.40–0.65 % |
| Lead Gen Form CVR | 10 % | 12–14 % |
| Landing-Page CVR | 3 % | 4–5 % |
| ROAS (2025) | 121 % | ~100 % |
| InMail Open Rate | 50–60 % | 50–55 % |
| Conversation Ads CVR | 4–10 % | 4–8 % |
LinkedIn CPC and CPL for Financial Advisors: What the Data Shows
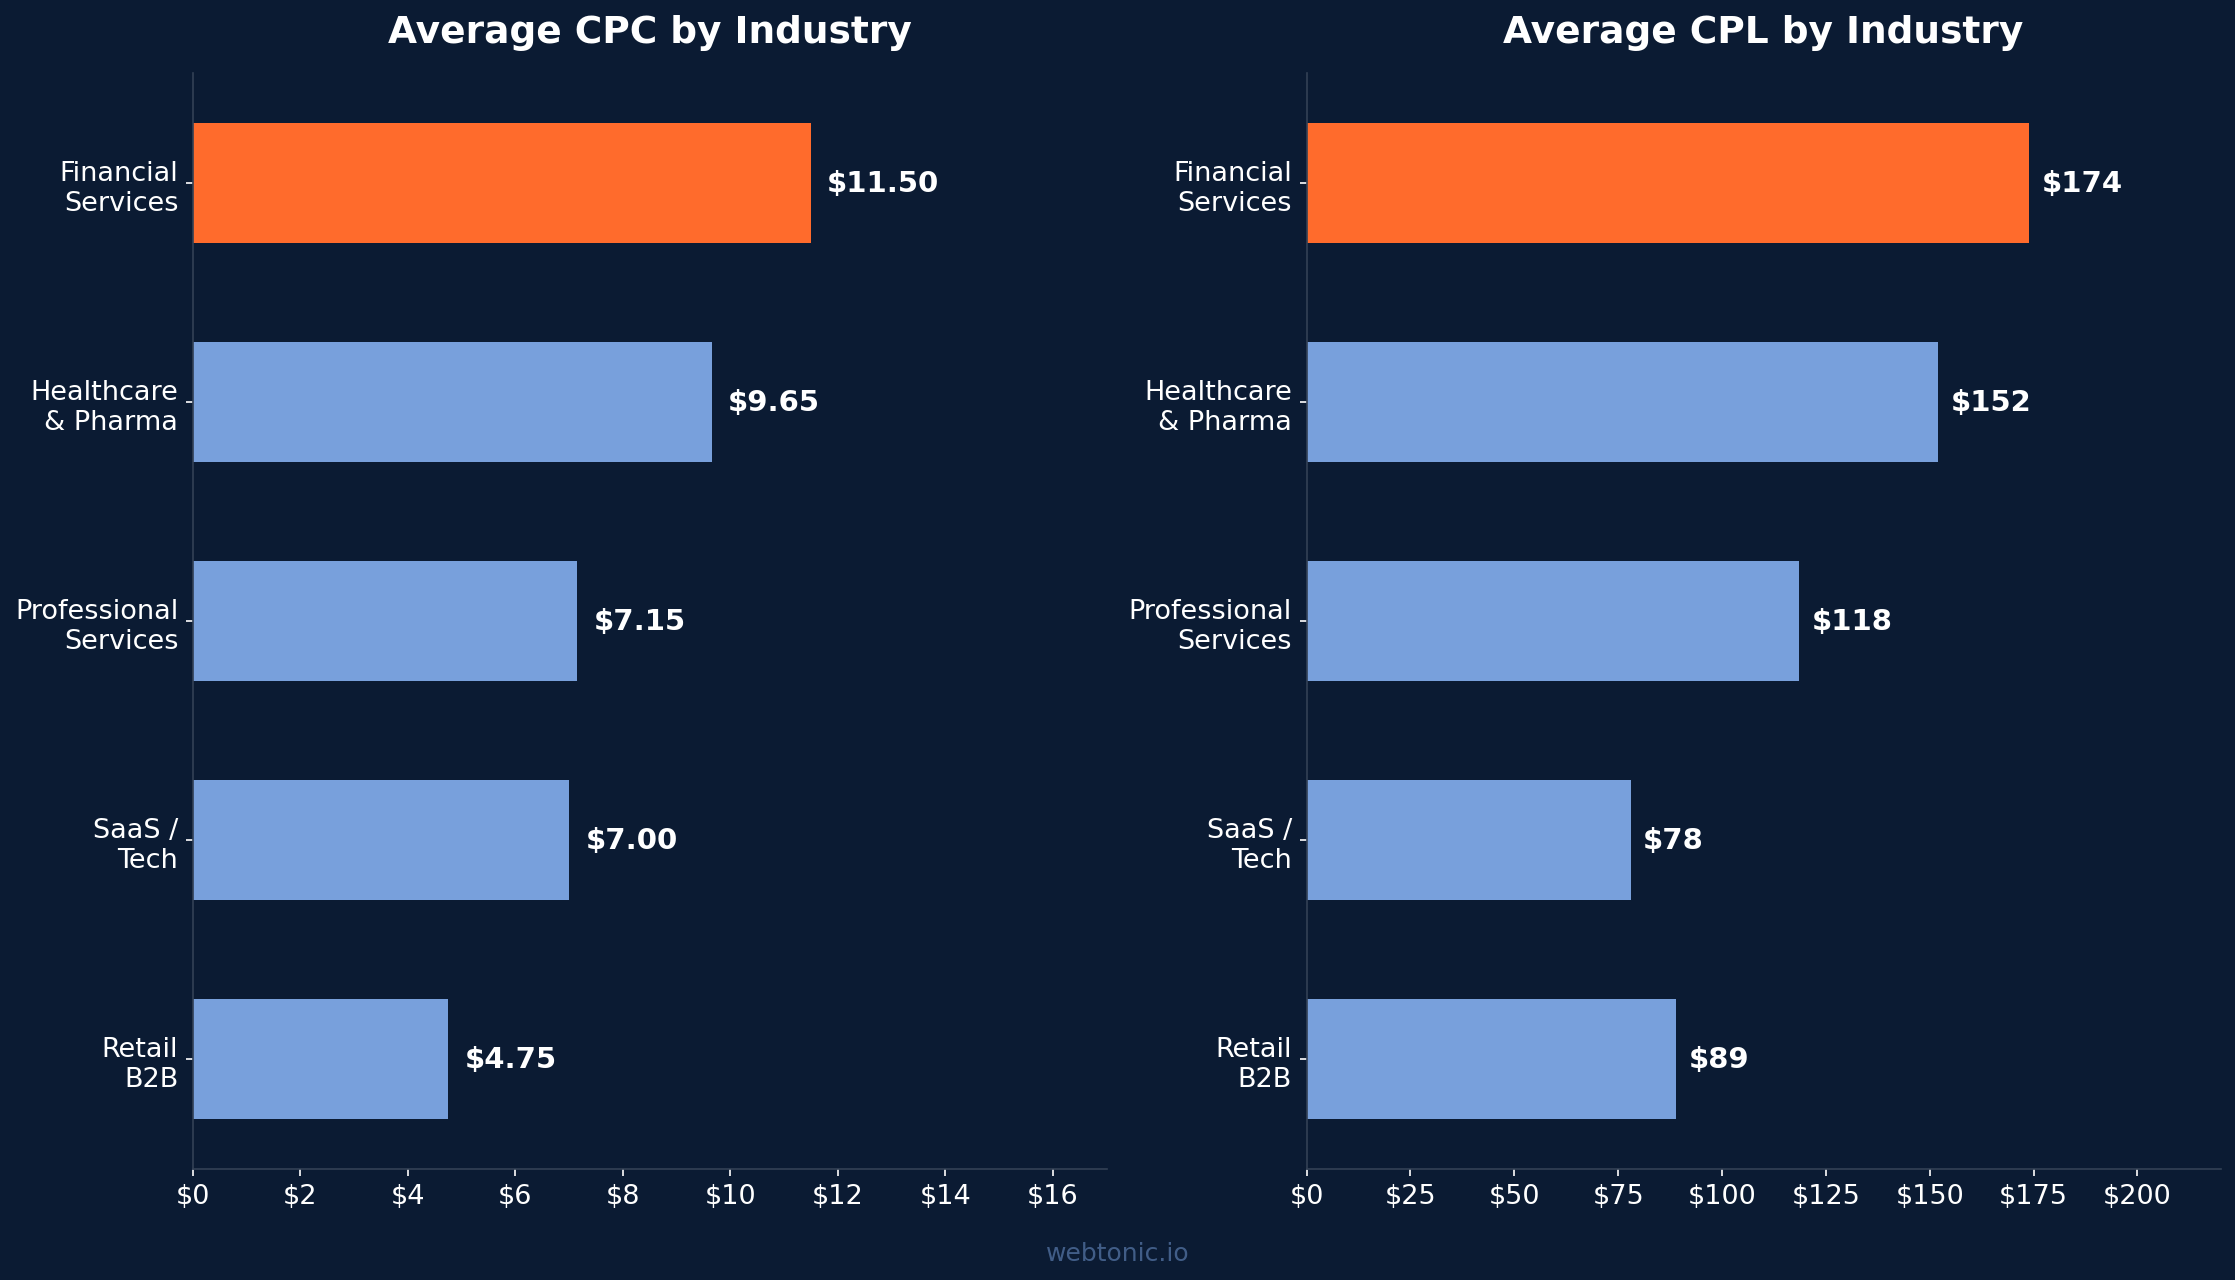
Financial-services advertisers face some of the steepest click costs on LinkedIn. According to Get Ryze AI's 2026 benchmark report, financial-services CPC ranges from $7.80 to $15.20, while the cost per qualified lead through Lead Gen Forms is $148–$200. Foundry CRO's independent analysis places the range at $9.00–$15.00 CPC and $100–$150 CPL, with typical deal sizes of $50 K–$250 K for financial-services clients.
The premium is justified by lead quality. LinkedIn produces the highest lead-to-opportunity conversion rates for B2B finance, even though raw CPL can reach $250–$600+ for high-intent advisory campaigns. For RIAs targeting $1 M+ AUM households, Elevarus reports LinkedIn MQL costs of $200–$500, with 5–10 % of warm-flow MQLs converting to funded accounts.
LinkedIn CPC and CPL by Industry: How Financial Services Compares
| Industry | CPC Range | CPL Range | CTR Range |
|---|---|---|---|
| Financial Services | $7.80–$15.20 | $148–$200 | 0.35–0.52 % |
| Healthcare & Pharma | $6.90–$12.40 | $129–$175 | 0.38–0.58 % |
| Professional Services | $5.40–$8.90 | $97–$140 | 0.48–0.72 % |
| SaaS / Technology | $5.00–$9.00 | $58–$98 | 0.40–0.65 % |
| Retail B2B | $3.50–$6.00 | $68–$110 | 0.50–0.75 % |
LinkedIn ROAS for Financial Services: The Only Positive Channel
Return on ad spend is the metric that ultimately justifies LinkedIn's premium pricing. Dreamdata's 2026 Benchmarks Report reveals that LinkedIn ROAS grew to 121 % in 2025, up from 113 % in 2024 — making it the only major paid-social channel delivering positive returns for B2B firms. In contrast, Financial Marketer reports Google Search ROAS declined from 78 % to 67 %, while Meta improved to 51 % but remains sub-breakeven.
| Platform | ROAS 2024 | ROAS 2025 | Trend |
|---|---|---|---|
| 113 % | 121 % | ↑ Positive & growing | |
| Google Search | 78 % | 67 % | ↓ Declining |
| Meta (Facebook/IG) | 29 % | 51 % | ↑ Still sub-breakeven |
LinkedIn Ad Format Performance for Financial Advisors
Format selection dramatically affects campaign economics. StackMatix benchmarks Sponsored InMail open rates at 50–60 % with an effective CPC of $15–$25. Meanwhile, GrowthSpree finds Conversation Ads convert at 4–10 % on lead-generation offers, delivering 5–10× higher conversion rates than equivalent Sponsored Content campaigns.
OJay Media notes that InMail campaigns typically run $80–$150 CPL versus $150–$300 for Sponsored Content, making messaging formats particularly attractive for advisor firms with smaller budgets. Lead Gen Forms remain the highest-converting capture mechanism, with Foundry CRO reporting 10 % conversion rates for financial services — versus just 3 % for traditional landing-page flows.

How Financial Advisors Allocate LinkedIn Ad Budgets
OJay Media's 2026 playbook illustrates that the cost-per-qualified-lead story inverts the CPC narrative: a Facebook lead at $12 CPL might convert to an appointment at only 3–8 %, while a LinkedIn lead at $150 CPL converts at 15–25 % (see our Facebook Ads agency comparison for Meta benchmarks), producing a lower effective cost per booked meeting. For RIAs chasing $1 M+ AUM households, Elevarus recommends a 70/20/10 budget split at the $25 K monthly level (LinkedIn/Google/other) shifting to 45/35/20 at the $100 K level as search captures more demand.
Financial Marketer confirms that LinkedIn now accounts for 41 % of total B2B paid-social ad spend in the Dreamdata dataset, the single largest individual channel — up from 39 % the prior year. For advisory firms, the median influenced pipeline per dollar spent is $5.21, with top performers reaching $15.20 per dollar according to Benchmarketing.
Best Practices for Financial Advisory LinkedIn Ad Campaigns
- Use Lead Gen Forms over landing pages — the 10 % vs 3 % conversion gap is the single biggest efficiency lever.
- Layer Conversation Ads for high-intent audiences — 4–10 % CVR at lower CPL than Sponsored Content.
- Measure AUM-weighted CAC, not raw CPL — a $500 MQL that converts to a $2 M AUM client is a different calculation than a $12 Facebook lead that never books.
- Set LinkedIn budget at 40–55 % of total paid social for early-stage RIA growth, shifting to 30–40 % as search matures.
- Test InMail for mid-funnel nurture — 50–60 % open rates dramatically outperform email at 20–25 % for cold advisory audiences.
- Benchmark against $88.20 median financial-services CPL and optimize toward the 25th-percentile target of $49 per lead.
- Track pipeline influenced revenue, not vanity metrics — top LinkedIn advertisers generate $15.20 in pipeline per $1 spent.
LinkedIn Engagement Benchmarks for Wealth Management Firms
Paid performance sits on top of organic engagement fundamentals. CuFinder reports that LinkedIn engagement for wealth management sits at 1.6 %, outperforming all other social platforms in the vertical. Gitnux adds that LinkedIn lead-gen forms convert at 18 % for RIAs, and 61 % of RIA prospects sourced from webinars become clients.
For firms combining paid and organic strategies, Datavinity notes that financial services achieve the highest average CTR at 0.74 % across all LinkedIn industries, reinforcing the platform's suitability for advisory audience targeting. The professional context and decision-maker density create a unique environment where content marketing and paid ads compound each other's effectiveness. Learn more about our performance creative services.
LinkedIn Targeting Capabilities for Financial Advisory Firms
LinkedIn's targeting precision is what separates it from every other paid social platform for financial advisors. The platform offers over 200 targeting attributes including job title, company size, seniority level, and industry — all verified by users themselves rather than inferred by algorithms. For wealth managers targeting C-suite executives with $1 M+ investable assets, this self-reported data creates an audience quality impossible to replicate on Meta or Google Display.
OJay Media highlights that the most successful RIA campaigns use layered targeting combining job function (Finance, Business Development) with seniority (VP+) and company revenue ($10 M+). This approach narrows audience size to 50,000–200,000 members in most metro areas but produces lead-to-meeting rates 3–5× higher than broad demographic targeting. The trade-off is clear: smaller audiences drive higher CPCs but dramatically better downstream conversion economics.
Get Ryze AI notes that AI-powered bid optimization has reduced wasted spend by 15–25 % for financial-services advertisers who adopted LinkedIn's automated bidding in early 2026. Combined with Matched Audiences (CRM upload retargeting) and Lookalike Audiences, advisors can build full-funnel campaigns that nurture prospects from awareness through to booked discovery calls.
LinkedIn vs Other Channels for Financial Advisor Lead Generation
Comparing LinkedIn's performance against other channels reveals why the platform commands such a large share of advisory firm budgets. Financial Marketer compiled cross-channel data showing LinkedIn's cost per qualified meeting runs $300–$800 versus $400–$1,200 for Google Search and $600–$2,000 for paid lead services like SmartAsset.
| Channel | Avg. CPL | Lead-to-Meeting Rate | Cost per Meeting |
|---|---|---|---|
| LinkedIn Ads | $100–$200 | 15–25 % | $300–$800 |
| Google Search | $50–$150 | 8–15 % | $400–$1,200 |
| Meta (Facebook/IG) | $12–$60 | 3–8 % | $500–$1,500 |
| Paid Lead Services | $150–$1,200 | 3–8 % | $600–$2,000 |
| Seminars / Webinars | $500–$2,000 | 10–20 % | $1,000–$4,000 |
The data consistently shows that LinkedIn's higher CPL is offset by superior lead quality. When measured against cost per AUM acquired — the metric that actually matters for advisory firm economics — LinkedIn frequently outperforms channels with 5–10× lower CPLs. Elevarus calculates that LinkedIn's effective cost per $1 M AUM acquired is $2,000–$5,000 for well-optimized campaigns, competitive with the best Google Search performance.
Frequently Asked Questions
How much do LinkedIn ads cost for financial advisors?
Financial advisory firms typically pay $7.80–$15.20 per click and $100–$200 per qualified lead through Lead Gen Forms. Sponsored Content CPL runs higher at $150–$300, while InMail campaigns can deliver leads at $80–$150. Actual costs depend on audience targeting specificity and competition in your geographic market. Contact our team for a custom LinkedIn audit.
Are LinkedIn ads worth it for wealth managers?
Yes — LinkedIn is the only major paid-social channel with positive ROAS (121 %) for B2B financial services. While CPCs are 3–5× higher than Meta, lead quality is dramatically superior: LinkedIn MQLs convert to funded accounts at 5–10 % versus 1–3 % from lower-cost channels. The platform also captures 41 % of total B2B paid-social spend.
What is a good CTR for financial advisor LinkedIn ads?
Financial-services advertisers should target a CTR of 0.44–0.74 % for Sponsored Content. Anything above 0.60 % puts you in the top quartile. Conversation Ads and InMail formats deliver much higher engagement rates (3–10 %) but measure differently since they operate within the messaging interface.
Which LinkedIn ad format works best for financial advisors?
Lead Gen Forms paired with Sponsored Content deliver the highest volume at 10 % conversion rates. For smaller budgets, Conversation Ads convert at 4–10 % with lower CPL than Sponsored Content. InMail excels at mid-funnel nurture with 50–60 % open rates. Most successful firms use a mix of all three across the funnel.
How much should a financial advisor spend on LinkedIn ads monthly?
Entry-level LinkedIn campaigns for financial advisors typically require $3,000–$5,000 per month minimum to generate meaningful data. RIAs targeting $1 M+ AUM households should budget $10,000–$25,000 monthly, allocating 40–70 % of total paid social to LinkedIn depending on growth stage and Google Search maturity.
Sources
Get Ryze AI — LinkedIn Ads CPC & CPL Benchmarks by Industry (2026)
Foundry CRO — LinkedIn Ads Benchmarks 2026
Dreamdata — LinkedIn Ads 2026 Benchmarks Report
Financial Marketer — LinkedIn Ads for B2B Financial Services
OJay Media — LinkedIn Ads for Financial Advisors Playbook
Elevarus — RIA Lead Generation: LinkedIn vs Google
Datavinity — LinkedIn Ads Benchmarks 2026
CuFinder — Wealth Management Marketing Benchmarks 2026
Benchmarketing — LinkedIn Ads Benchmarks


