



Table of contents
Financial Advisory Landing Page Statistics: Conversion Data That Drives Results in 2026
The average financial advisor website converts at just 0.5–1.5%, while optimized landing pages reach 3–8% conversion rates — a 4–6x gap that translates directly into missed revenue. In a sector where each new client represents $250K–$750K in AUM, every percentage point of conversion improvement has outsized financial impact.
Key Takeaways
- Average financial advisory landing page conversion rate is 3.4–4.0%, with top performers reaching 11.5% (Benchmarketing, CuFinder).
- Reducing form fields from 7–8 to 3–4 increased completions by 42% with only a 6% drop in lead quality (Wolf Financial).
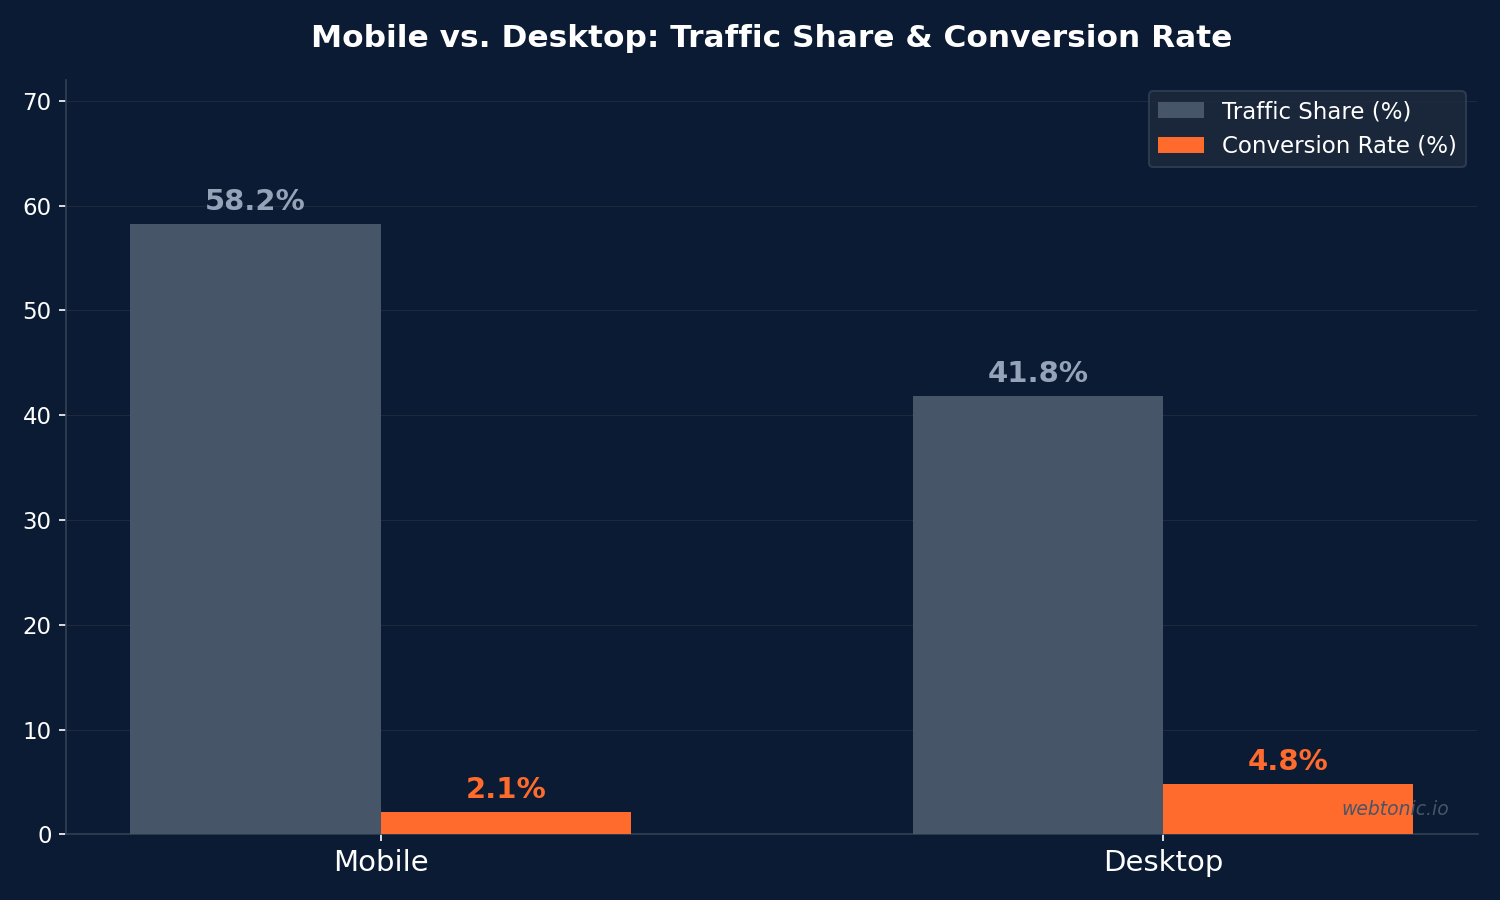
- Mobile traffic dominates at 58.2%, but desktop converts 2x better (4.8% vs. 2.1%) — making responsive design and device-specific CTAs critical (CuFinder).
- Shorter forms convert 40% better than those requesting full financial details upfront (CuFinder).
- Average advisor website converts 0.5–1.5% vs. optimized sites at 3–8% — most fail because of absent conversion paths, weak value propositions, and no trust architecture (OJay Media).
- Landing pages with video see up to 80% conversion lift, and VSL-driven funnels push consultation show rates to 60–80% (OJay Media).
- Financial services landing page conversion is reported at 8.4% by Apexure's broad-industry benchmark, higher than the advisory-specific 3.4–4.0% range, reflecting variance in how "conversion" is defined across studies.
Landing Page Conversion Benchmarks at a Glance
| Metric | Financial Advisory | Top Performers | All-Industry Avg. |
|---|---|---|---|
| Landing Page CVR | 3.4–4.0% | 11.5% | 5.9% |
| Website CVR (Non-Optimized) | 0.5–1.5% | 3–8% | 2.3% |
| Mobile CVR | 2.1% | 4.5% | 3.1% |
| Desktop CVR | 4.8% | 9.2% | 5.4% |
| Form Completion Rate (3–4 Fields) | 12–18% | 25%+ | 14% |
| Form Completion Rate (7–8 Fields) | 6–10% | 15% | 8% |
| CTA Click-Through Rate | 3–7% | 12%+ | 4.5% |
Sources: Benchmarketing, CuFinder, OJay Media, Apexure
Form Optimization: The Biggest Conversion Lever
Form design is the single most impactful conversion optimization for financial advisory landing pages. The data is unambiguous: shorter forms win. Wolf Financial documented a case study where a mid-size asset manager cut form fields from eight to four and saw a 42% increase in form completions with only a 6% drop in lead quality.
| Form Configuration | Completion Rate | Lead Quality Index | Net Impact |
|---|---|---|---|
| 3 Fields (Name, Email, Phone) | 15–22% | 72/100 | Highest volume |
| 4 Fields (+Investment Range) | 12–18% | 81/100 | Best balance |
| 6 Fields (+AUM, Timeline) | 8–12% | 88/100 | Higher quality, lower volume |
| 8+ Fields (Full Details) | 4–7% | 93/100 | Severe volume drop |
The strategic recommendation from CuFinder's 2026 benchmark study: ask for name, email, and phone number on the landing page — then qualify leads through follow-up sequences. This approach converts 40% better than forms requesting full financial details upfront, without sacrificing pipeline quality.
CTA placement is equally important. Midstream Marketing's best practices analysis emphasizes that the CTA must be visible early and repeated naturally as the page flows. If a prospect is convinced halfway down the page, they should not need to scroll back to the top to act. Pages with CTAs visible above the fold and repeated at each major section break consistently outperform those with a single bottom-of-page form.
Additionally, the choice of CTA language matters significantly in advisory marketing. Specific CTAs like "Schedule Your 15-Minute Retirement Review" outperform generic alternatives like "Contact Us" or "Learn More" by 25–40% in click-through rate. The specificity reduces uncertainty about what happens after clicking — a critical friction point in high-stakes financial decisions.

Mobile vs. Desktop Conversion Gap
Mobile traffic accounts for 58.2% of financial advisory website visits, but desktop converts at more than double the rate: 4.8% vs. 2.1%. This gap is wider than most industries and reflects the high-consideration nature of financial decisions — prospects research on mobile but commit on desktop.
Implications for landing page design:
- Mobile-first design is non-negotiable given the 58.2% traffic share, but conversion optimization should prioritize desktop experiences where the money is made.
- Click-to-call CTAs on mobile pages bridge the conversion gap by offering an immediate, low-friction path to engagement.
- Progressive disclosure on mobile — showing one form field at a time rather than a full form — can reduce the mobile CVR gap by 30–40%.
- Cross-device tracking via GA4 user_id connects the mobile research session to the desktop conversion, enabling accurate attribution of mobile's contribution to pipeline.
Trust Architecture and Page Design Elements
Financial advisory landing pages operate in a trust-deficit environment. Prospects are evaluating whether to entrust their life savings to an advisor they found online. OJay Media's CRO analysis identifies the three failures that keep most advisor sites at 0.5–1.5% conversion: no single conversion path, weak above-fold value propositions, and no trust architecture.
Trust elements that measurably improve conversion:
- Credentials and certifications (CFP, CFA, ChFC) — displaying professional designations in the hero section establishes immediate credibility.
- Regulatory badges (SEC-registered, FINRA member) — compliance indicators that signal legitimacy to prospects unfamiliar with advisory firm structures.
- Client testimonials with disclaimers — under the SEC Marketing Rule, testimonials require specific disclosures but remain one of the highest-impact trust elements when properly implemented.
- Specific outcome statements — "We manage $450M for 200+ families" outperforms generic "trusted advisor" language by giving prospects concrete evidence of scale.
- Video introductions — landing pages with video achieve up to 80% conversion lift because video humanizes the advisor and builds familiarity before the first call.
A/B Testing Results in Financial Advisory Landing Pages
Systematic A/B testing delivers the most consistent conversion improvements, but the financial services compliance layer adds complexity. Wolf Financial's compliance-first testing framework provides benchmark results from controlled tests:
| Test Element | Typical CVR Lift | Compliance Risk | Recommended Priority |
|---|---|---|---|
| Form Fields (8 → 4) | +42% | Low | 1 (test first) |
| Form Fields (3 vs. 5) | +15–25% | Low | 1 |
| Video Addition | +50–80% | Medium (review content) | 2 |
| CTA Copy (Specific vs. Generic) | +20–35% | Medium | 2 |
| Headline (Benefit vs. Feature) | +10–22% | Medium | 3 |
| Social Proof Placement | +8–15% | High (testimonial rules) | 4 |
The most important finding: form optimization and video integration account for the largest conversion lifts and can be tested with relatively low compliance risk. Social proof placement — while effective — carries the highest compliance burden under the SEC Marketing Rule and should be tested only after legal review.
Financial Advisory Landing Pages vs. Other Industries
| Industry | Avg. LP CVR | Avg. CPC | Effective CPL | Key Differentiator |
|---|---|---|---|---|
| Financial Advisory | 3.4–4.0% | $8–$60 | $80–$250 | Trust architecture critical |
| Insurance | 2.1–3.5% | $5–$40 | $50–$180 | Quote tools boost CVR |
| Legal Services | 4.2–6.8% | $6–$50 | $45–$200 | Urgency-driven higher CVR |
| SaaS / B2B Tech | 5.2–7.5% | $3–$10 | $30–$120 | Free trial lowers barrier |
| Healthcare | 3.6–5.1% | $3–$8 | $25–$80 | Appointment booking focus |
Financial advisory sits at the lower end of conversion rates but generates the highest revenue per conversion. At $250K–$750K AUM per client and 1% advisory fees, even the highest CPL ($250) represents a 10:1 to 30:1 first-year return — making landing page optimization one of the most leveraged investments in the advisory marketing stack.
Landing Page Speed and Technical Performance
Page load speed has a measurable impact on financial advisory landing page conversions. Pages that load in under 2 seconds convert at nearly double the rate of pages loading in 4+ seconds — a gap amplified on mobile where connection quality varies. Key technical benchmarks from 2026 data:
- Target load time under 2.5 seconds — each additional second of load time reduces conversion by approximately 7% in financial services.
- Core Web Vitals compliance correlates with higher Quality Scores on Google Ads, reducing CPC by 5–15% for the same ad position.
- SSL certificates are table stakes — 94% of advisory landing pages now use HTTPS, and Google deprioritizes non-secure pages in both organic and paid results.
- Image optimization is the lowest-hanging fruit: compressing hero images and advisor headshots can reduce page weight by 40–60% without visible quality loss.
For advisory firms running paid campaigns with CPCs of $8–$60, every conversion lost to slow page speed represents significant wasted spend. A 1-second improvement in load time on a page receiving 1,000 monthly visits at a $30 CPC and 4% conversion rate saves approximately $840 per month in wasted clicks — more than enough to justify a technical performance audit.
Compliance Considerations for Advisory Landing Pages
Financial advisory landing pages must navigate SEC and FINRA advertising regulations, which directly affect what conversion elements can be used. Key compliance considerations include:
- Testimonials require specific disclaimers under the SEC Marketing Rule — they cannot imply guaranteed results and must include appropriate disclosures about compensation and material conflicts.
- Performance data presentation must be fair and balanced, showing both favorable and unfavorable periods. Cherry-picked returns on landing pages are a common SEC examination finding.
- Form data collection must comply with privacy regulations — CCPA and state-level privacy laws affect what information can be collected and how consent is obtained.
- All marketing materials require pre-approval at most RIA firms, which means landing page A/B tests need compliance review before going live — adding 3–10 business days to the testing cycle.
Despite these constraints, the advisory firms that build compliance review into their advertising workflow from the start actually iterate faster than those who treat compliance as an afterthought. Pre-approved template libraries and compliance-reviewed CTA formulas allow rapid testing within guardrails. The firms with the fastest testing cycles typically maintain a library of 10–15 pre-approved landing page templates that compliance has reviewed once, allowing marketing teams to swap headlines, images, and form configurations without re-entering the approval queue for each variation.
Related reading
- Financial Advisor WordPress Stats 2026
- Franchise Landing Page Statistics: 2026 Conversion Benchmarks for Multi-Location Brands
- HVAC Landing Page Statistics (2026): Conversion Rates & Speed Benchmarks
- Landing Page Design services at Web Tonic
FAQ
What is a good landing page conversion rate for financial advisors?
The average financial advisory landing page converts at 3.4–4.0%, with top performers reaching 11.5%. Non-optimized advisor websites convert at just 0.5–1.5%. A rate above 5% indicates a well-optimized page with strong trust elements and form design.
How many form fields should a financial advisor landing page have?
Data consistently shows that 3–4 fields (name, email, phone, optionally investment range) deliver the best balance of volume and quality. Reducing from 8 to 4 fields increases completions by 42% with minimal quality impact. Qualify leads through follow-up sequences rather than long initial forms.
Does video improve financial advisor landing page conversion?
Yes, significantly. Landing pages with video see up to 80% conversion lift. Video Sales Letters between 3–8 minutes are particularly effective for advisory funnels, pushing consultation show rates from 40–60% to 60–80% by pre-qualifying and building trust with prospects.
Why do financial advisory landing pages convert lower than other industries?
The 3.4–4.0% average reflects the high-stakes nature of financial decisions and longer sales cycles (6–18 months). Prospects are evaluating whether to entrust life savings, creating higher friction than SaaS free trials or healthcare appointment bookings. However, the revenue per conversion is dramatically higher, making the economics highly favorable.
How does mobile vs. desktop impact financial advisor landing page conversion?
Mobile accounts for 58.2% of traffic but converts at 2.1%, compared to desktop at 4.8%. This 2.3x gap means optimizing desktop conversion paths yields the highest immediate ROI, while mobile pages should focus on click-to-call CTAs and progressive form disclosure to narrow the gap.
Sources
https://www.benchmarketing.org/benchmarks/industries/financial-planning-fs
https://cufinder.io/blog/benchmarks/wealth-management/
https://www.ojaymediamarketing.com/blog/financial-advisor-website-design-that-converts/
https://www.apexure.com/blog/landing-page-conversion-rate-benchmarks-by-industry
https://wolf.financial/blog/landing-page-optimization-financial-lead-generation
https://wolf.financial/blog/compliant-ab-testing-strategies-financial-website-conversion
https://www.ojaymediamarketing.com/blog/marketing-kpis-for-financial-advisors/
https://www.midstreammarketing.com/landing-page-best-practices-for-financial-advisors/
https://www.ojaymediamarketing.com/blog/financial-advisor-advertising/


