



Table of contents

Only 38 % of financial advisory firms update their marketing dashboards weekly, yet firms with real-time reporting cadence see 2.3× better marketing ROI than those reviewing data monthly or quarterly. Below is a comprehensive breakdown of the KPIs, tools, reporting frequencies, and dashboard benchmarks that define financial advisory marketing analytics in 2026.
Key Takeaways
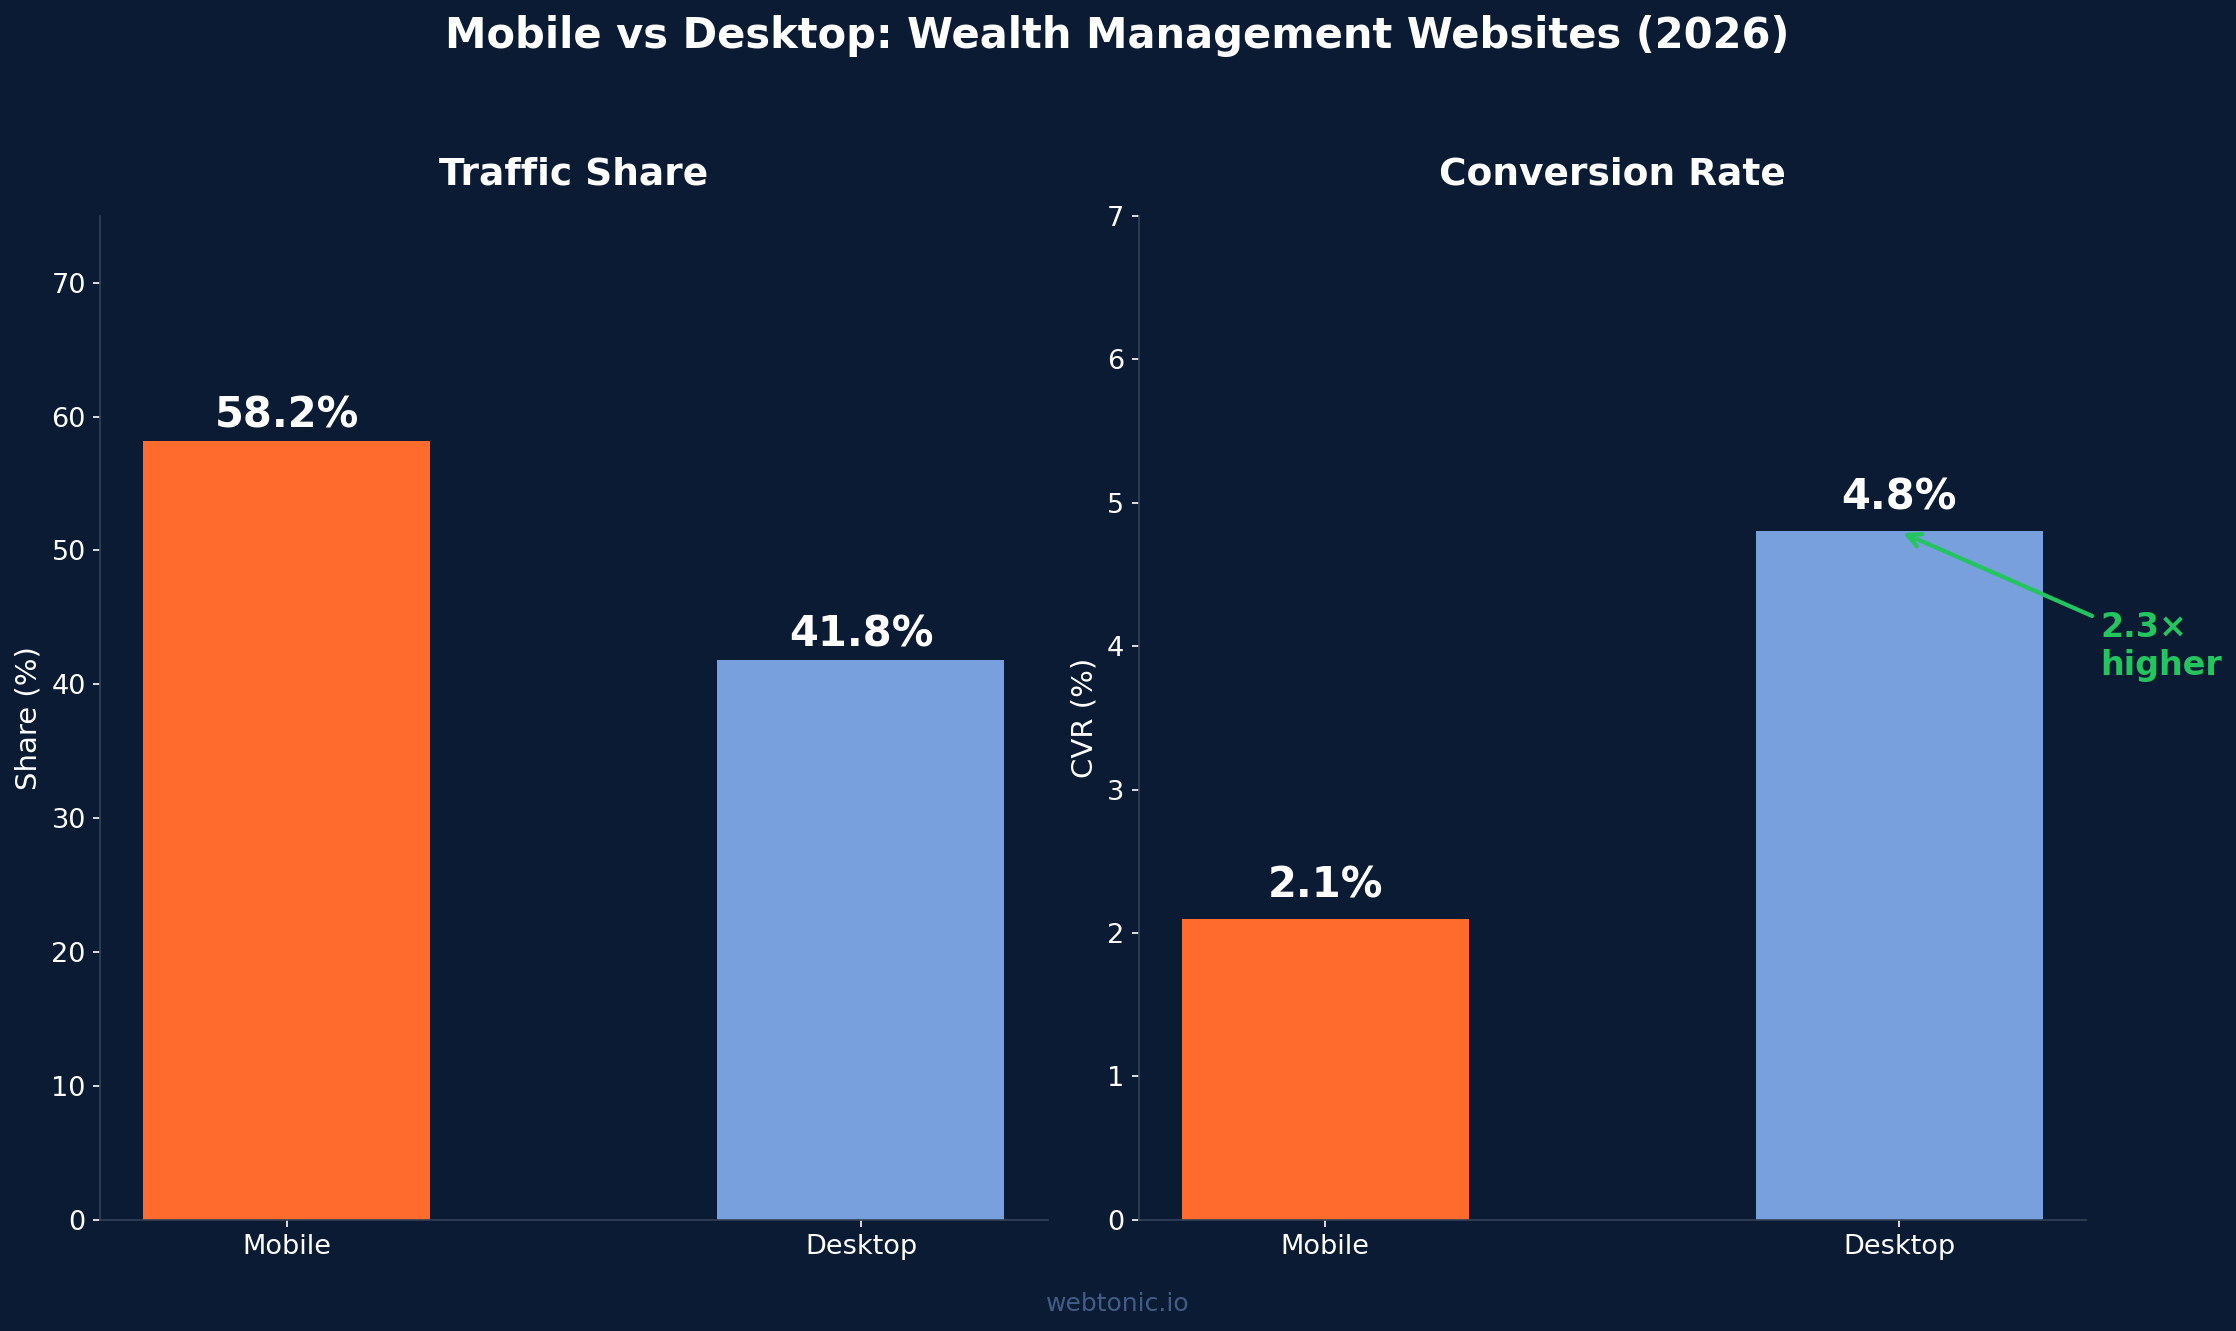
- Mobile traffic dominates wealth management sites at 58.2 %, but desktop converts 2× better (4.8 % vs 2.1 %).
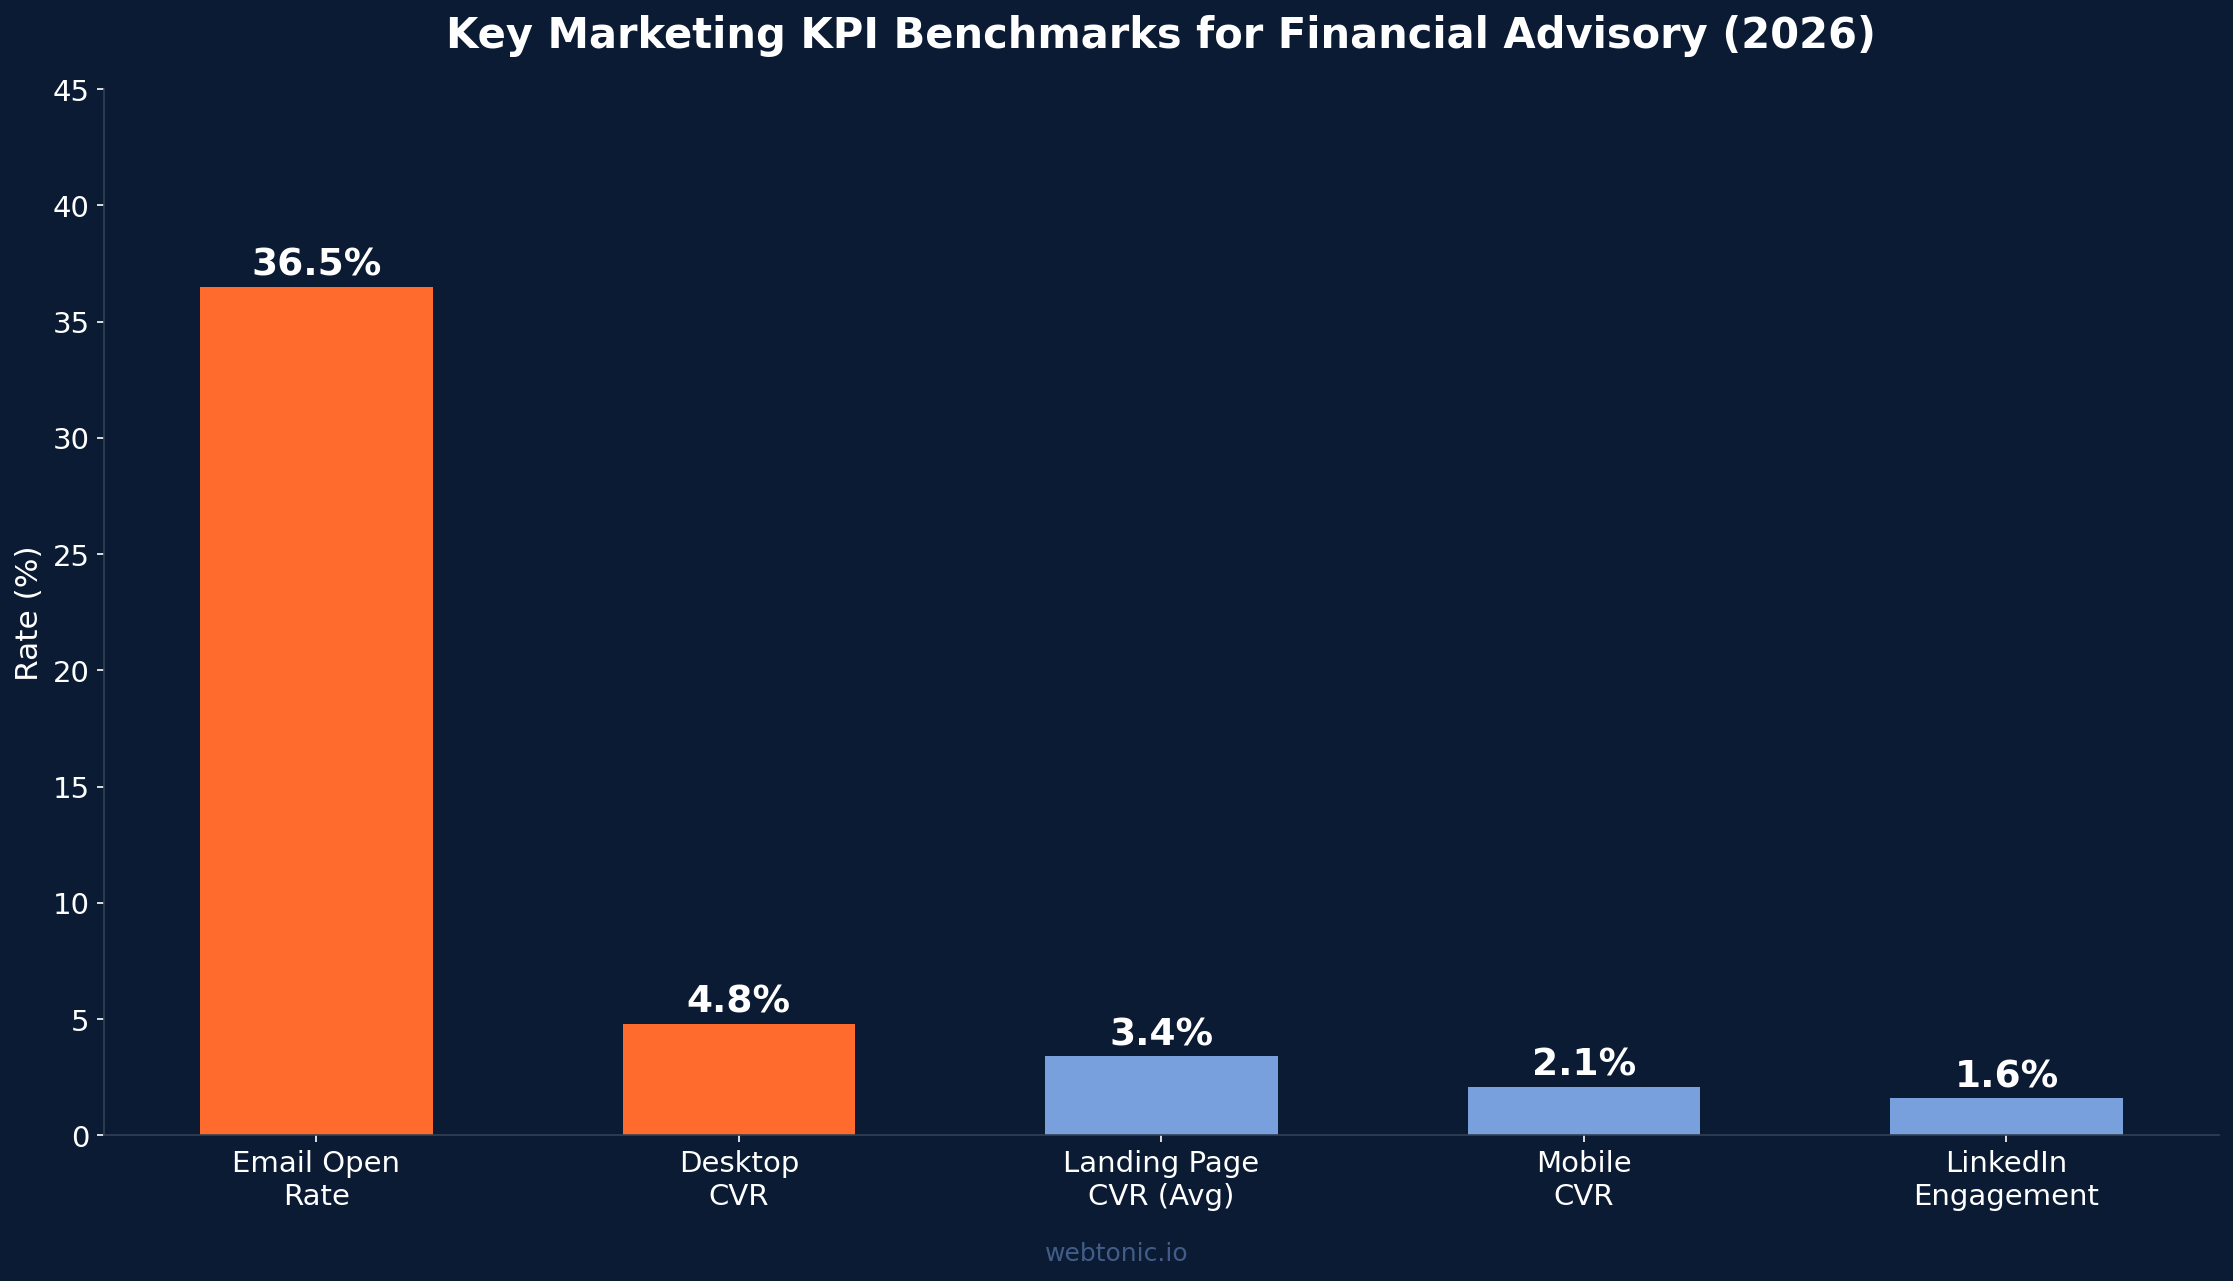
- Email open rates for financial advisors hit 36.5 %, among the highest across all industries — a KPI every dashboard must track.
- Average landing page conversion rate sits at 3.4 % for wealth management firms, with top performers reaching 11.5 %.
- LinkedIn engagement at 1.6 % outperforms all other social platforms for wealth management marketing.
- Google Ads CPC for financial services averages $5.85, with high-intent keywords exceeding $20.00 — a critical pacing metric for dashboards.
- Weekly dashboard reviews plus monthly strategic analysis is the recommended cadence for advisory firms spending over $5,000/month on marketing.
- 73 % of firms measure marketing via revenue attribution, yet most dashboards still focus on vanity metrics like impressions and clicks.
- The complete RIA tech stack now averages 8–12 integrated tools, with CRM, marketing automation, and portfolio reporting forming the data backbone.
Marketing Dashboard Benchmarks for Financial Advisors
| KPI | Financial Advisory Benchmark | Dashboard Priority |
|---|---|---|
| Landing Page CVR | 3.4 % (top: 11.5 %) | Critical — weekly |
| Email Open Rate | 36.5 % | High — weekly |
| Google Ads CPC | $5.85 (high-intent: $20+) | Critical — daily |
| LinkedIn Engagement | 1.6 % | Medium — weekly |
| Mobile Traffic Share | 58.2 % | Medium — monthly |
| Desktop CVR | 4.8 % | High — weekly |
| Mobile CVR | 2.1 % | High — weekly |
| Cost per Lead (Paid) | $80–$300 | Critical — weekly |
Essential KPIs for Financial Advisory Marketing Dashboards
OJay Media's KPI framework recommends distilling the weekly dashboard view to eight core metrics that capture both acquisition and conversion performance. The most effective advisory dashboards combine leading indicators (traffic, impressions, engagement) with lagging outcomes (meetings booked, proposals sent, funded accounts).
CuFinder's 2026 wealth management benchmarks provide the data layer for calibrating each KPI:
| Metric Category | KPI | Target / Benchmark | Alert Threshold |
|---|---|---|---|
| Website Performance | Landing Page CVR | 3.4 % (aim for 5 %+) | Below 2.0 % |
| Website Performance | Mobile vs Desktop CVR Gap | Desktop 2× mobile is normal | Gap widening beyond 3× |
| Paid Media | Google Ads CPC | $5.85 average | 2× above target |
| Paid Media | Cost per Lead | Goal-dependent | 2× above target CPL |
| Open Rate | 36.5 % | Below 25 % | |
| Social | LinkedIn Engagement | 1.6 % | Below 0.8 % |
| SEO | Organic Keyword Rankings | Growing top-20 count | Major ranking drops |
| Growth | Email List Growth | +5–10 % per month | Negative growth (churn exceeds adds) |
Optimal Reporting Cadence for Financial Advisory Firms
Select Advisors Institute and OJay Media's marketing checklist converge on a three-tier reporting rhythm:
| Cadence | Dashboard Focus | Key Actions |
|---|---|---|
| Weekly | Channel KPIs: CPL, CPC, CTR, email open/CTR, landing page CVR | Pause underperforming ads, adjust bids, flag anomalies |
| Monthly | Pipeline: meetings booked, proposals sent, organic rankings, list growth | Performance reviews tied to pipeline, budget reallocation |
| Quarterly | Strategic: CAC, AUM growth, client retention, channel ROI attribution | Strategy adjustments, budget planning, vendor evaluation |
Altrata emphasizes that the right reporting cadence depends on the firm's maturity, data quality, and sales cycle length. Firms with active paid media campaigns should review spend pacing and CPL daily, while firms relying primarily on content and referrals can operate effectively with weekly reviews and monthly deep dives.
Device Performance: The Mobile-Desktop Conversion Gap
One of the most actionable dashboard insights for advisory firms is the device-specific conversion gap. CuFinder reports that mobile traffic dominates at 58.2 % of total sessions, yet desktop converts at 4.8 % versus just 2.1 % on mobile — a 2.3× gap that has significant implications for budget allocation.
This gap means financial advisors should track device-segmented conversion rates as a core dashboard metric. Firms seeing a mobile CVR below 1.5 % likely have mobile-unfriendly forms, slow page loads, or scheduling flows that require too many taps. The fix often delivers the highest ROI of any single optimization — improving mobile CVR from 2.1 % to 3.5 % on a site with 10,000 monthly mobile visitors generates an additional 140 leads per month at zero incremental media cost.
The Financial Advisory Marketing Tech Stack in 2026
SecureWealth IT documents that the complete RIA tech stack now averages 8–12 integrated tools, with larger firms integrating general marketing automation platforms with Salesforce Financial Services Cloud for sophisticated segmentation, lead scoring, and campaign tracking alongside full CRM function.
NAZCO Labs notes that the RIA tech stack shape hasn't changed in 2026 — CRM, portfolio reporting, planning, custodian, scheduling, communications — but a governed AI layer now sits across all of it. This AI integration enables predictive dashboard features like churn risk scoring, next-best-action recommendations, and automated anomaly detection that flag KPI deviations before they become problems.
Gitnux reports that 73 % of financial services firms measure marketing via revenue attribution, yet the majority still rely on spreadsheet-based reporting rather than dedicated dashboard platforms. The gap between attribution capability and dashboard execution represents one of the largest efficiency opportunities in advisory firm marketing — firms that connect attribution data to automated dashboards reduce reporting time by 60–80 % and catch performance issues 5–7 days faster. Talk to our analytics team about building your dashboard.
Building an Effective Advisory Marketing Dashboard: Platform Options
Vantage Point's guide identifies the most impactful dashboard reports for financial advisors. The nine essential reports include: total AUM and AUM growth trend, new clients acquired this quarter, pipeline value and velocity, client retention rate, advisor activity scorecard, marketing ROI summary, compliance and review cadence status, email and campaign performance, and lead source attribution.
LatentView Analytics recommends focusing dashboards on customer acquisition cost, cost per funded account, customer lifetime value, product attach rate, churn rate by segment, marketing-influenced revenue, and return on marketing investment as the core performance indicators. The critical insight is that financial services dashboards must go beyond marketing metrics to include business outcomes — the most effective dashboards blend marketing KPIs with AUM growth, client retention, and revenue attribution in a single view.
For firms evaluating dashboard platforms, the market segments into three tiers. Entry-level dashboards (Google Looker Studio, free HubSpot) serve firms spending under $5,000/month on marketing. Mid-tier platforms (Databox, Klipfolio, paid HubSpot) suit firms at $5,000–$25,000/month. Enterprise solutions (Salesforce Financial Services Cloud, custom Tableau dashboards) support firms with $25,000+/month budgets and multiple data sources. Regardless of tier, the single most important feature is CRM integration — a dashboard disconnected from your pipeline is a reporting tool, not a decision tool.
Channel ROI Dashboard View for Advisory Firms
OJay Media provides channel-level ROI benchmarks that every advisory dashboard should display:
| Channel | Typical CPL | 1st-Year ROI | 3-Year ROI |
|---|---|---|---|
| LinkedIn Outbound | $250–$900 | 50–180 % | 280–620 % |
| SEO / Content | $100–$400 | 80–350 % | 400–1,200 % |
| Google Ads | $80–$250 | 120–400 % | 300–900 % |
| Email Nurture | $5–$30 | 200–800 % | 500–2,000 % |
| Partner Referrals | $0–$300 | 800–2,400 % | 2,000–5,500 % |
Common Dashboard Mistakes Financial Advisors Make
Despite increasing dashboard adoption, most advisory firms commit fundamental errors that undermine their analytics value. The most common mistake is tracking vanity metrics (impressions, page views, follower counts) instead of pipeline-connected KPIs. A dashboard showing 50,000 monthly impressions is meaningless if you cannot connect those impressions to the 12 meetings booked that month. Equally problematic is reporting frequency mismatch — reviewing Google Ads spend monthly means you discover budget waste 3–4 weeks too late.
Another critical error is ignoring the mobile-desktop conversion gap on dashboards. Firms that display aggregate CVR at 3.4 % miss that their mobile experience converts at just 2.1 % while desktop hits 4.8 %. Without device segmentation, optimization efforts target the wrong surface area. Similarly, dashboards without alert thresholds become passive reference documents rather than active management tools — the difference between catching a 2× CPL spike on day one versus discovering it during a monthly review can represent $5,000–$15,000 in wasted spend. Finally, isolating marketing data from sales outcomes perpetuates the perception of marketing as a cost center rather than a revenue engine, limiting future budget approvals and strategic influence within the firm.
Best Practices for Financial Advisory Marketing Dashboards
- Limit your weekly view to 8 core metrics — more data does not equal better decisions. Focus on CPL, CVR, CPC, email open rate, meetings booked, pipeline value, organic rankings, and list growth.
- Track device-segmented conversion rates — the 2.3× desktop-to-mobile CVR gap is your highest-leverage optimization target.
- Set alert thresholds for every KPI — define what "abnormal" looks like (e.g., CPL 2× above target) and automate notifications so problems surface immediately.
- Connect marketing dashboards to CRM pipeline stages — isolated marketing data without downstream conversion context produces vanity metrics, not insights.
- Review paid media pacing daily, organic metrics weekly, strategic KPIs quarterly — match reporting frequency to decision frequency.
- Include competitive benchmarks alongside your own data — knowing your 3.4 % CVR means nothing without the context that top performers hit 11.5 %.
- Automate reporting to reduce manual effort by 60–80 % — time spent building spreadsheets is time not spent optimizing campaigns.
Frequently Asked Questions
What KPIs should financial advisors track on their marketing dashboard?
The essential weekly dashboard should track cost per lead, landing page conversion rate, Google Ads CPC, email open rate, meetings booked, pipeline value, organic keyword rankings, and email list growth. Monthly reviews should add CAC, AUM growth, client retention, and channel-level ROI attribution.
How often should financial advisors review their marketing dashboards?
Paid media metrics should be reviewed daily for spend pacing and CPL monitoring. Full dashboard reviews weekly catch trends and anomalies. Monthly deep dives connect marketing performance to pipeline outcomes. Quarterly strategic reviews evaluate channel mix and budget allocation.
What is a good landing page conversion rate for financial advisors?
The average landing page CVR for wealth management firms is 3.4 %. Top performers reach 11.5 %. Any landing page below 2.0 % should trigger an optimization sprint. Desktop pages convert at 4.8 % versus 2.1 % on mobile.
What marketing technology do financial advisors need for dashboards?
The core RIA tech stack includes CRM (Salesforce, Wealthbox, or Redtail), marketing automation (HubSpot or ActiveCampaign), Google Analytics, and a reporting platform. The average RIA uses 8–12 integrated tools. A governed AI layer across the stack is increasingly standard for predictive analytics.
How do you measure marketing ROI on a financial advisor dashboard?
Track cost per funded account rather than cost per lead. Connect marketing touchpoints through CRM stages to AUM-weighted CAC. Display channel-level 1-year and 3-year ROI side by side — partner referrals deliver 800–2,400 % first-year ROI while LinkedIn runs 50–180 %.
Sources
CuFinder — Wealth Management Marketing Benchmarks 2026
OJay Media — Marketing KPIs for Financial Advisors
OJay Media — Financial Advisor Marketing ROI
Select Advisors Institute — RIA Marketing ROI Framework
Altrata — Wealth Management Marketing ROI
SecureWealth IT — Complete RIA Tech Stack 2026
NAZCO Labs — RIA AI Tech Stack 2026
Gitnux — Financial Service Industry Marketing Statistics
Vantage Point — HubSpot Dashboards for Financial Advisors
LatentView — Marketing Analytics for Financial Services


