



Table of contents

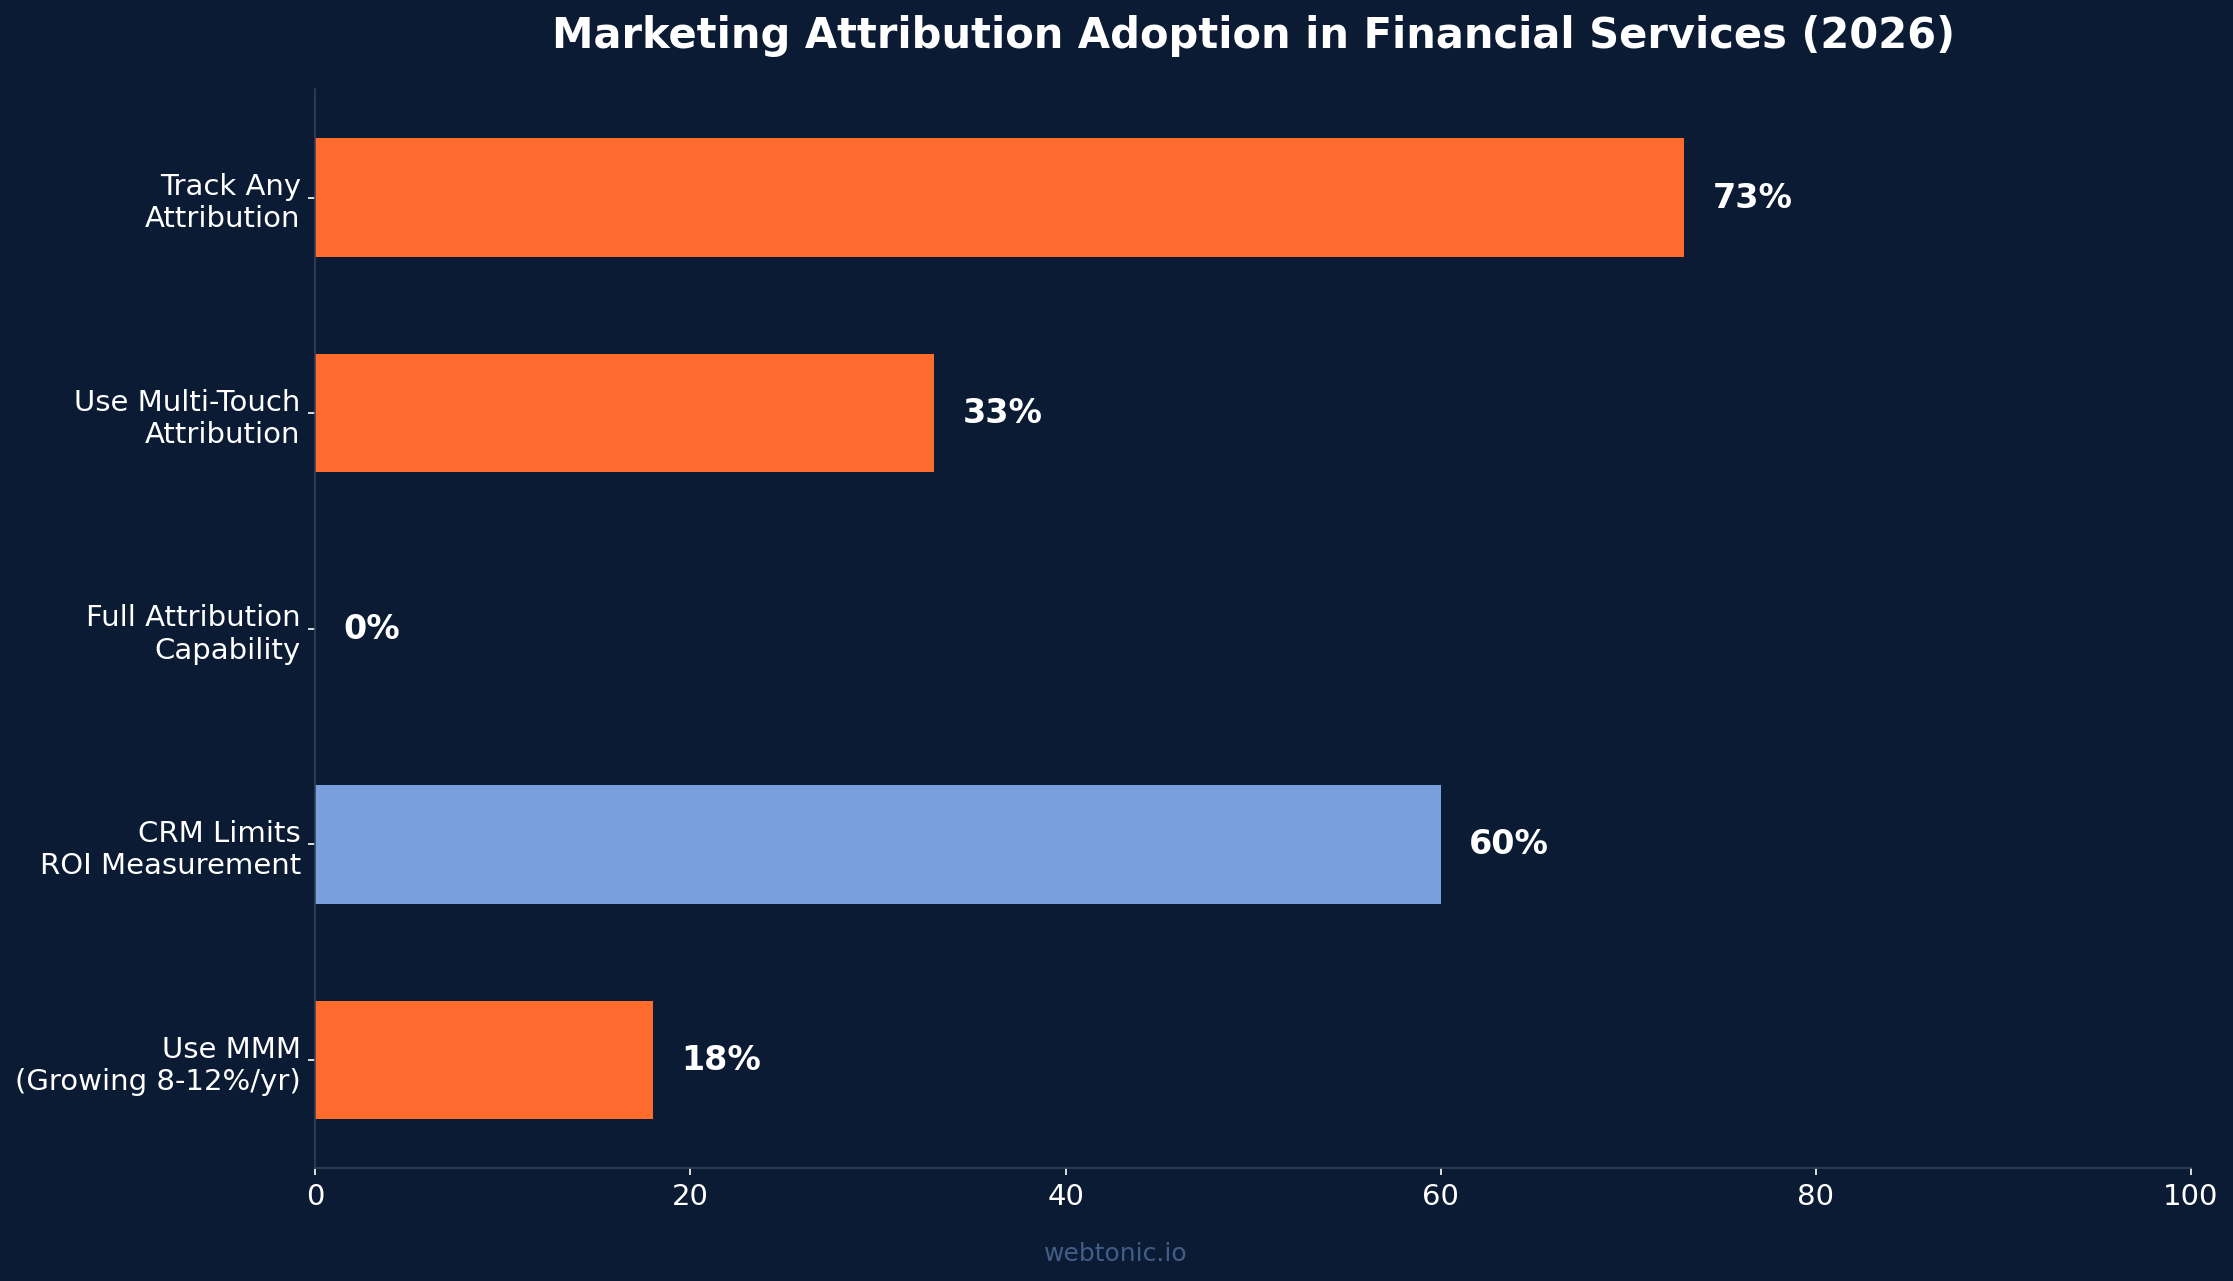
Zero percent of banks can reliably attribute all marketing outcomes to their spend, according to a 2026 Cornerstone Advisors survey of 126 senior executives — and the picture for independent financial advisors is barely better. Below are the attribution benchmarks (see also our growth marketing services), adoption rates, and measurement gaps that define how advisory firms track marketing ROI in 2026.
Key Takeaways
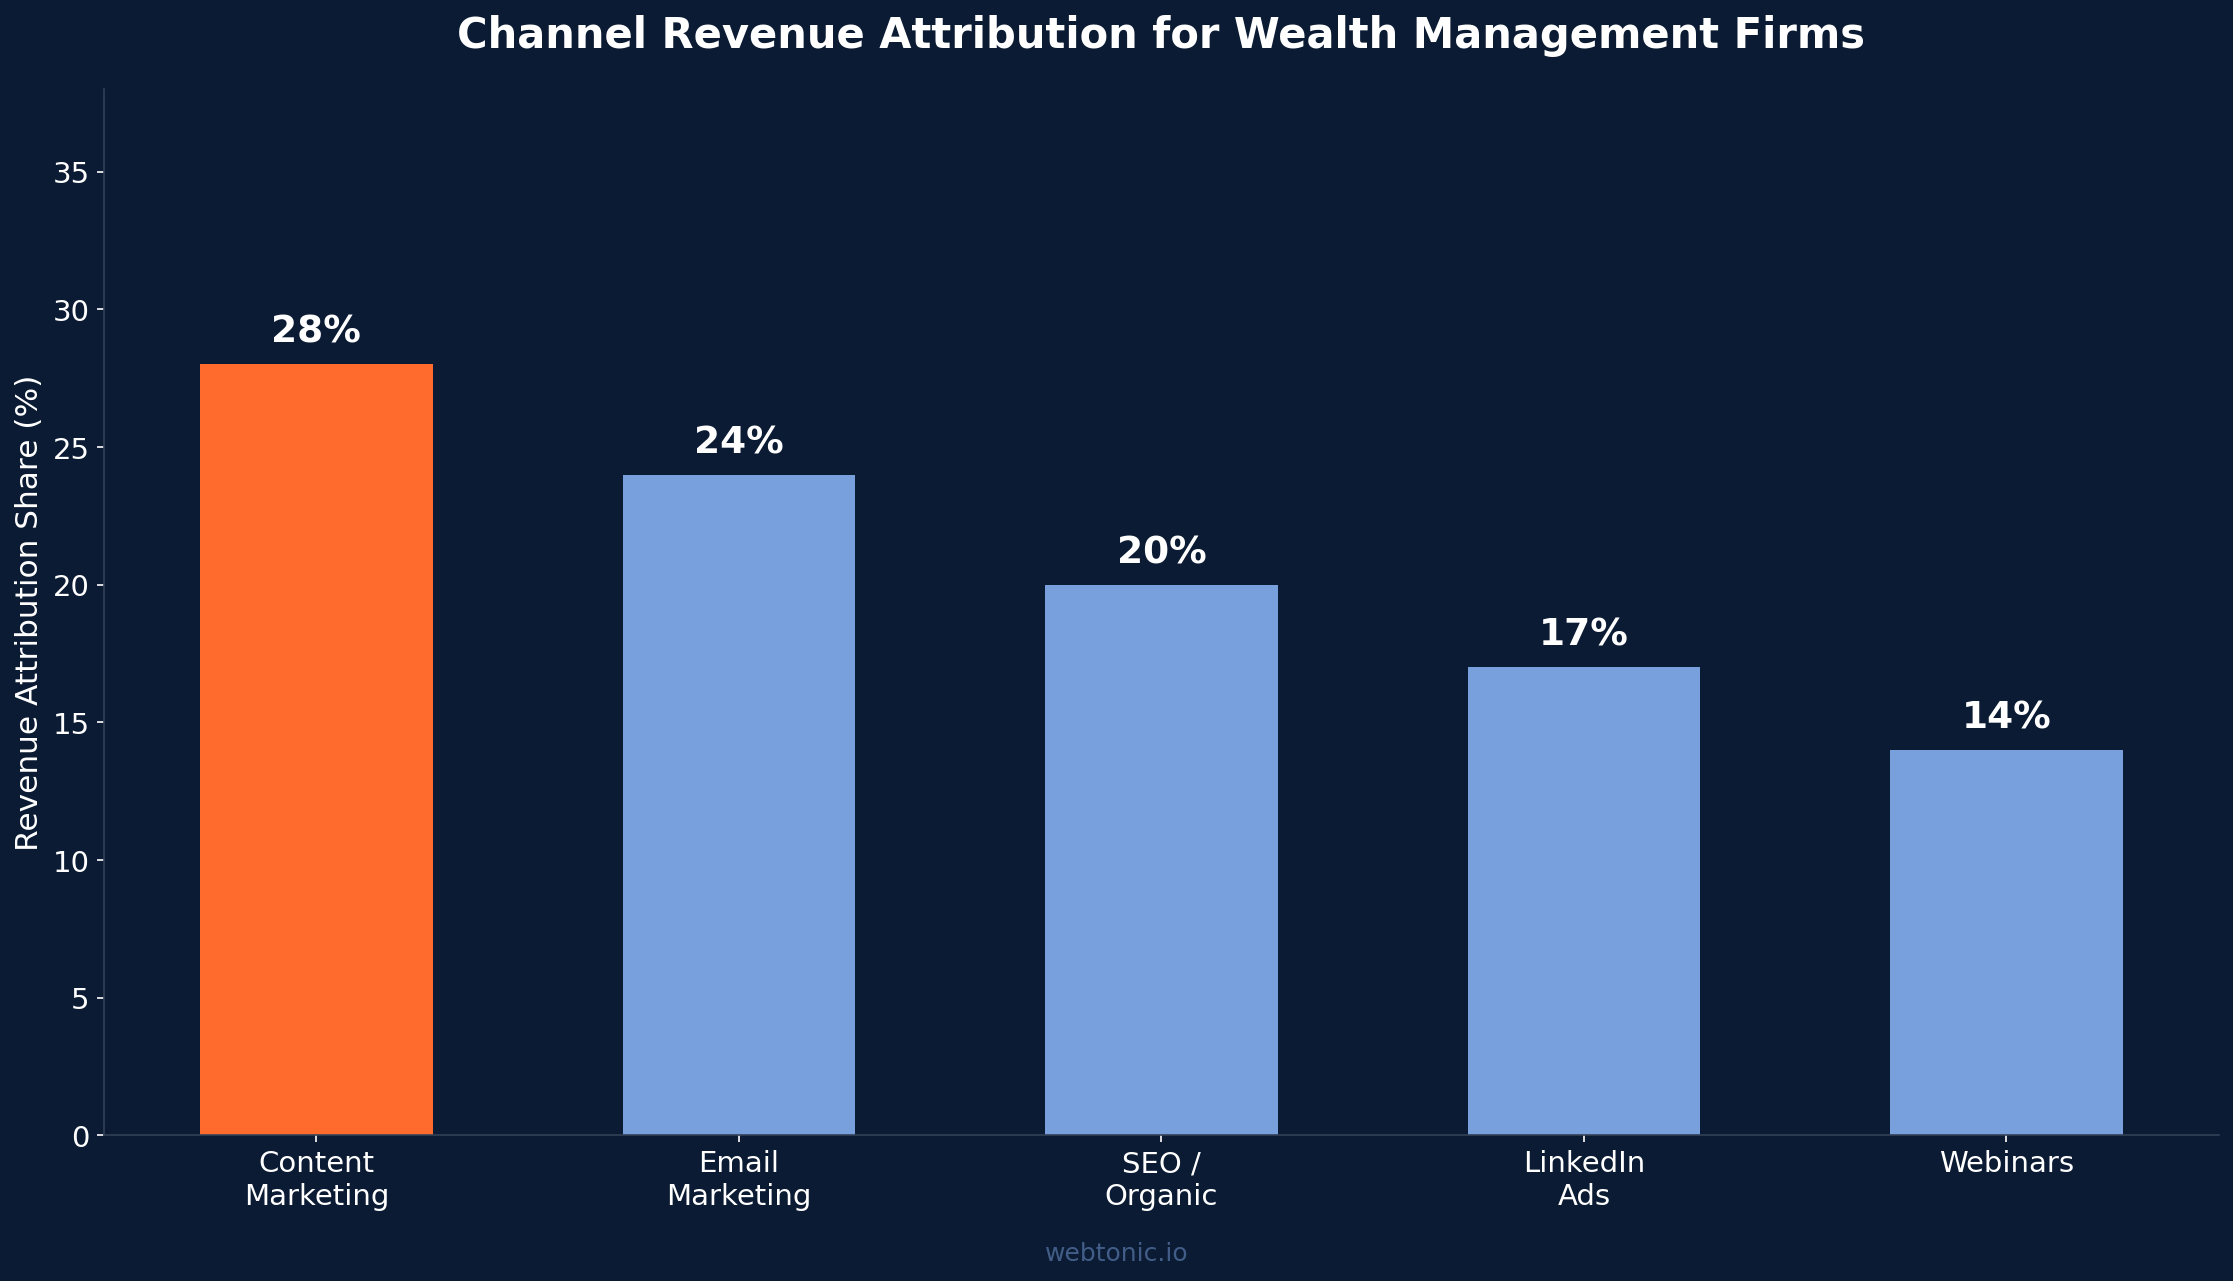
- 73 % of wealth management firms now track marketing attribution, with email emerging as the top-performing channel at 24 % revenue share.
- 0 % of banks can reliably attribute all outcomes to marketing spend, per a Cornerstone Advisors survey of 126 senior executives.
- Ad platforms collectively over-report conversions by 150–250 % compared to actual customer counts, inflating perceived ROI across every channel.
- Multi-touch attribution reveals content marketing drives 28 % of pipeline value for wealth management firms using MTA models.
- Nearly 6 in 10 financial institutions say their core or CRM system limits marketing ROI measurement, creating a structural attribution gap.
- Marketing mix modeling (MMM) adoption is growing 8–12 % year over year across financial services as firms seek alternatives to cookie-dependent tracking.
- The gap between $100 CPL and $7,000 CAC-per-funded-account is the entire attribution conversation for RIAs — firms tracking only CPL miss 98 % of the picture.
- Financial advisor sales cycles run 12–24 months, making single-touch attribution models fundamentally inadequate for advisory marketing.
Marketing Attribution Benchmarks for Financial Advisors
| Metric | Financial Advisory Benchmark | Cross-Industry Avg. |
|---|---|---|
| Firms Tracking Attribution | 73 % | 78 % |
| Full Attribution Capability | 0 % (banking) | ~15 % |
| MTA Adoption Rate | 33 % | 38 % |
| MMM Adoption (YoY Growth) | 8–12 % | 10–15 % |
| Avg. Sales Cycle Length | 12–24 months | 3–6 months |
| Platform Over-Reporting Rate | 150–250 % | ~200 % |
| CRM-Limiting Attribution | ~60 % | ~40 % |
Attribution Models Used by Financial Advisory Firms
The choice of attribution model fundamentally shapes how advisory firms evaluate channel performance. Vantage Point outlines the most common models for financial services:
| Model | Credit Distribution | Best For |
|---|---|---|
| First-Touch | 100 % to first interaction | Awareness campaign measurement |
| Last-Touch | 100 % to final interaction | Direct-response campaigns |
| U-Shaped | 40 % first / 40 % last / 20 % middle | Balanced acquisition analysis |
| W-Shaped | 30 % first / 30 % lead / 30 % opp / 10 % rest | Complex advisory sales cycles |
| Time-Decay | More weight to recent touches | Sales cycles exceeding 12 months |
Ridley & Co warns that last-click attribution remains prevalent in financial services despite being fundamentally flawed for advisory sales cycles. Their analysis shows that platform attribution suggests display contributed to 15 % of conversions, but path observability is estimated at only 55 % — meaning nearly half of the customer journey is invisible to tracking.
The Platform Over-Reporting Problem in Financial Services
One of the most critical attribution challenges is platform self-attribution bias. Ridley & Co's framework analysis reveals that ad platforms collectively claim 150–250 % of actual customers. A separate analysis puts the figure at 2.4× the actual customer count. Each platform runs its own attribution model optimized to take credit for conversions, creating a measurement gap that compounds across channels.
For financial advisory firms, this over-reporting has direct budget implications. Cornerstone Advisors' 2026 research found that more than half of financial institutions set marketing budgets by adjusting the previous year's budget — a practice that perpetuates misallocation when attribution data is unreliable. Fintel Connect explains that attribution challenges in financial services shape how budgets get allocated, how channels get judged, and how marketing is perceived internally.
Channel Attribution Performance for Wealth Management Firms
Gitnux reports detailed channel-level attribution data for wealth management firms:
| Channel | Revenue Attribution Share | Pipeline Contribution |
|---|---|---|
| Email Marketing | 24 % | Top performer |
| Content Marketing | 28 % of pipeline | Highest MTA pipeline value |
| LinkedIn Ads | 15–20 % | Highest lead-to-opp rate |
| SEO / Organic Search | 18–22 % | 37 % client growth from optimized sites |
| Webinars | 12–16 % | 61 % prospect-to-client rate |
| Referrals | Hard to attribute | 65 % of advisors' #1 source |
The CPL-to-CAC Gap: Why Attribution Must Go Beyond Lead Cost
OJay Media emphasizes that the gap between $100 CPL and $7,000 CAC-per-funded-account represents the entire attribution conversation for RIAs. Firms that only track cost per lead miss 98 % of the economic picture. True attribution for financial advisors requires connecting marketing touchpoints through CRM stages all the way to AUM-weighted client acquisition cost.
Finanads notes that the industry is shifting from last-click models to multi-touch, algorithmic attribution that more accurately assigns value across channels. However, compliance constraints in financial services create unique friction: RIAs must balance attribution tracking with SEC/FINRA advertising rules, which limit certain tracking methods and require disclosure of marketing materials. This regulatory layer adds 15–25 % overhead to attribution implementation compared to unregulated industries.
The Financial Advisory Sales Cycle: Why Attribution Requires Patience
Financial advisory sales cycles are among the longest in any industry, which fundamentally breaks standard attribution windows. Vantage Point documents that wealth management sales cycles average 12 months, while asset management relationships can take up to 24 months from first touch to funded account. During that time, a typical prospect engages with 15–25 marketing touchpoints across multiple channels and devices.
This extended journey creates three distinct attribution challenges. First, cookie windows expire long before the sale closes — most digital attribution tools use 30–90 day lookback windows, capturing only 10–15 % of the total journey. Second, cross-device tracking fragments the path — a prospect might discover you on mobile LinkedIn, research on desktop, attend a webinar on a tablet, and schedule through a phone call. Third, offline touchpoints like seminars, referral conversations, and in-person meetings often represent the most influential moments but leave no digital trace.
Ridley & Co estimates that path observability in financial services sits at approximately 55 %, meaning 45 % of the customer journey is completely invisible to digital tracking. For firms spending $5,000–$25,000 per month on marketing, this visibility gap translates to $27,000–$135,000 annually in spend with uncertain attribution.
CRM-Linked Attribution: The Foundation for Advisory Firms
Ridley & Co's framework identifies CRM-linked attribution as the most credible model for financial advisory firms. This approach connects marketing touchpoints to lead progression, application status, and stage conversion — becoming board-credible when definitions are agreed with sales, finance, and operations teams.
For RIAs implementing CRM-linked attribution, OJay Media recommends tracking these downstream metrics beyond raw lead counts:
| Metric | What It Measures | Advisory Benchmark |
|---|---|---|
| Cost per Held Meeting | Marketing spend ÷ meetings that occurred | $200–$600 |
| Cost per Proposal Sent | Spend through the proposal stage | $800–$2,500 |
| Cost per Funded Account | True acquisition cost including all touches | $3,500–$15,000 |
| AUM-Weighted CAC | Acquisition cost per dollar of managed assets | $0.003–$0.015 per $1 AUM |
| 12-Month Client LTV | First-year revenue per acquired client | $5,000–$25,000 |
Firms that implement full-funnel CRM-linked attribution see a 30–50 % improvement in marketing budget efficiency within the first year, according to Finanads. The key insight is that most advisory firms already have the data — the gap is connecting marketing touchpoint tracking to existing CRM pipeline stages through consistent UTM parameters and lead-source tagging.
Emerging Attribution Solutions for Financial Advisory Firms
Presenc AI reports that marketing mix modeling (MMM) adoption is growing 8–12 % year over year as financial firms seek alternatives to cookie-dependent tracking. MMM uses statistical regression to correlate spend with outcomes without requiring individual-level tracking — a significant advantage for privacy-conscious advisory firms.
Digital Applied's 2026 data shows that single-model attribution effectively died with cookie deprecation. The leading edge of financial services marketing now uses hybrid MTA + MMM approaches, combining digital touchpoint tracking with econometric modeling to fill the gaps that consent-based tracking creates. For advisory firms, this means pairing CRM-linked attribution with periodic MMM studies to validate channel-level ROI assumptions. The cost of implementing a hybrid approach has dropped significantly — entry-level MMM platforms now start at $2,000–$5,000 per quarter, making them accessible to mid-size RIAs for the first time.
Best Practices for Financial Advisory Marketing Attribution
- Wire multi-touch attribution into your CRM within 90 minutes — this is the single highest-leverage data project for a $5 K–$25 K/month advisory program.
- Track CAC-per-funded-account, not CPL — the $100 CPL vs $7,000 CAC gap represents the real economics that attribution must capture.
- Use W-shaped attribution for advisory sales cycles — 30 % first-touch, 30 % lead conversion, 30 % opportunity creation captures the 12–24 month journey.
- Audit platform-reported conversions quarterly — expect 150–250 % over-reporting and normalize numbers against CRM-verified conversions.
- Implement UTM parameters on every campaign — structured UTM architecture is the foundation of any attribution system.
- Run annual MMM studies to validate MTA findings — cross-reference digital attribution with regression-based analysis to catch systematic biases.
- Connect offline touchpoints (seminars, referrals) to digital tracking — without offline integration, 40–60 % of the advisory client journey is invisible.
Frequently Asked Questions
What is marketing attribution for financial advisors?
Marketing attribution is the process of identifying which marketing touchpoints contributed to client acquisition. For financial advisors, this means tracking how prospects move from initial awareness (blog post, ad, seminar) through to a funded account, assigning credit to each touchpoint along the 12–24 month journey.
Why is attribution so difficult for financial advisory firms?
Sales cycles of 12–24 months, offline touchpoints like seminars and referrals, regulatory constraints on tracking, and CRM limitations (affecting 60 % of firms) all create structural barriers. Additionally, ad platforms over-report by 150–250 %, making self-reported channel data unreliable.
What attribution model should financial advisors use?
Most advisory firms benefit from a W-shaped model that gives 30 % credit each to first touch, lead conversion, and opportunity creation. For firms with sales cycles exceeding 12 months, time-decay models provide the most useful insights for budget allocation decisions. Talk to our team about implementing attribution for your firm.
How do you measure marketing ROI for wealth management?
Track CAC-per-funded-account rather than cost per lead. Connect marketing touchpoints through CRM stages to AUM-weighted acquisition cost. Use multi-touch attribution paired with annual MMM studies to validate findings. The benchmark is $3,500–$15,000 CAC per funded advisory client.
What percentage of financial firms use marketing attribution?
73 % of wealth management firms track marketing attribution in some form, but 0 % of banks can reliably attribute all outcomes. True multi-touch attribution adoption sits at roughly 33 %, with most firms still relying on last-click or first-click models.
Sources
Ridley & Co — Attribution in Regulated Finance
Ridley & Co — Why Last-Click Fails in Financial Services
Cornerstone Advisors — Banking Marketing ROI Research (2026)
Gitnux — Marketing in Wealth Management Statistics
Digital Applied — Marketing Attribution Statistics 2026
Vantage Point — Multi-Touch Attribution for Financial Services
Presenc AI — MMM Adoption Rate 2026
Finanads — RIA Marketing Attribution Setup
OJay Media — Financial Advisor Marketing ROI
Fintel Connect — Attribution Breakdown in Banking


