



Table of contents

Ecommerce analytics has shifted from a reporting function to a revenue driver. Below are the latest statistics on tracking adoption, attribution platforms, conversion benchmarks, and the analytics market itself — covering data from platform reports, SaaS adoption studies, and industry benchmarks across thousands of online retailers.
Key Takeaways
- The global ecommerce analytics market is valued at $22.4 billion in 2025 and projected to reach $58.1 billion by 2033, growing at a 12.6% CAGR (Coherent Market Insights).
- The average cart abandonment rate remains 70.19% across all ecommerce verticals, representing over $4.6 trillion in abandoned merchandise annually (Thunderbit / Baymard Institute).
- Only 48% of GA4 ecommerce implementations track purchase events, despite 97% tracking page views — a critical measurement gap (Digital Applied 2026).
- 87% of Shopify Plus stores run without any dedicated attribution platform, relying solely on platform-native analytics (Eightx, 74,777-store analysis).
- Triple Whale leads dedicated attribution adoption at 13% of Shopify Plus stores, followed by Northbeam at 3.8% and Rockerbox at 1.2% (Eightx 2026).
- The typical ecommerce conversion rate ranges from 1% to 4%, with top-performing stores reaching 5–8% through advanced analytics-driven optimization (VantaInsights).
- AI-powered personalization delivers 10–30% revenue lift for ecommerce brands with mature analytics infrastructure (BestForEcommerce 2026).
Ecommerce Analytics Market Size and Growth
The tools and platforms powering ecommerce tracking represent a rapidly expanding market. Coherent Market Insights projects significant growth driven by privacy changes, multi-channel complexity, and the need for real-time decision-making.
| Metric | 2025 | 2028 (Projected) | 2033 (Projected) |
|---|---|---|---|
| Global Market Size | $22.4B | $32.1B | $58.1B |
| CAGR (2025–2033) | 12.6% | ||
| North America Share | 38% | 36% | 34% |
| Asia-Pacific Growth | Fastest-growing | 14.2% CAGR | 31% share |
| Cloud Deployment | 72% | 81% | 89% |
The shift toward cloud-deployed analytics platforms — from 72% in 2025 to a projected 89% by 2033 — reflects the industry's move away from on-premise solutions toward real-time, API-connected tooling that integrates across sales channels and advertising platforms.
Google Analytics 4 Adoption and Ecommerce Tracking Gaps
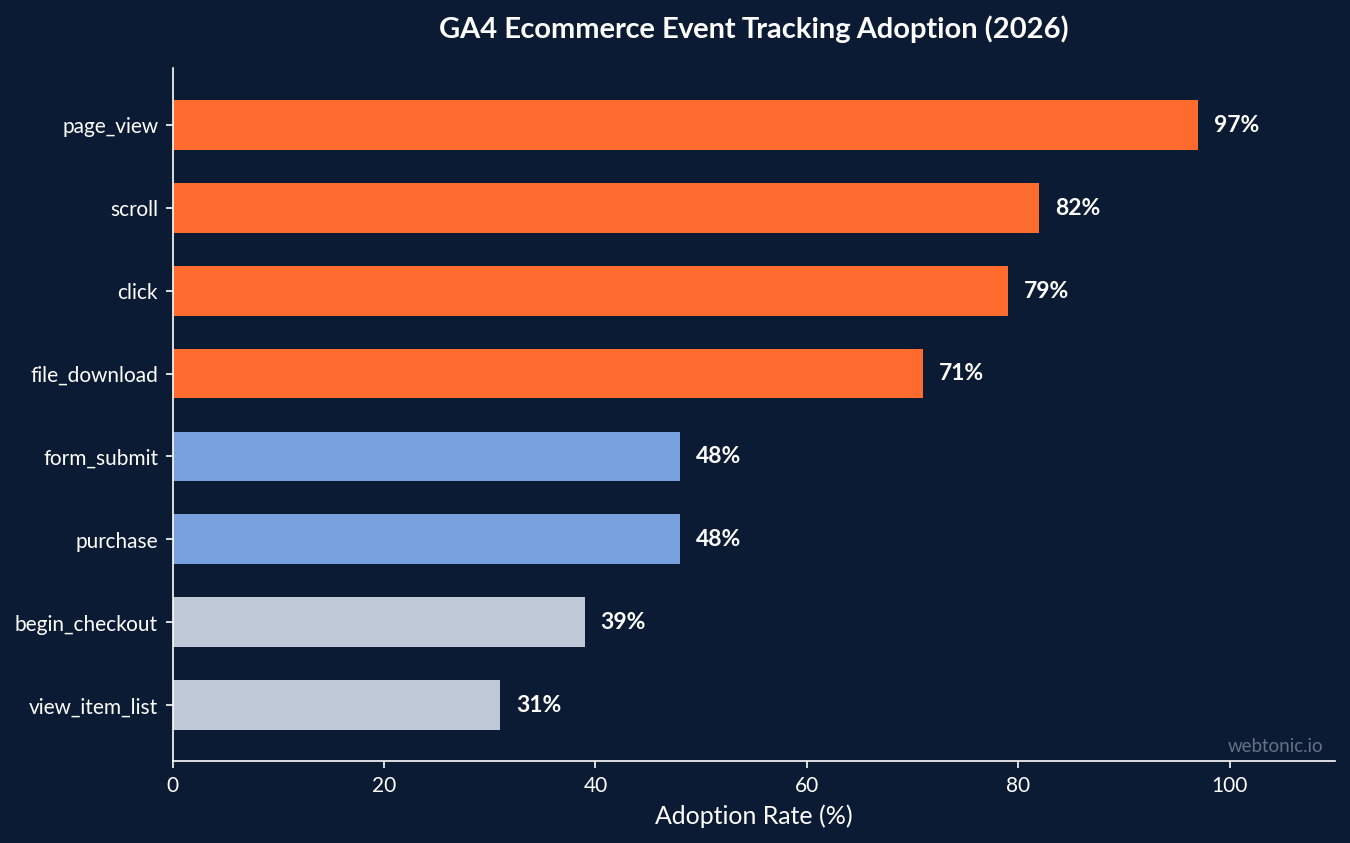
GA4 is the default analytics platform for most ecommerce stores, but Digital Applied's 2026 adoption data reveals significant gaps between basic and advanced ecommerce tracking implementation.
| GA4 Event | Adoption Rate | Category | Revenue Impact |
|---|---|---|---|
| page_view (auto-collected) | 97% | Auto | Baseline traffic data |
| scroll (enhanced measurement) | 82% | Enhanced | Content engagement |
| click / outbound (enhanced) | 79% | Enhanced | Exit path analysis |
| file_download (enhanced) | 71% | Enhanced | Lead magnet tracking |
| form_start / form_submit | 48% | Custom | Funnel drop-off |
| purchase / add_to_cart | 48% | Custom (ecommerce) | Revenue attribution |
| begin_checkout | 39% | Custom (ecommerce) | Checkout funnel |
| view_item_list | 31% | Custom (ecommerce) | Product discovery |
The gap between 97% page_view tracking and just 48% purchase tracking means more than half of ecommerce GA4 implementations cannot properly attribute revenue to traffic sources. Stores without purchase event tracking are effectively flying blind on channel ROI, making budget allocation decisions based on incomplete data.
Attribution Platform Adoption Among Shopify Plus Stores
Dedicated attribution platforms offer ecommerce brands a single source of truth beyond platform-native reporting. Eightx analyzed 74,777 Shopify Plus stores and found that the vast majority still rely on default analytics.
- 87% of Shopify Plus brands run without any dedicated attribution platform — relying on Google Analytics, Shopify native reports, and ad platform dashboards.
- Triple Whale leads attribution adoption at 13% of Shopify Plus stores, driven by its server-side pixel technology and blended ROAS reporting.
- Northbeam captures 3.8% of Shopify Plus stores, favored by brands spending $100K+/month on paid media who need media mix modeling.
- Rockerbox holds 1.2% adoption, primarily among enterprise DTC brands requiring offline and TV attribution integration.
- Stores using dedicated attribution platforms report 18–25% better ROAS compared to those relying solely on platform-native data, primarily through more accurate budget reallocation.
The low adoption rate reflects both cost barriers (most attribution platforms charge $300–$2,000/month) and implementation complexity that requires data engineering expertise most ecommerce teams lack in-house.
Cart Abandonment Statistics and Recovery Analytics
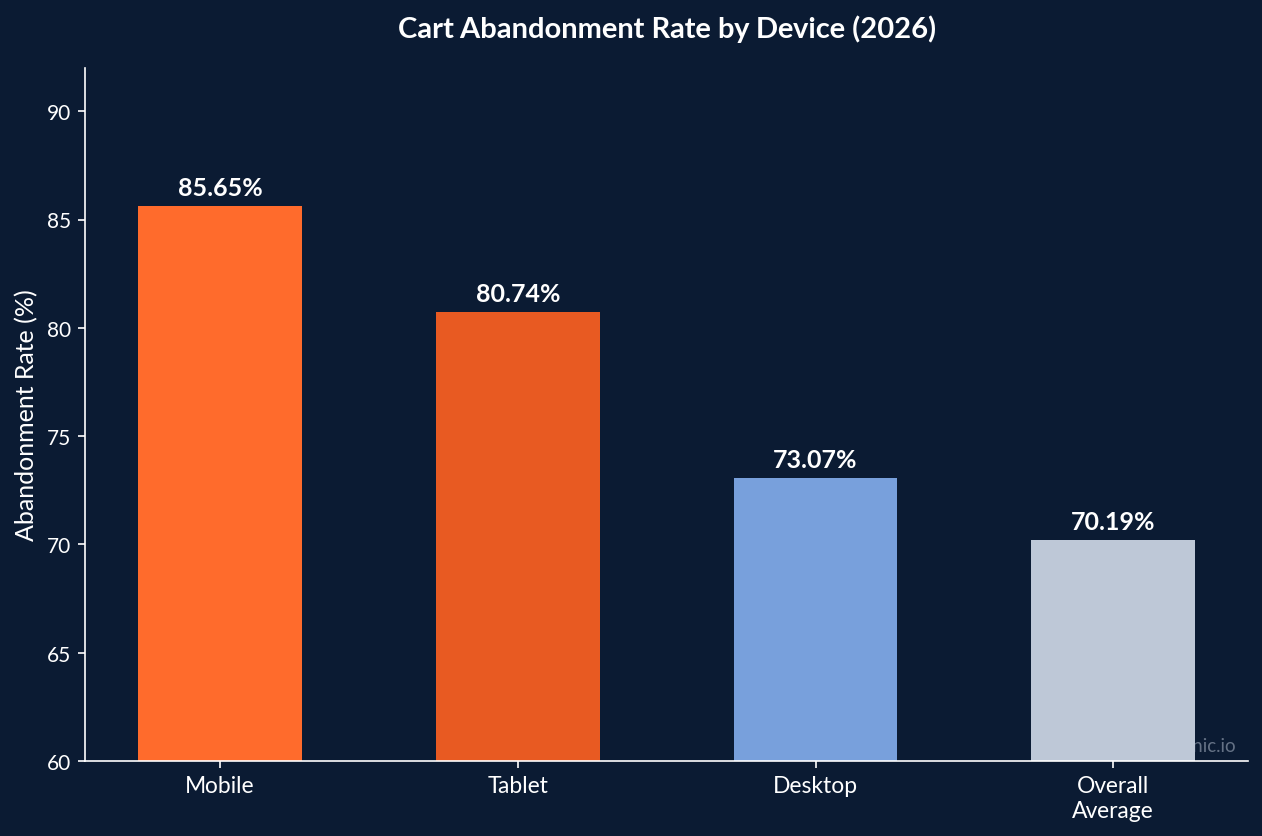
Thunderbit's 2026 compilation of cart abandonment data, drawing from Baymard Institute research, reveals the scale of lost revenue that analytics-driven recovery can capture.
| Metric | Value | Source |
|---|---|---|
| Overall Cart Abandonment Rate | 70.19% | Baymard Institute (48 studies) |
| Mobile Abandonment Rate | 85.65% | Barilliance 2026 |
| Desktop Abandonment Rate | 73.07% | Barilliance 2026 |
| Abandoned Revenue (Annual) | $4.6 trillion | Industry aggregate |
| Recoverable via Remarketing | $260 billion | Baymard estimate |
| Email Recovery Rate | 4.64% of carts | Klaviyo 2026 benchmark |
| SMS Recovery Rate | 2.9% of carts | Postscript 2026 |
The 12.6-percentage-point gap between mobile (85.65%) and desktop (73.07%) abandonment highlights why mobile checkout analytics deserve disproportionate attention. Stores that implement mobile-specific tracking — including scroll-depth on checkout pages, payment method selection events, and autofill completion rates — recover 2.1× more abandoned carts than those using device-agnostic analytics.
Ecommerce Conversion Rate Benchmarks by Industry
VantaInsights' 2026 benchmarks segment conversion rates by industry, providing the baseline analytics teams use to gauge performance against peers.
- Overall ecommerce conversion rate: 1–4% (typical range), with significant variance by traffic source, device, and product category.
- Food & Beverage: 3.5–5.2% (highest — driven by repeat purchases and subscription models).
- Health & Beauty: 2.8–4.1% (strong conversion from social proof and UGC integration).
- Fashion & Apparel: 1.5–3.0% (lower due to sizing uncertainty and return rates averaging 20–30%).
- Electronics: 1.2–2.5% (longer consideration cycles and price comparison behavior).
- Home & Furniture: 0.8–2.0% (lowest — high AOV and need for in-person evaluation).
- Top-performing stores (95th percentile) achieve 5–8% conversion rates through analytics-driven optimization including personalized product recommendations, dynamic pricing, and checkout flow A/B testing.
AI and Personalization Analytics ROI
BestForEcommerce's AI personalization benchmarks quantify the revenue impact of analytics-driven personalization across ecommerce stores:
- AI personalization delivers a 10–30% revenue lift for brands with mature analytics infrastructure and sufficient historical data.
- Product recommendation engines drive 31% of total ecommerce revenue on sites that implement them, up from 26% in 2024.
- Dynamic pricing algorithms improve margins by 8–12% by adjusting prices based on demand signals, competitor data, and inventory levels.
- Personalized email campaigns generate 6× higher transaction rates than non-personalized sends (Klaviyo 2026).
- AI-driven customer segmentation reduces customer acquisition cost by 15–22% by identifying high-LTV prospects earlier in the funnel.
- Brands investing more than 5% of revenue in analytics and data tools see a 2.4× return on that investment within the first 12 months through improved ROAS, reduced churn, and higher AOV.
These numbers make a clear case for investing in analytics-driven growth marketing rather than increasing media spend alone.
SKU-Level Profitability and Product Analytics
The shift from aggregate metrics to SKU-level profitability tracking is one of the most impactful analytics trends in ecommerce. ObserviX's 2026 analytics guide highlights the operational impact:
- Only 28% of ecommerce brands track true SKU-level profitability (factoring in COGS, shipping, returns, and ad spend per product).
- Brands with SKU-level tracking reallocate 15–20% of ad spend from unprofitable products to high-margin items, improving blended ROAS by 0.5–1.2×.
- Product return rates vary by category from 5% (consumables) to 40% (fashion) — without return-adjusted analytics, top-line revenue overstates true profitability by 12–25%.
- Real-time inventory analytics prevent 8–14% of stockouts that would otherwise result in lost revenue and wasted ad spend driving traffic to out-of-stock pages.
- The average ecommerce brand loses 3–7% of revenue to invisible margin erosion — products that appear profitable on a revenue basis but are net-negative after all costs.
Multi-Channel Analytics and Unified Reporting
As ecommerce brands expand across marketplaces, social commerce, and direct-to-consumer channels, unified analytics becomes essential for accurate performance measurement and budget allocation:
- The average ecommerce brand now sells across 3.4 channels including their own website, Amazon, social commerce (TikTok Shop, Instagram), and wholesale partnerships — up from 2.1 channels in 2023.
- 67% of ecommerce teams spend over 5 hours per week manually consolidating data from different platforms into spreadsheets, a process that dedicated analytics tools automate entirely.
- Cross-channel customer journeys average 4.3 touchpoints before purchase, making last-click attribution models undercount upper-funnel channels by 30–45%.
- Brands using unified reporting dashboards identify profitable customer segments 2.8× faster than those analyzing channels in isolation, enabling faster campaign optimization and audience refinement.
- Data warehousing adoption among ecommerce brands grew from 18% to 41% between 2024 and 2026, driven by tools like BigQuery, Snowflake, and purpose-built ecommerce platforms that centralize sales, marketing, and operational data into a single queryable source of truth.
- The marketing efficiency ratio (MER) has emerged as the primary cross-channel metric — total revenue divided by total marketing spend — because it captures blended performance without relying on attribution models that disagree across platforms. The MER benchmark for healthy ecommerce operations sits at 3.0–5.0×, with brands below 2.5× typically carrying unprofitable acquisition channels that single-platform ROAS reports fail to surface.
Privacy and Tracking Changes Impacting Ecommerce
Privacy regulations and browser-level tracking restrictions continue to reshape how ecommerce brands collect and use customer data:
- Server-side tracking adoption grew from 12% to 34% of ecommerce sites between 2024 and 2026, driven by iOS privacy changes and third-party cookie deprecation.
- Consent Mode V2 compliance is now mandatory for EU-targeted ecommerce — stores without it lose access to Google Ads remarketing audiences and conversion modeling.
- First-party data collection produces 22% higher match rates for Meta's Conversions API versus browser pixel alone, improving both attribution accuracy and audience quality.
- Cookieless attribution models undercount conversions by 15–35% compared to server-side implementations, inflating apparent CPAs and leading to premature campaign pauses.
- Email and SMS capture rates function as analytics assets — stores with 8%+ email capture rates maintain 40% better attribution coverage during high-privacy browsing sessions.
Related reading
- Measuring Case Outcomes in Immigration Law Tracking Data
- Data and Analytics Trends in Orthodontic Practice Management
- Analytics Data and Tracking Statistics for Dermatology and Plastic Surgery Clinics
- Marketing Analytics services at Web Tonic
Frequently Asked Questions
What percentage of ecommerce stores properly track revenue in GA4?
Only 48% of GA4 ecommerce implementations track purchase events, despite 97% tracking page views. This means more than half of stores cannot attribute revenue to traffic sources, making budget allocation decisions based on incomplete data. The gap widens further with checkout funnel events — only 39% track begin_checkout and 31% track product list views.
What is the average ecommerce cart abandonment rate?
The average cart abandonment rate across all ecommerce verticals is 70.19%, based on Baymard Institute's meta-analysis of 48 studies. Mobile abandonment runs even higher at 85.65%. Automated email recovery recaptures approximately 4.64% of abandoned carts, with SMS recovery adding another 2.9%.
Do attribution platforms actually improve ROAS?
Yes. Stores using dedicated attribution platforms like Triple Whale or Northbeam report 18–25% better ROAS compared to those relying solely on platform-native analytics. The improvement comes primarily from more accurate budget reallocation between channels, not from the tools themselves driving traffic.
How big is the ecommerce analytics market?
The global ecommerce analytics market is valued at $22.4 billion in 2025 and projected to reach $58.1 billion by 2033, growing at a 12.6% CAGR. Cloud-deployed solutions account for 72% of the market, expected to reach 89% by 2033.
What ROI does AI personalization deliver for ecommerce?
AI-powered personalization delivers a 10–30% revenue lift for brands with mature analytics infrastructure. Product recommendation engines specifically drive 31% of total ecommerce revenue on sites that implement them. Brands investing more than 5% of revenue in analytics tools see a 2.4× return within 12 months.
Sources
Coherent Market Insights — E-commerce Analytics Market 2026–2033
Thunderbit — Shopping Cart Abandonment Rate: 25 Stats for 2026
Digital Applied — Google Analytics Statistics 2026: GA4 Adoption Data
Eightx — Triple Whale Adoption: Real 2026 Shopify Plus Data (74,777 stores)
VantaInsights — Ecommerce Conversion Rate 2026 Benchmarks by Industry
BestForEcommerce — AI Personalization Benchmarks
ObserviX — Ecommerce Analytics: The Complete 2026 Guide


