Table of contents

U.S. retail e-commerce sales reached USD 340.2 billion in the second quarter of 2026, 17.1% of total retail sales, according to the Census Bureau. Full-year 2025 e-commerce totaled roughly USD 1.234 trillion, but the growth rate behind that number has been falling for four straight years.
Key Takeaways
- Q2 2026 U.S. e-commerce sales were USD 340.2 billion, up 3.8% from Q1 2026.
- E-commerce was 17.1% of total retail sales in Q2 2026 on a seasonally adjusted basis.
- Full-year 2025 e-commerce totaled USD 1,233.7 billion, up 5.4% from 2024.
- That 5.4% was the second-slowest annual growth rate on record.
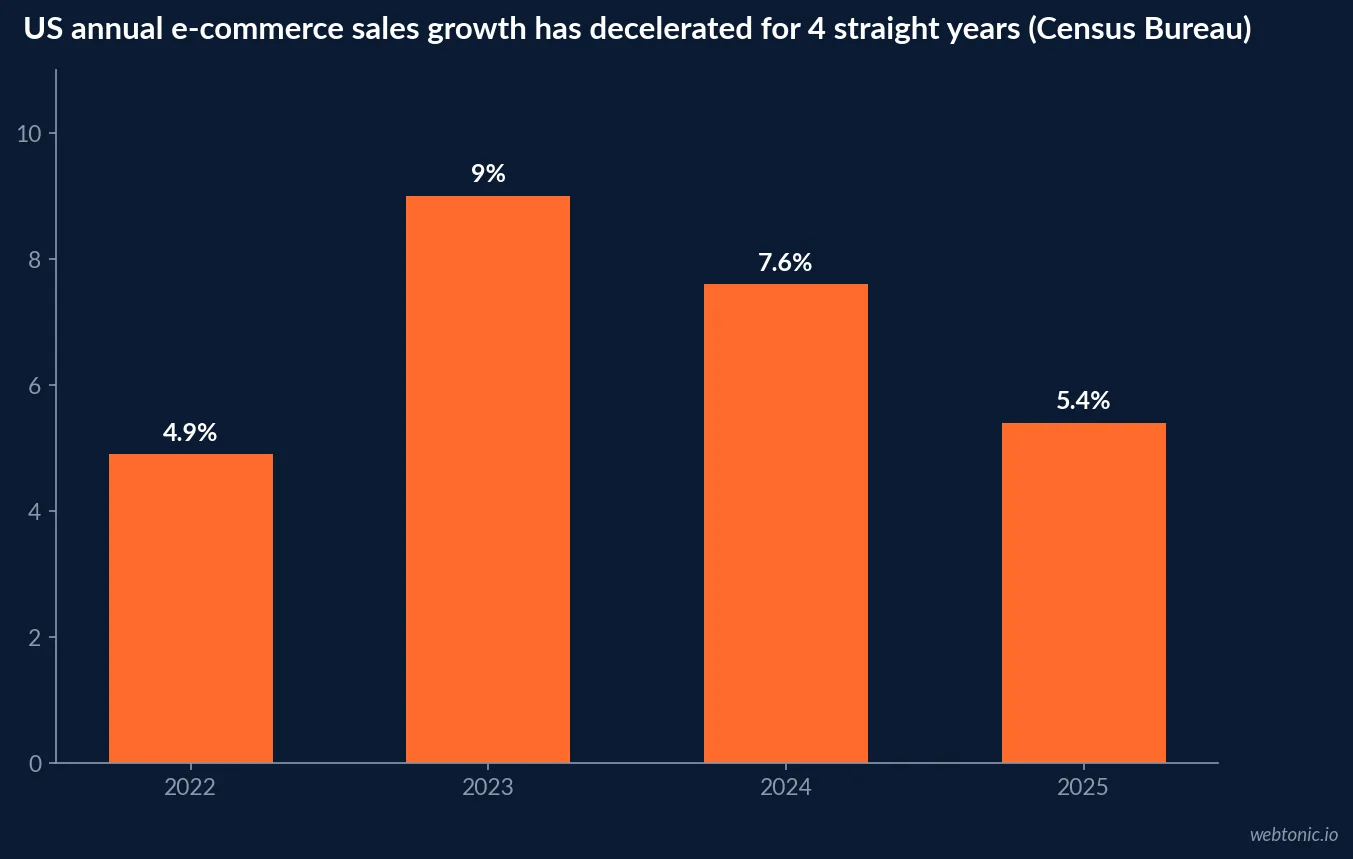
- Annual growth has decelerated for four straight years: 4.9%, 9.0%, 7.6%, 5.4%.
- Total 2025 retail sales reached USD 5,339 billion, up 4.0% from 2024.
- Digital Commerce 360 puts 2025's online share at 23.1% under its own methodology.
- Q4 2025 e-commerce sales exceeded USD 350 billion in a single quarter for the first time.
- Amazon is projected to account for 40.5% of U.S. e-commerce sales in 2025, per eMarketer.
- Mobile commerce reached 44.6% of U.S. e-commerce sales in 2025, up from 42.4% in 2023.
- Mobile drove 66.5% of online sales on Christmas Day 2025, a new record.
- Buy Now, Pay Later drove USD 7.1 billion in October 2025 spend alone, up 7.6% YoY.
- Adobe recorded a record USD 257.8 billion spent online over the 2025 holiday season.
- NRF forecasts 2026 total retail sales growth of 4.4%, to USD 5.6 trillion.
- Deloitte forecasts 2026 holiday e-commerce of USD 316.1-318.9 billion, up 7.5-8.4%.
- The average online cart abandonment rate is 70.22%, per Baymard Institute.
How big is U.S. e-commerce right now
The Census Bureau's Quarterly Retail E-Commerce Sales report put second-quarter 2026 e-commerce, adjusted for seasonal variation, at USD 340.2 billion, up 3.8% from the first quarter. Total retail sales for the quarter were USD 1,986.5 billion, up 2.9% quarter over quarter and 6.7% year over year. On that adjusted basis, e-commerce accounted for 17.1% of total retail sales; on a not-adjusted basis, the same quarter's share was 16.4%.
Zoom out to the full year and the number gets bigger and slower at the same time: the Census Bureau's Q4 2025 historical release put full-year 2025 e-commerce sales at USD 1,233.7 billion, up 5.4% from 2024, with 2025's share of total sales at 16.4% for the year.
| Period | E-commerce sales | QoQ / YoY change | Share of total retail | Source |
|---|---|---|---|---|
| Q2 2026 (seasonally adjusted) | USD 340.2B | +3.8% QoQ, +12.2% YoY | 17.1% | Census Bureau |
| Q2 2026 (not adjusted) | USD 329.5B | +9.4% QoQ, +12.4% YoY | 16.4% | Census Bureau |
| Full year 2025 | USD 1,233.7B | +5.4% YoY | 16.4% | Census Bureau |
| Full year 2025 (DC360 basis) | ~USD 1.234T | +5.4% YoY | 23.1% | Digital Commerce 360 |
| Q4 2025 | >USD 350B | 16.6% of quarter's sales | 16.6% | Digital Commerce 360 |
Why the growth rate keeps sliding
Digital Commerce 360's analysis of Commerce Department data shows online sales growth decelerating every year since the post-pandemic peak: 4.9% in 2022, 9.0% in 2023, 7.6% in 2024 and 5.4% in 2025. That last figure is the second-slowest year-over-year rate since the Commerce Department began tracking e-commerce, behind only 2022. 2025 is also one of just six years on record where growth stayed under double digits, alongside 2008 (3.8%) and 2009 (2.8%) during the Great Recession.
The dollar total keeps climbing even as the growth rate falls, because e-commerce sales have never once declined year over year in the Commerce Department's data - the only declines on record were two quarters in 2009. Total retail sales, for context, reached USD 5,339 billion in 2025, up 4.0% from USD 5,134 billion in 2024.
| Year | Annual e-commerce growth (YoY) | Context |
|---|---|---|
| 2020 | 42.0% | Pandemic-driven spike, one of only two years above 30% |
| 2022 | 4.9% | Slowest year on record until 2025 |
| 2023 | 9.0% | Rebound year, still single-digit |
| 2024 | 7.6% | Continued deceleration |
| 2025 | 5.4% | Second-slowest year on record |
Why the “share of retail” number moves depending on who you ask
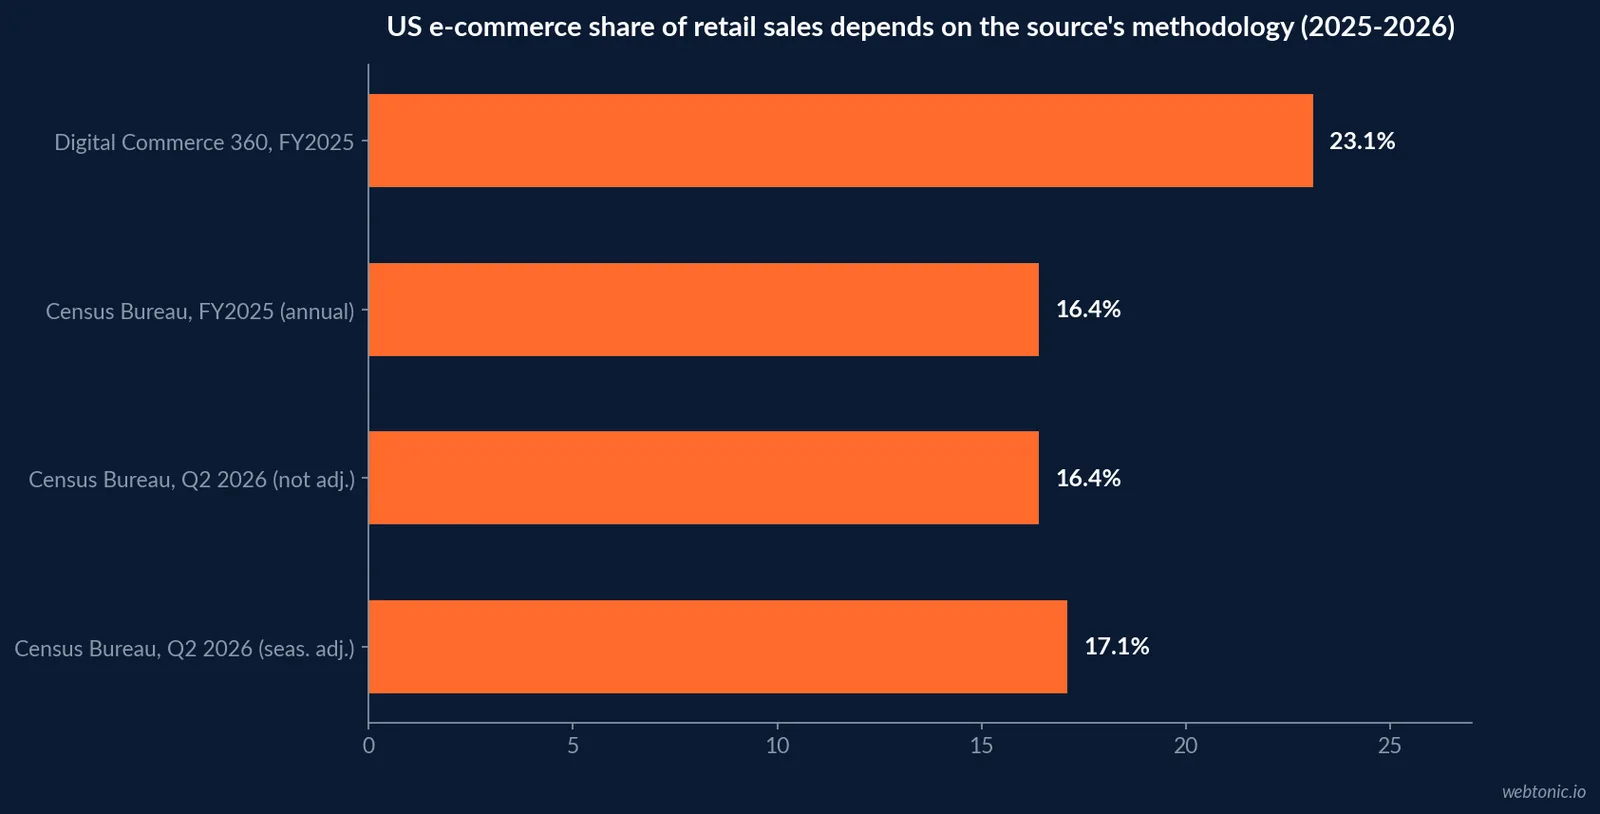
Three credible sources publish three different e-commerce shares for overlapping periods, and the gap is entirely methodological. The Census Bureau's seasonally adjusted series puts Q2 2026 online sales at 17.1% of total retail; its own not-adjusted series for the identical quarter reads 16.4%. Digital Commerce 360 reported a full-year 2025 online share of 23.1%, nearly seven points above the Census annual figure, because its retail base excludes categories like gasoline stations, motor vehicle and parts dealers, and restaurants that pull the Census Bureau's broader "total retail sales" denominator down. Anyone quoting a single "e-commerce is X% of retail" line without naming the denominator is quoting an incomplete number.
| Source | Metric basis | 2025/2026 figure | What's excluded or included |
|---|---|---|---|
| Census Bureau (SA) | Total retail sales, seasonally adjusted | 17.1% (Q2 2026) | Broadest base: autos, gas, restaurants included |
| Census Bureau (NSA) | Total retail sales, not adjusted | 16.4% (Q2 2026) | Same base, no seasonal smoothing |
| Census Bureau, annual | Full-year total retail sales | 16.4% (2025) | Full calendar year, broad base |
| Digital Commerce 360 | Narrower retail base | 23.1% (2025) | Excludes autos, gas stations, restaurants |
Who is actually selling it: Amazon and the long tail
eMarketer forecasts Amazon will account for 40.5% of U.S. e-commerce sales in 2025, continuing a slow, steady climb in share. That leaves nearly 60% of a USD 1.2 trillion-plus market split among every other retailer, marketplace and direct-to-consumer brand selling online - which is the actual opportunity most Web Tonic clients are competing inside, not the headline Amazon number.
Mobile has taken over checkout
eMarketer's tracking put mobile commerce at 44.6% of U.S. retail e-commerce sales in 2025, up from 42.4% in 2023. Adobe's real-time holiday data shows mobile going even further at peak shopping moments: mobile drove 66.5% of online sales on Christmas Day 2025 (up from 65% in 2024) and 61.6% on Thanksgiving Day (up from 59.3%). Desktop is no longer the default checkout screen for anyone selling seasonally.
Payment behavior is shifting alongside the device. Adobe reported USD 7.1 billion in Buy Now, Pay Later spend in October 2025 alone, up 7.6% year over year, and October online spend overall hit USD 88.7 billion, up 8.2% YoY, with mobile taking a 51.4% share of that month's spend.
| Mobile & payment metric | 2025 figure | Prior period | Source |
|---|---|---|---|
| Mobile share of full-year e-commerce | 44.6% | 42.4% (2023) | eMarketer |
| Mobile share, Christmas Day | 66.5% | 65.0% (2024) | Adobe |
| Mobile share, Thanksgiving Day | 61.6% | 59.3% (2024) | Adobe |
| Mobile share, October spend | 51.4% | - | Adobe |
| BNPL spend, October 2025 | USD 7.1B | +7.6% YoY | Adobe |
The 2025 holiday season set records - and 2026 is forecast to grow faster
Adobe's holiday tracking recorded a record USD 257.8 billion spent online between November 1 and December 31, 2025, up 6.8% year over year - the first quarter-trillion-dollar holiday season Adobe has measured. Looking ahead, Deloitte's 2026 holiday forecast projects e-commerce sales of USD 316.1 billion to USD 318.9 billion for the 2026 season, up 7.5% to 8.4% year over year - notably faster than the 4.0% to 4.8% growth forecast for total holiday retail sales of USD 1.70 to 1.71 trillion.
NRF's 2026 annual forecast puts total U.S. retail sales growth at 4.4%, to USD 5.6 trillion, against a 10-year average of 3.6% excluding the pandemic years - a modestly above-trend year for retail generally, with e-commerce still expected to outgrow the store channel by a wide margin.
| 2025/2026 holiday metric | Figure | Change | Source |
|---|---|---|---|
| 2025 holiday online spend (Nov 1-Dec 31) | USD 257.8B | +6.8% YoY | Adobe |
| 2026 holiday e-commerce forecast | USD 316.1-318.9B | +7.5% to 8.4% YoY | Deloitte |
| 2026 total holiday retail forecast | USD 1.70-1.71T | +4.0% to 4.8% YoY | Deloitte |
| 2026 full-year retail forecast | USD 5.6T | +4.4% YoY | NRF |
Cart abandonment is still the tax on every campaign
No matter how the acquisition side performs, checkout keeps leaking revenue. Baymard Institute's aggregate of 50 published studies puts the average online cart abandonment rate at 70.22% - meaning roughly seven of every ten filled carts never convert. For a market spending USD 340 billion in a single quarter, closing even a few points of that gap is worth more than most acquisition budgets.
A smaller growth rate, a bigger dollar number
A slowing percentage is not the same as a shrinking market. Full-year e-commerce sales rose from USD 1.170 trillion in 2024 to USD 1.234 trillion in 2025 - a 5.4% increase that still added roughly USD 64 billion in new online spend in a single year, more in absolute dollars than the entire e-commerce market of many mid-sized economies. Budget owners reading "growth is decelerating" as "the market is getting less attractive" are drawing the wrong conclusion from a true statement: the base is now large enough that even single-digit growth moves tens of billions of dollars.
Where a retailer's own numbers should diverge from the national average
Every figure above is a national aggregate across every category and seller size. A DTC apparel brand, a B2B supplier and a marketplace-only seller will each see a different slice of the 44.6% mobile share, the 17.1% retail share and the 70.22% cart abandonment average, because none of those figures is broken out by vertical in the sources cited here. Treat the numbers on this page as the macro backdrop for a plan, not a substitute for a store's own analytics - which is exactly the gap our data and analytics practice and Google Ads management team are built to close.
What this means for U.S. e-commerce teams
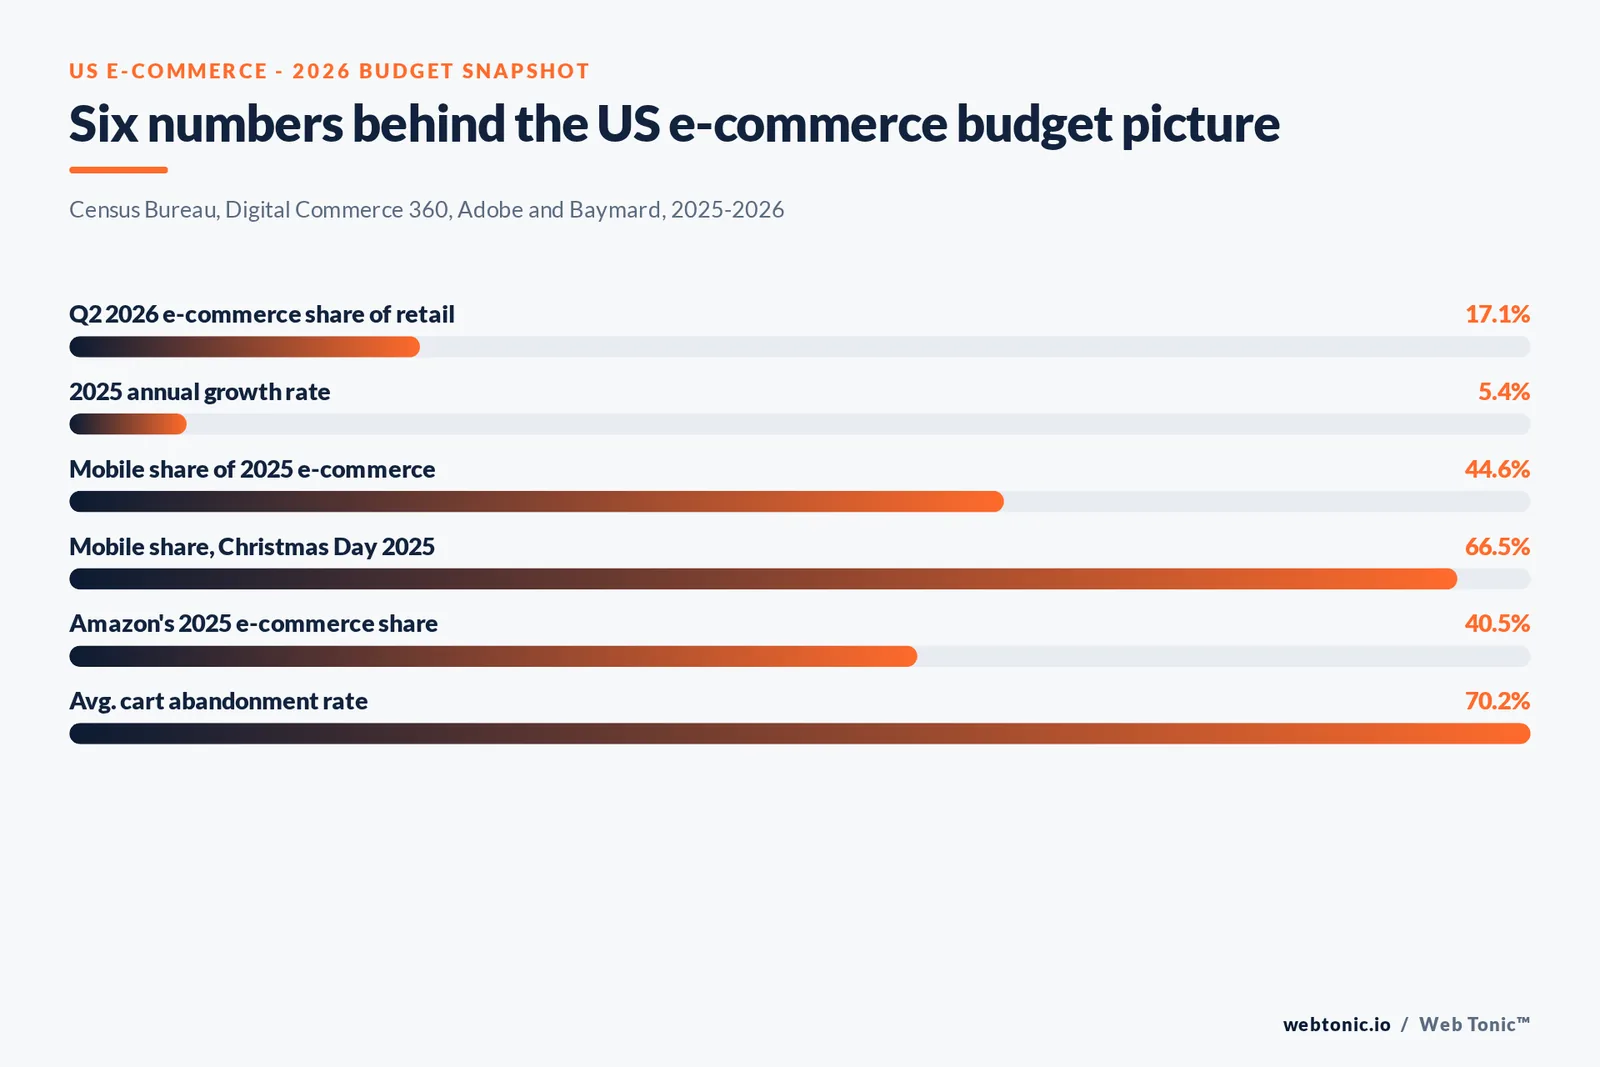
Three numbers should drive next year's plan: growth is slowing (5.4% in 2025, the second-slowest on record), mobile is now the majority checkout surface at peak moments (66.5% on Christmas Day), and the holiday window is forecast to grow faster than the rest of the year (7.5-8.4% for 2026). That argues for shifting budget toward mobile checkout experience and holiday-specific campaigns rather than assuming the broad market lift will carry a flat plan. Our growth marketing practice builds channel plans against exactly this kind of decelerating-but-still- growing market, and our breakdown of what paid search costs in 2026 is a useful companion for budgeting the acquisition side of that plan.
Frequently Asked Questions
How big is U.S. e-commerce in 2026?
The Census Bureau put second-quarter 2026 retail e-commerce sales, seasonally adjusted, at USD 340.2 billion, 17.1% of USD 1,986.5 billion in total retail sales for the quarter. For the full year 2025, the Commerce Department's total was USD 1,233.7 billion, and Digital Commerce 360's own analysis puts the figure at roughly USD 1.234 trillion, 5.4% more than 2024's USD 1.170 trillion.
Why do different sources report different e-commerce shares?
Because they measure different things. The Census Bureau's seasonally adjusted series put Q2 2026 e-commerce at 17.1% of total retail sales, its not-adjusted series put the same quarter at 16.4%, and Digital Commerce 360 reported 23.1% for full-year 2025 because its methodology excludes categories such as gasoline stations, motor vehicle dealers and restaurants that other retail totals include. None of the three numbers is wrong; they answer different questions.
Is U.S. e-commerce growth slowing down?
Yes, for four straight years. Digital Commerce 360's analysis of Commerce Department data shows annual e-commerce growth of 4.9% in 2022, 9.0% in 2023, 7.6% in 2024 and 5.4% in 2025 - the second-slowest year on record behind only 2022, and one of just six years since tracking began that growth stayed under double digits.
How much of U.S. online shopping now happens on a phone?
eMarketer put mobile commerce at 44.6% of U.S. retail e-commerce sales in 2025, up from 42.4% in 2023. Adobe's holiday tracking pushed that further at peak moments: mobile drove 66.5% of online sales on Christmas Day 2025 and 61.6% on Thanksgiving Day, both records for those dates.
What should a retailer budget for going into the 2026 holiday season?
Deloitte's 2026 holiday forecast projects e-commerce sales of USD 316.1 billion to USD 318.9 billion for November 2026 through January 2027, up 7.5% to 8.4% year over year, faster than the 4.0% to 4.8% growth expected for total holiday retail. Cart abandonment stays the constant drag: Baymard Institute's aggregate of 50 studies puts the average online cart abandonment rate at 70.22%.
Sources
U.S. Census Bureau - Quarterly Retail E-Commerce Sales, Q2 2026
U.S. Census Bureau - Quarterly Retail E-Commerce Sales, Q4 2025 (annual data)
Digital Commerce 360 - 2025 U.S. ecommerce sales mark 4th straight year of single-digit growth
Digital Commerce 360 - Ecommerce accounts for 25% of total retail sales in Q4 2025
eMarketer - Amazon will account for 40.5% of U.S. e-commerce sales in 2025
Adobe - 2025 Holiday Shopping Season report
National Retail Federation - 2026 retail sales forecast
Deloitte - 2026 holiday retail sales forecast
Baymard Institute - Cart abandonment rate statistics