



Table of contents
E-commerce email marketing in 2026 is dominated by a single insight: automation generates 30% of all email revenue from just 2% of total sends. The brands winning the inbox are not sending more — they are sending smarter, at the moment a shopper is most likely to buy.
This report compiles 70+ verified e-commerce email marketing statistics from Omnisend (150,000 brands), Klaviyo (183,000+ customers), CustomersAI (619 brands, 740M emails), and other authoritative sources to show what is actually working in the channel.
Key Takeaways
- Automated email flows earn 16× more revenue per send than scheduled campaigns, representing just 2% of volume but driving 30% of total email revenue (Omnisend, 2026).
- Abandoned cart emails generate $5.64 revenue per recipient on average — the highest-yielding single automation in e-commerce — with top 10% performers reaching $28.89 RPR (Klaviyo, 2025).
- Click-to-conversion jumped 53% YoY, rising from 5.9% to 9.0%, meaning fewer shoppers click but those who do are far more likely to buy (Omnisend, 2026).
- Email open rates climbed to 30.7% across e-commerce — the fifth consecutive year of increases — while click-to-open rates continued declining (Omnisend, 2026).
- Brands with click rates above 10% generate 20× more revenue per email than those below 2%, making engagement efficiency the single strongest predictor of email ROI (CustomersAI, 2026).
- SMS click rates more than doubled YoY, while push notification automation conversion rates surged to 22.9% (Omnisend, 2026).
- AI product recommendations lift click rates to 3.75% on average (8.79% for top performers), confirming that personalization has a material revenue impact on automated flows (Klaviyo, 2026).
| Metric | E-commerce Average | Top 10% Performers | Source |
|---|---|---|---|
| Open Rate | 30.7% | 45%+ | Omnisend, 2026 |
| Click Rate (Campaign) | 1.69% | 4.5%+ | Klaviyo, 2026 |
| Click Rate (Flows) | 5.58% | 10%+ | Klaviyo, 2026 |
| Click-to-Conversion | 9.0% | 16.5% (UK) | Omnisend, 2026 |
| Revenue per Recipient (Cart) | $5.64 | $28.89 | Klaviyo, 2025 |
| Revenue per Recipient (Campaign) | $0.14 | $0.97 | CustomersAI, 2026 |
| Automation Share of Revenue | 30% | 41%+ | Omnisend/Klaviyo, 2026 |
| SMS Conversion Rate | 22.9% (push auto.) | — | Omnisend, 2026 |
Email Open Rates and Engagement Trends
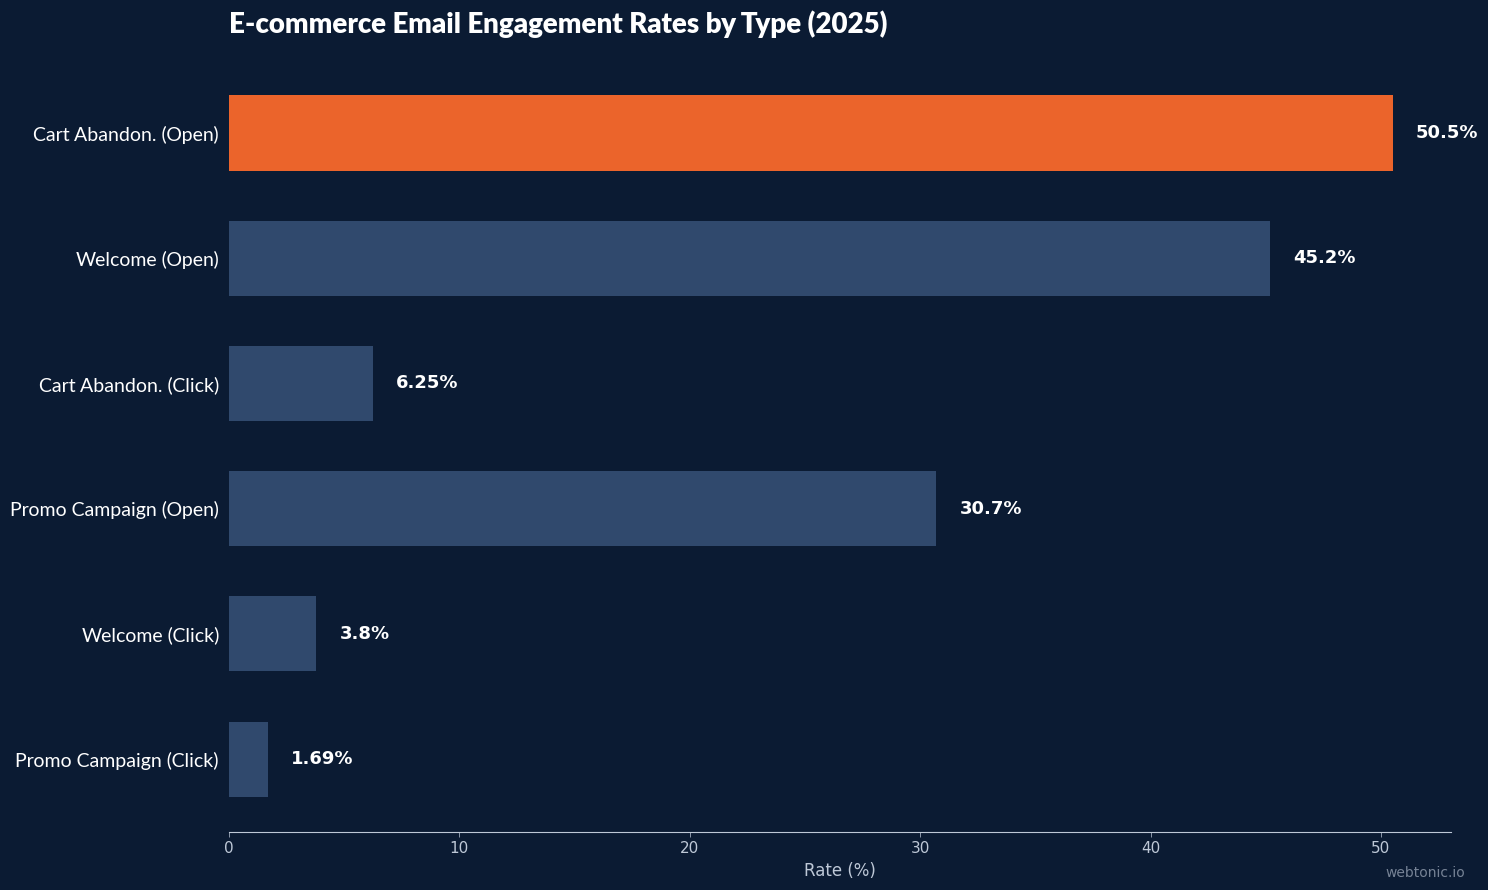
E-commerce email open rates have now risen for five consecutive years, climbing from 26.6% in 2024 to 30.7% in 2025. That trend sounds positive in isolation — but context matters. Both click-to-open and click-to-send rates declined simultaneously, meaning more emails are opened but proportionally fewer generate action (Omnisend, 2026).
The divergence is partly explained by Apple Mail Privacy Protection and Gmail's inbox categorization, which inflate open counts. The real engagement signal has shifted to click-to-conversion, which jumped 53% YoY to 9.0%. Shoppers click less, but when they do, they buy at dramatically higher rates (Omnisend, 2026).
That pattern intensified in Q4 2025: engagement dropped but average order value nearly doubled compared to other quarters. High-intent shoppers did not need repeated nudges — when they engaged, they purchased more and at higher price points.
Geographic variation is significant. The UK leads with a 16.54% click-to-conversion rate, followed by Australia at 12.25% and South Africa at 11.8%. U.S. rates sit closer to 8.5%, suggesting that data-driven segmentation strategies in smaller markets may outperform volume-based approaches in larger ones.
Automation vs. Campaign Performance
The most consequential finding in the 2026 data is how dramatically automated flows outperform scheduled campaigns on every revenue metric.
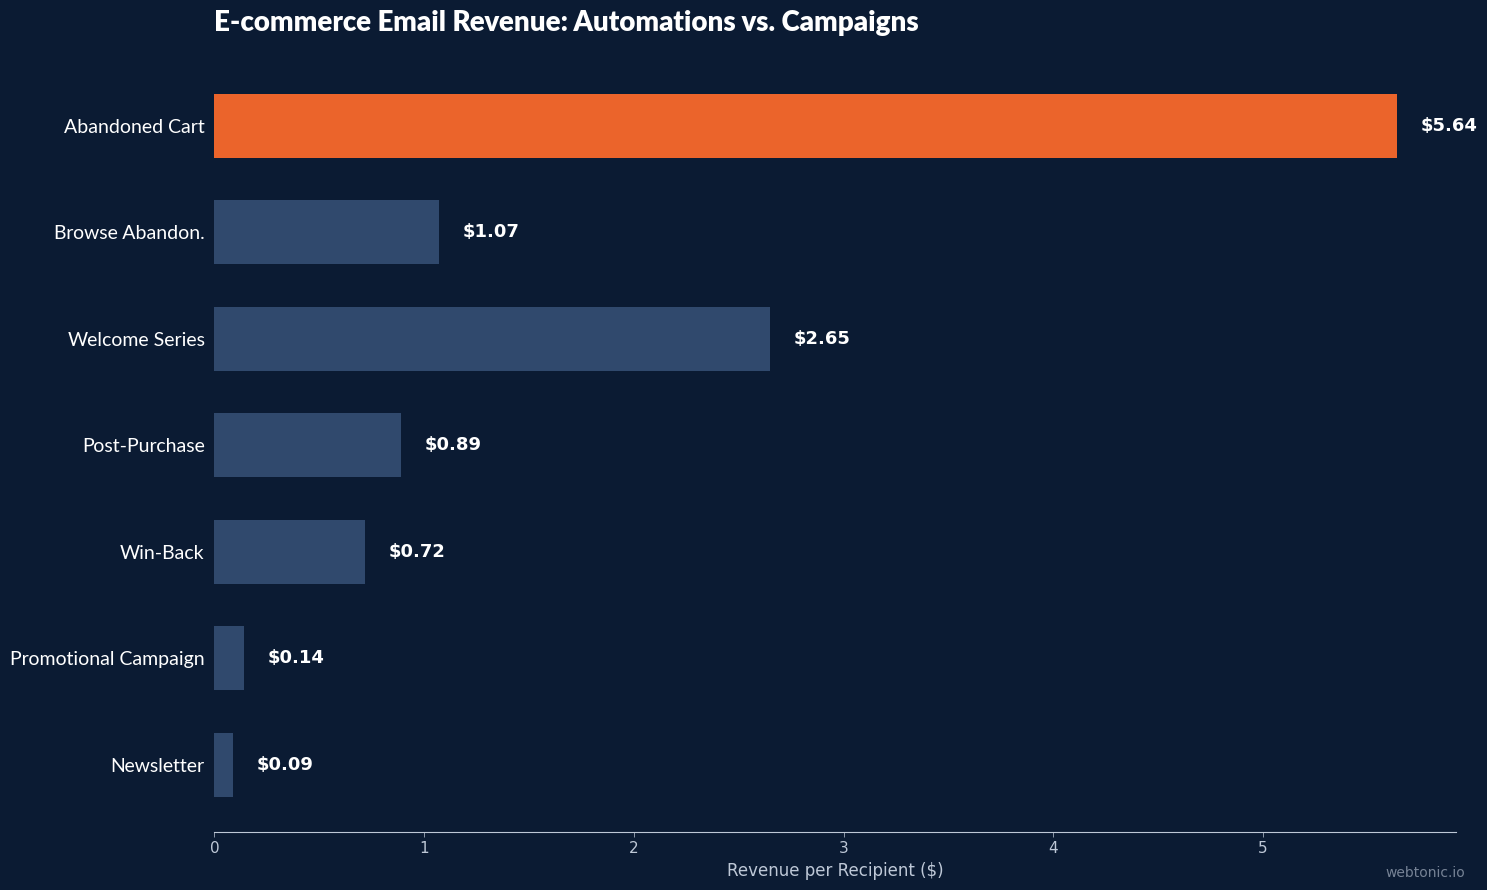
Across Omnisend's 150,000-brand dataset, automations represented just 2% of total email volume but generated 30% of revenue, earning 16× more per send than campaigns. Klaviyo's data tells a similar story: flows generate 41% of total email revenue from just 5.3% of sends, with revenue per recipient nearly 18× higher than campaigns (Klaviyo, 2026).
Yet most brands underutilize this channel. According to CustomersAI's analysis of 619 DTC brands, only 24% of brands generate more than 17% of their revenue from flows. The majority still rely on promotional campaigns for the bulk of email revenue — leaving the highest-ROI lever underworked (CustomersAI, 2026).
Flow click rates average 5.58% vs. 1.69% for campaigns, and placed-order rates are 13× higher on flows. The takeaway is clear: scaling email marketing performance in e-commerce is primarily an automation challenge, not a list-size challenge.
| Flow Type | Avg. RPR | Top 10% RPR | Avg. Click Rate | Avg. Conversion Rate |
|---|---|---|---|---|
| Abandoned Cart | $5.64 | $28.89 | 6.25% | 3.33% |
| Welcome Series | $2.65 | $18.50 | 3.80% | 2.10% |
| Browse Abandonment | $1.07 | $7.21 | 2.90% | 1.40% |
| Post-Purchase | $0.89 | $5.40 | 3.20% | 0.95% |
| Win-Back | $0.72 | $4.80 | 2.10% | 0.65% |
| Promotional Campaign | $0.14 | $0.97 | 1.69% | 0.26% |
Abandoned Cart Recovery Statistics
Cart abandonment remains e-commerce's largest recoverable revenue leak. The average abandonment rate holds at 69.99% across the industry, meaning roughly 7 in 10 shoppers who add an item to their cart leave without completing the purchase (Baymard Institute, 2025).
Recovery email sequences are the primary mitigation tool. A standard 3-email abandoned cart sequence recovers 12–22% of abandoned carts depending on store size and product category, with larger stores ($5M+ annual revenue) consistently achieving higher recovery rates due to brand recognition and trust (US Tech Automations, 2026).
The ROI is stark. For a $1M/year e-commerce store, a fully configured abandonment automation costs $300–$800/month and generates $8,000–$20,000/month in recovered revenue — a 10–40× return. Abandoned cart emails on Klaviyo average a 50.5% open rate and 3.33% placed-order rate, with top-decile performers hitting 65.34% opens and 7.69% conversion (Peak Digital, 2025).
According to the Baymard Institute, e-commerce stores lose an estimated $260 billion in recoverable revenue annually to cart abandonment. The optimized checkout improvement and recovery automation combined can increase conversion rate by 35.26%.
AI and Personalization Impact on Email Revenue
Personalization has moved from a best-practice recommendation to a measurable revenue driver. Klaviyo's 2026 benchmark data shows that AI-powered product recommendations lift email click rates to 3.75% on average — and 8.79% for top-performing brands — while driving materially higher revenue per recipient (Klaviyo, 2026).
Behavioral triggers compound the effect. Emails triggered by specific shopper actions (browse, cart add, purchase history) convert at 4× the rate of broadcast campaigns, according to Forrester Research. The combination of behavioral timing and AI-driven product selection represents the highest-ROI email strategy available to e-commerce operators in 2026.
CustomersAI's analysis reinforces this: elite performers with high engagement and high efficiency achieve conversion rates 8.4× higher than lower-performing brands. The defining factor is not list size or send frequency — it is the sophistication of segmentation and content relevance within automated flows.
SMS and Push Notification Benchmarks
Email is no longer the only owned-channel contender. SMS click rates more than doubled YoY in 2025, positioning text messaging as the highest-intent mobile communication channel for e-commerce brands (Omnisend, 2026).
Push notification automations reached a 22.9% conversion rate — the highest of any triggered messaging format. Unlike email, push notifications bypass inbox competition entirely, reaching opted-in shoppers at the device level. For growth marketing strategies focused on retention and repeat purchase, push represents a high-efficiency channel with minimal incremental cost.
The all-in investment for an e-commerce SMS program ranges from $50–$200/month on per-message pricing, making it one of the most cost-efficient channels when measured against downstream revenue. Combined with email automation, SMS and push create a multi-channel owned-media stack that reduces dependence on paid acquisition.
| Channel | Avg. Click Rate | Conversion Rate | Revenue Trend (YoY) | Cost Range |
|---|---|---|---|---|
| Email (Automated) | 5.58% | 3.33% (cart) | ↑ RPR +18× | $100–$600/mo (ESP) |
| Email (Campaign) | 1.69% | 0.26% | ↑ Open +15% | Included in ESP |
| SMS | 2× YoY growth | 11.92% (overall) | ↑ Rapidly growing | $50–$200/mo |
| Push Notifications | High (device-level) | 22.9% (auto.) | ↑ Surging | Minimal incremental |
Revenue per Email and List Size Economics
One of the most counter-intuitive findings in the 2026 data is that bigger email lists do not correlate with higher revenue per email. CustomersAI's analysis of 619 DTC brands found that mid-size lists produce the highest click rates — a sweet spot where lists are large enough to be meaningful but still well-maintained.
The top 25% of brands by revenue efficiency generate $0.97 revenue per email with an average list size of 21,641. Compare that to the high-volume segment (top 25% by list size): $0.19 revenue per email with lists averaging 166,527. That is a 5× revenue efficiency gap driven entirely by engagement quality (CustomersAI, 2026).
The relationship between click rate and revenue is the strongest correlation in the dataset. Brands crossing the 6% click-rate threshold enter a performance tier where revenue per email scales non-linearly. Below 2%, the economics of email barely justify send costs.
For e-commerce operators, this data makes a clear case: list hygiene and engagement optimization produce higher returns than list growth. A well-segmented list of 20,000 active subscribers can outperform a poorly maintained list of 200,000 on total revenue.
E-commerce Email Marketing by Vertical
Performance varies significantly by product category. The vertical benchmarks below help e-commerce marketers set realistic targets calibrated to their specific industry rather than relying on cross-industry averages.
| Vertical | Avg. Open Rate | Avg. Click Rate | RPR (Flows) | Key Insight |
|---|---|---|---|---|
| Fashion & Apparel | 28.4% | 1.52% | $2.80 | Seasonal peaks drive 40%+ of annual flow revenue |
| Health & Beauty | 32.1% | 1.89% | $3.40 | Replenishment flows have highest repeat-purchase lift |
| Food & Beverage | 35.6% | 2.15% | $1.90 | Highest open rates; lower AOV limits RPR |
| Home & Garden | 29.8% | 1.61% | $4.20 | Highest RPR due to high AOV products |
| Electronics | 26.3% | 1.35% | $3.10 | Research-heavy; longer consideration cycles |
| Pet Products | 33.8% | 2.05% | $2.60 | Strong subscription/auto-replenish adoption |
Related reading
- Cold Email vs Outbound Sales: 2026 E-Commerce Data
- What E-Commerce Managers Should Budget for Marketing Automation in 2026
- E-Commerce SMS Marketing, by the Numbers (2026)
- Email Marketing services at Web Tonic
FAQ
What is a good email open rate for e-commerce in 2026?
The average e-commerce email open rate is 30.7% as of 2025 data (Omnisend, 2026). However, open rates are increasingly unreliable as a standalone metric due to Apple Mail Privacy Protection inflating counts. A more meaningful benchmark is click-to-conversion rate, which averaged 9.0% across e-commerce in 2025 — up 53% year-over-year. Focus on click rate (1.69% campaign, 5.58% flow average) and revenue per recipient as primary performance indicators.
How much revenue can abandoned cart emails recover?
A standard 3-email abandoned cart sequence recovers 12–22% of abandoned carts on average. For a $1M/year e-commerce store, this translates to $8,000–$20,000/month in recovered revenue at an all-in cost of $300–$800/month (10–40× ROI). Top-decile performers on Klaviyo achieve $28.89 revenue per recipient on cart recovery flows, compared to the $5.64 average.
Are email automations really better than campaigns for e-commerce?
Yes — and the gap is dramatic. Automated flows generate 16–18× more revenue per send than scheduled campaigns, representing just 2% of email volume but 30–41% of total email revenue (Omnisend and Klaviyo, 2026). Flow click rates average 5.58% vs. 1.69% for campaigns, and placed-order rates are 13× higher. Despite this, only 24% of DTC brands generate more than 17% of their revenue from flows, indicating massive untapped potential.
How does SMS compare to email for e-commerce marketing?
SMS is emerging as a critical complement to email. SMS click rates more than doubled year-over-year in 2025, while push notification automation conversion rates reached 22.9% (Omnisend, 2026). The overall conversion rate for SMS across e-commerce is 11.92% — the highest of any marketing channel. Email remains the revenue workhorse due to scale and automation maturity, but SMS excels as a high-intent, low-frequency trigger channel.
What is the ROI of e-commerce email marketing?
The commonly cited $36–$42 ROI per dollar spent on email marketing holds for e-commerce specifically, with top-performing merchants achieving $79 per dollar on automated flows. The key driver is efficiency, not volume: brands with click rates above 10% generate 20× more revenue per email than those below 2%. Engagement quality — driven by segmentation, personalization, and behavioral automation — is the single strongest predictor of email marketing ROI.
Sources
Omnisend — 2026 Ecommerce Marketing Report
Klaviyo — 2026 Email Marketing Benchmarks by Industry
CustomersAI — 2026 Klaviyo Email Marketing Benchmark Report
Omnisend — Email Marketing Benchmarks 2026
Peak Digital — Abandonment Email Benchmarks 2025
US Tech Automations — Cart Abandonment Email ROI Analysis 2026
Baymard Institute — Cart Abandonment Rate Statistics


