



Table of contents
Ad creative is the single largest performance lever for ecommerce brands running paid media in 2026. Below are the latest statistics on creative formats, testing cadence, fatigue benchmarks, and ROAS data across Meta, Google, and TikTok — drawn from platform reports and agency benchmarks covering thousands of ecommerce advertisers.
Key Takeaways
- Advantage+ Shopping Campaigns now represent 62% of ecommerce conversion spend on Meta, up from 34% in 2024, making creative quality the primary differentiator (MHI Growth Engine).
- Video ads generate 20–40% higher conversion rates than static images for products requiring demonstration, while static ads deliver 40–60% lower CPMs (MHI Growth Engine).
- Meta's Advantage+ Catalog Ads produce 38% lower CPAs for top DTC brands compared to standard dynamic product ads (Ecommerce Times).
- High-volume creative refresh (15–50+ new variants per month) extends campaign life 3–5× and is the dominant strategy for brands spending $10K+ monthly on paid social (Prestyj 2026).
- UGC-style creatives outperform polished brand content by 27% on CTR and 19% on conversion rate for DTC ecommerce on Meta (Motion 2026 Benchmarks).
- Average ecommerce Meta Ads ROAS sits at 2.8–4.2× depending on vertical, with beauty and supplements leading at 4.0–4.2× and electronics trailing at 2.1–2.8× (AdLibrary 2026).
- Brands testing 10+ creative concepts per month see 31% lower CPA compared to those testing fewer than 5 (Motion Creative Benchmarks 2026).
Ad Format Performance: Video vs. Static vs. Carousel
Choosing the right creative format directly impacts both media efficiency and conversion volume. MHI Growth Engine's 2026 analysis across DTC ecommerce brands reveals a nuanced format landscape where no single type dominates every metric.
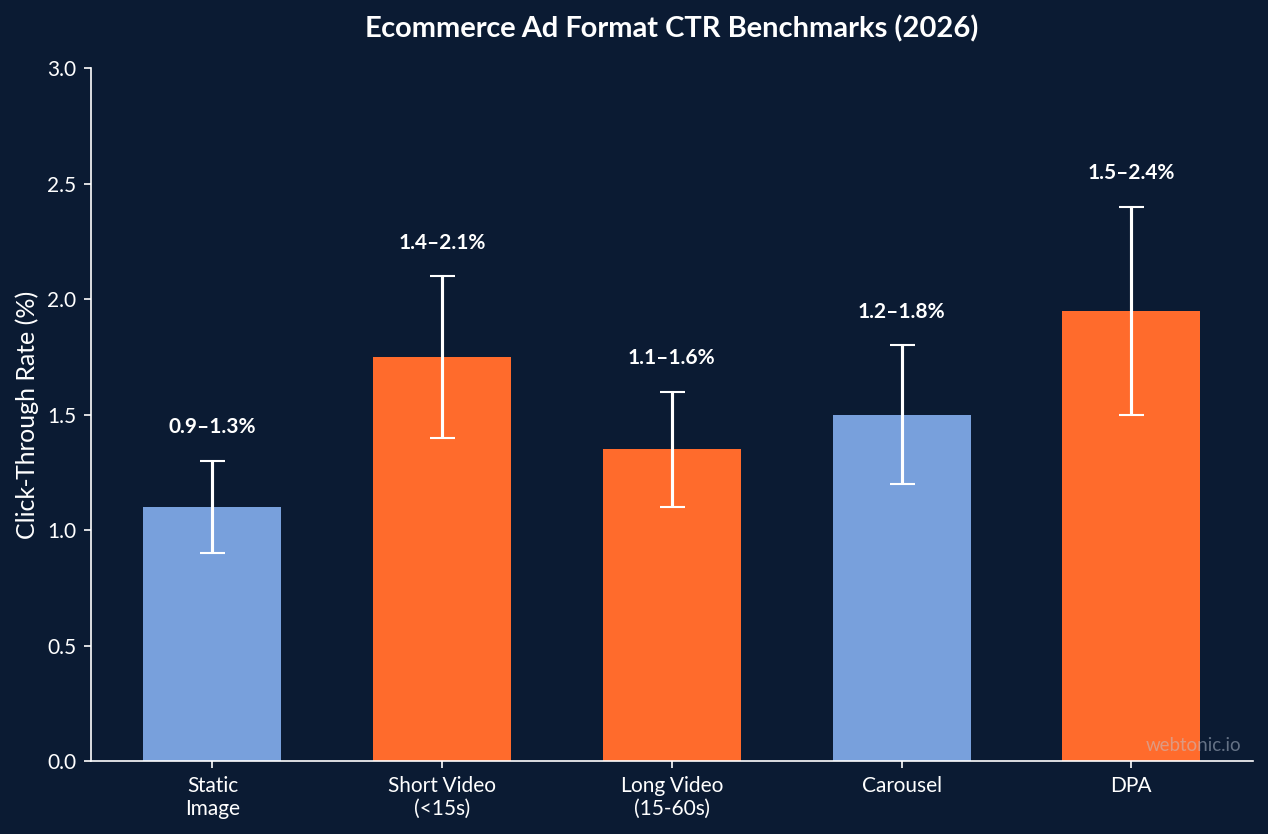
| Format | Avg. CTR | Avg. CPM | Conv. Rate Lift | Best Use Case |
|---|---|---|---|---|
| Static Image | 0.9–1.3% | $8–$14 | Baseline | Price-led offers, retargeting |
| Short-Form Video (<15s) | 1.4–2.1% | $12–$22 | +20–40% | Product demos, UGC hooks |
| Long-Form Video (15–60s) | 1.1–1.6% | $14–$26 | +15–30% | Storytelling, testimonials |
| Carousel | 1.2–1.8% | $9–$16 | +10–22% | Multi-product, features |
| Dynamic Product (DPA) | 1.5–2.4% | $7–$12 | +25–45% | Retargeting, catalog sales |
Short-form video under 15 seconds dominates prospecting campaigns, but static images remain cost-efficient for retargeting where purchase intent already exists. The highest-performing ecommerce accounts run a mix of 3–4 formats simultaneously, rotating based on funnel stage.
Creative Testing Volume and CPA Impact
The Motion Creative Benchmarks 2026 report analyzed creative output across thousands of ecommerce advertisers and found a direct relationship between testing velocity and cost efficiency.
- Brands testing 10+ creative concepts per month achieve 31% lower CPA than those testing fewer than 5 concepts.
- The median ecommerce brand produces 8 new ad creatives per week, up from 4.5 per week in 2024.
- Top-quartile performers produce 22+ unique creatives weekly, leveraging batch production, AI-assisted variations, and modular creative systems.
- Creative accounts for 70% of campaign performance variance on Meta — more than audience targeting, bidding, or budget allocation combined.
- The average winning ad rate across batch video testing is 12–18% for ecommerce, meaning 82–88% of creatives tested never scale (Prestyj 2026).
This data reinforces why performance creative production at volume matters more than any single hero ad concept. The economics of paid social now require treating creative as a continuous production line, not a campaign-based deliverable.
Creative Fatigue Benchmarks by Ecommerce Vertical
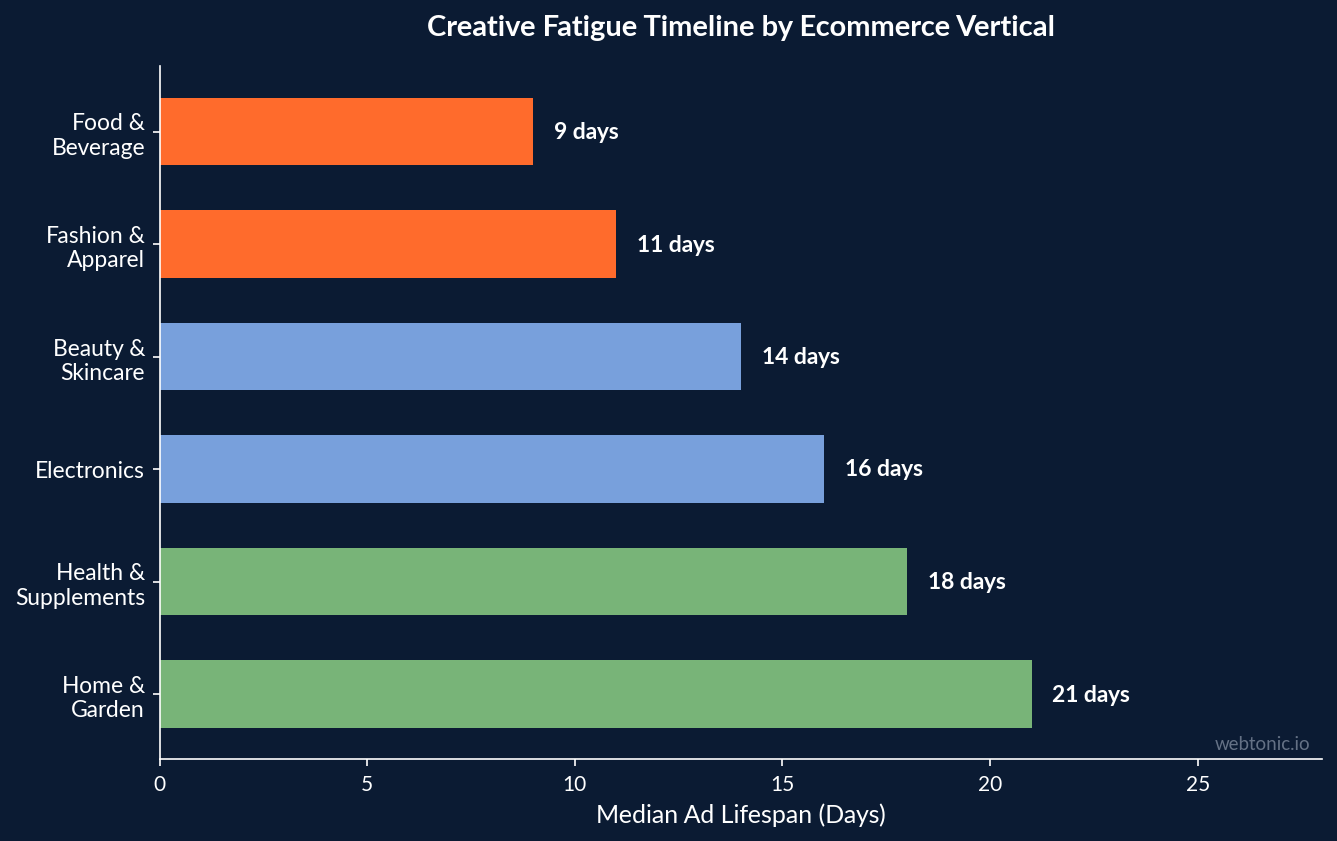
Creative fatigue — when ad performance degrades due to audience oversaturation — is the primary threat to ecommerce campaign longevity. Prestyj's 2026 industry benchmarks show fatigue timelines vary significantly by vertical.
| Ecommerce Vertical | Median Ad Lifespan | Fatigue Signal (CTR Drop) | Refresh Cadence |
|---|---|---|---|
| Fashion & Apparel | 11 days | –35% CTR | Weekly |
| Beauty & Skincare | 14 days | –28% CTR | Bi-weekly |
| Health & Supplements | 18 days | –22% CTR | Bi-weekly |
| Home & Garden | 21 days | –19% CTR | Monthly |
| Electronics | 16 days | –31% CTR | Bi-weekly |
| Food & Beverage | 9 days | –40% CTR | Weekly |
Fashion and food/beverage verticals face the most aggressive fatigue cycles. Food and beverage ads lose 40% of their click-through rate in just 9 days, demanding constant creative replenishment. Brands running 15–50+ new variants per month extend campaign life 3–5× compared to those refreshing quarterly.
Advantage+ and Dynamic Creative Performance
Meta's Advantage+ suite has fundamentally restructured ecommerce advertising in 2026. Ecommerce Times reported that Advantage+ Catalog Ads deliver 38% lower CPAs for top DTC brands. Additional Advantage+ data points:
- Advantage+ Shopping Campaigns represent 62% of ecommerce conversion spend on Meta, up from 34% in 2024 (MHI Growth Engine).
- Creative diversity requirements increased — Meta now favors accounts running 5–10+ active creatives per ad set to maximize Advantage+ optimization.
- Dynamic Product Ads (DPA) with enhanced catalog creative deliver 2.1× ROAS compared to standard catalog templates.
- Advantage+ audience expansion drives 22% of conversions from net-new customers that manual targeting would have excluded.
- Brands feeding Advantage+ with UGC-style product videos see 34% better cost per acquisition than those relying on studio photography alone.
ROAS Benchmarks by Ecommerce Vertical
AdLibrary's 2026 ecommerce benchmarks segment Meta Ads performance by vertical, revealing wide ROAS ranges that inform creative strategy priorities.
| Vertical | Avg. ROAS | Avg. CPA | Top Creative Format |
|---|---|---|---|
| Beauty & Skincare | 4.0–4.2× | $18–$28 | UGC video + carousel |
| Health & Supplements | 3.8–4.1× | $22–$35 | Testimonial video |
| Fashion & Apparel | 3.2–3.8× | $15–$25 | Lifestyle carousel |
| Home & Garden | 3.0–3.5× | $28–$42 | Before/after static |
| Electronics | 2.1–2.8× | $35–$55 | Product demo video |
| Food & Beverage | 3.4–3.9× | $12–$20 | Recipe/unboxing UGC |
Beauty and supplements lead ROAS rankings because their high margins and repeat-purchase economics amplify the lifetime value behind each acquisition. Electronics lags due to longer purchase cycles and lower repeat rates. These ROAS gaps should inform media budget allocation across verticals.
UGC and Creator-Led Creative Statistics
User-generated content has moved from a testing tactic to a core creative pillar for ecommerce brands. Data from the Motion 2026 Benchmarks and platform-specific studies shows:
- UGC-style creatives outperform polished brand content by 27% on CTR and 19% on conversion rate for DTC brands on Meta (Motion 2026).
- 73% of ecommerce brands now allocate at least 30% of their creative budget to UGC, up from 41% in 2024.
- Creator-led ads with face-to-camera hooks achieve 2.3× higher hold rates (15-second view rate) compared to product-only ads.
- Average UGC production cost: $150–$500 per asset, compared to $800–$3,000 for professional studio creative.
- TikTok Shop ads using creator content deliver 45% higher conversion rates than brand-produced content in the same product category (D2C Times).
- The optimal mix is 60% UGC / 40% branded for prospecting, inverting to 40% UGC / 60% branded for retargeting where trust signals matter more (Benly Q1 2026).
Creative Production Costs and Efficiency
The economics of ecommerce creative production have shifted dramatically toward volume and speed. Brands that maintain a competitive creative output without inflating costs gain a structural advantage in auction-based ad platforms:
- Static ad production cost: $50–$200 per asset — the most cost-efficient format for testing messaging angles before committing to video.
- Professional video production: $800–$3,000 per asset, with AI-assisted editing tools reducing post-production time by 40% (Motion 2026).
- Batch video production (5–10 variations from one shoot): $200–$600 per asset, combining studio efficiency with testing volume.
- AI-generated ad variations cost $5–$25 per asset but currently underperform human-created content by 15–20% on conversion rate.
- The marketing efficiency ratio (MER) benchmark for ecommerce is 3.0–5.0×, with creative-intensive brands achieving the upper range by maximizing winner identification speed (MHI Growth Engine).
Understanding these cost structures helps ecommerce brands allocate their growth marketing budgets between creative production and media spend — the optimal ratio has shifted from 80/20 (media/creative) to approximately 65/35 in 2026.
Google Ads Creative Benchmarks for Ecommerce
While Meta dominates ecommerce creative conversations, Google Ads creative plays a critical role in search and Shopping campaigns:
- Performance Max asset groups with 15+ unique assets deliver 22% more conversions than minimum-asset groups (Google internal data).
- Ecommerce Google Ads average CTR: 2.8–4.1% for Shopping and 3.2–5.7% for branded search (WordStream 2026).
- Product feed images with lifestyle context see 18% higher CTR than plain white-background shots in Shopping campaigns.
- Responsive Search Ads with 10+ headline variations achieve 14% better conversion rates than those with the minimum 3 headlines.
- Video assets in Performance Max campaigns increase reach by 35% by unlocking YouTube and Discover inventory.
Platform-Specific Creative Specifications
Each advertising platform enforces different creative requirements that directly impact production workflows. Ecommerce brands that pre-optimize assets for each platform avoid costly reformatting and performance degradation from improperly cropped or resized creatives:
- Meta Feed: 1:1 or 4:5 aspect ratio performs best, with 4:5 generating 12% higher engagement by occupying more screen real estate on mobile devices.
- Meta Stories/Reels: 9:16 vertical video with text-safe zones — ads without proper safe zones see 23% lower completion rates due to UI overlay obstruction.
- Google Shopping: minimum 800×800 product images, with lifestyle-context images driving 18% higher CTR than standard white-background shots.
- TikTok: 9:16 native vertical, first 3 seconds critical — ads that hook within 2 seconds have 41% higher completion rates and 28% better conversion rates.
- Multi-platform creative adaptation adds 15–25% to production costs but delivers 30–40% better performance than one-size-fits-all repurposing.
For brands managing creative across platforms, using a centralized performance dashboard reduces the time between identifying a winning concept and scaling it cross-platform from an average of 5 days to under 24 hours.
Related reading
- E-Commerce Video Marketing Statistics: ROI, Conversions & Trends (2026)
- Locksmith Ad Creative Statistics — 2026 Benchmarks & Industry Data
- Ad Creative in the Manufacturing Industry: 2026 Statistics Roundup
- Branding services at Web Tonic
Frequently Asked Questions
How many ad creatives should an ecommerce brand test per month?
Data from the Motion 2026 Creative Benchmarks shows brands testing 10+ creative concepts per month achieve 31% lower CPA than those testing fewer than 5. Top-quartile performers produce 22+ unique creatives weekly. The optimal approach combines batch production with systematic angle testing, expecting only 12–18% of creatives to become scalable winners.
What is the best ad format for ecommerce in 2026?
No single format dominates all metrics. Short-form video under 15 seconds delivers 20–40% higher conversion rates for product demonstrations, while Dynamic Product Ads achieve the highest ROAS at 2.1× over standard catalog templates. The highest-performing accounts use a mix of 3–4 formats rotated by funnel stage, with UGC video for prospecting and catalog ads for retargeting.
How quickly do ecommerce ads experience fatigue?
Creative fatigue timelines vary by vertical. Fashion ads fatigue in 11 days, food and beverage in just 9 days, while home and garden ads last up to 21 days. Brands running 15–50+ new variants per month extend campaign life 3–5× compared to those refreshing quarterly. The primary fatigue signal is a 20–40% CTR decline from the ad's peak performance.
Does UGC actually outperform professional creative?
For DTC ecommerce prospecting, yes. UGC-style creatives outperform polished brand content by 27% on CTR and 19% on conversion rate on Meta. However, branded content performs better in retargeting where trust signals matter. The optimal allocation is 60% UGC / 40% branded for prospecting, inverting for retargeting audiences.
What ROAS should ecommerce brands expect from Meta Ads?
Average ecommerce ROAS on Meta ranges from 2.1× to 4.2× depending on vertical. Beauty and supplements lead at 4.0–4.2×, while electronics trails at 2.1–2.8×. Brands using Advantage+ Catalog Ads see 38% lower CPAs, and those running creative-diverse campaigns (10+ concepts/month) consistently outperform the vertical averages.
Sources
MHI Growth Engine — Static Ads vs. Video Ads for DTC Ecommerce (2026)
MHI Growth Engine — Meta Ads Benchmarks for Ecommerce 2026
Motion — Creative Benchmarks 2026
Prestyj — Creative Fatigue Statistics by Industry 2026
Ecommerce Times — Advantage+ Catalog Ads: 38% Lower CPAs
AdLibrary — Meta Ad Benchmarks Ecommerce 2026
Benly — E-commerce & Retail Creative DNA Benchmarks Q1 2026
D2C Times — TikTok Shop Creator Content Performance


