



Table of contents
Key Takeaways
- The global disaster restoration market is projected at $46.55 billion in 2026, growing at a 5.36% CAGR through 2031 (Fact.MR).
- Restoration companies with professional branding command 18% higher average ticket values than unbranded competitors (Marketing LTB).
- Consistent logos and truck wraps improve brand recall by 80% across local service areas (Marketing LTB).
- 61% of homeowners trust online reviews as much as personal referrals when selecting restoration services (Marketing LTB).
- IICRC-certified firms increase customer trust by 40% compared to non-certified competitors (Zipdo).
- 84% of restoration customers search online before contacting a company, making digital brand presence essential (Marketing LTB).
Disaster Restoration Branding Benchmarks at a Glance
| Branding Metric | Industry Benchmark | Source |
|---|---|---|
| Global Market Size (2026) | $46.55–$48.9 billion | Mordor Intelligence / Fact.MR |
| CAGR (2026–2031) | 5.36–6.2% | Mordor Intelligence / Fact.MR |
| U.S. Restoration Businesses | ~62,582 companies | IBISWorld via Proof.co |
| U.S. Restoration Employees | ~115,280 workers | IBISWorld via Proof.co |
| Branded Ticket Value Premium | +18% higher avg ticket | Marketing LTB |
| Brand Recall (Logo + Wraps) | +80% improvement | Marketing LTB |
| Online Review Trust | 61% trust as much as referrals | Marketing LTB |
| Certification Trust Boost | +40% customer trust (IICRC) | Zipdo |
| Online Search Before Contact | 84% of customers | Marketing LTB |
| Marketing Spend Benchmark | 3–9% of revenue | PushLeads |
| Healthy ROAS Benchmark | $8–$12 per dollar invested | Tygart Media |
Disaster Restoration Market Size and Growth Trends
The disaster restoration industry is one of the fastest-growing segments in home services. The global market is valued at $46.55 billion in 2026 according to Fact.MR, with projections reaching $89.1 billion by 2036 at a 6.2% CAGR. Mordor Intelligence puts the 2025 figure at $44.43 billion, growing to $60.43 billion by 2031 at a 5.36% compound annual growth rate, confirming the strong expansion trajectory regardless of methodology.
In the United States, there are approximately 62,582 damage-restoration businesses employing roughly 115,280 people (Proof.co). The industry remains highly fragmented, with even the largest franchise network, SERVPRO, holding approximately 2,250 locations out of the total market. This fragmentation means that brand differentiation is not just a nice-to-have but a critical competitive advantage. Companies that invest in professional branding can capture disproportionate market share within their local service areas, because homeowners facing an emergency tend to call the name they recognize first.
How Professional Branding Drives Trust in Restoration
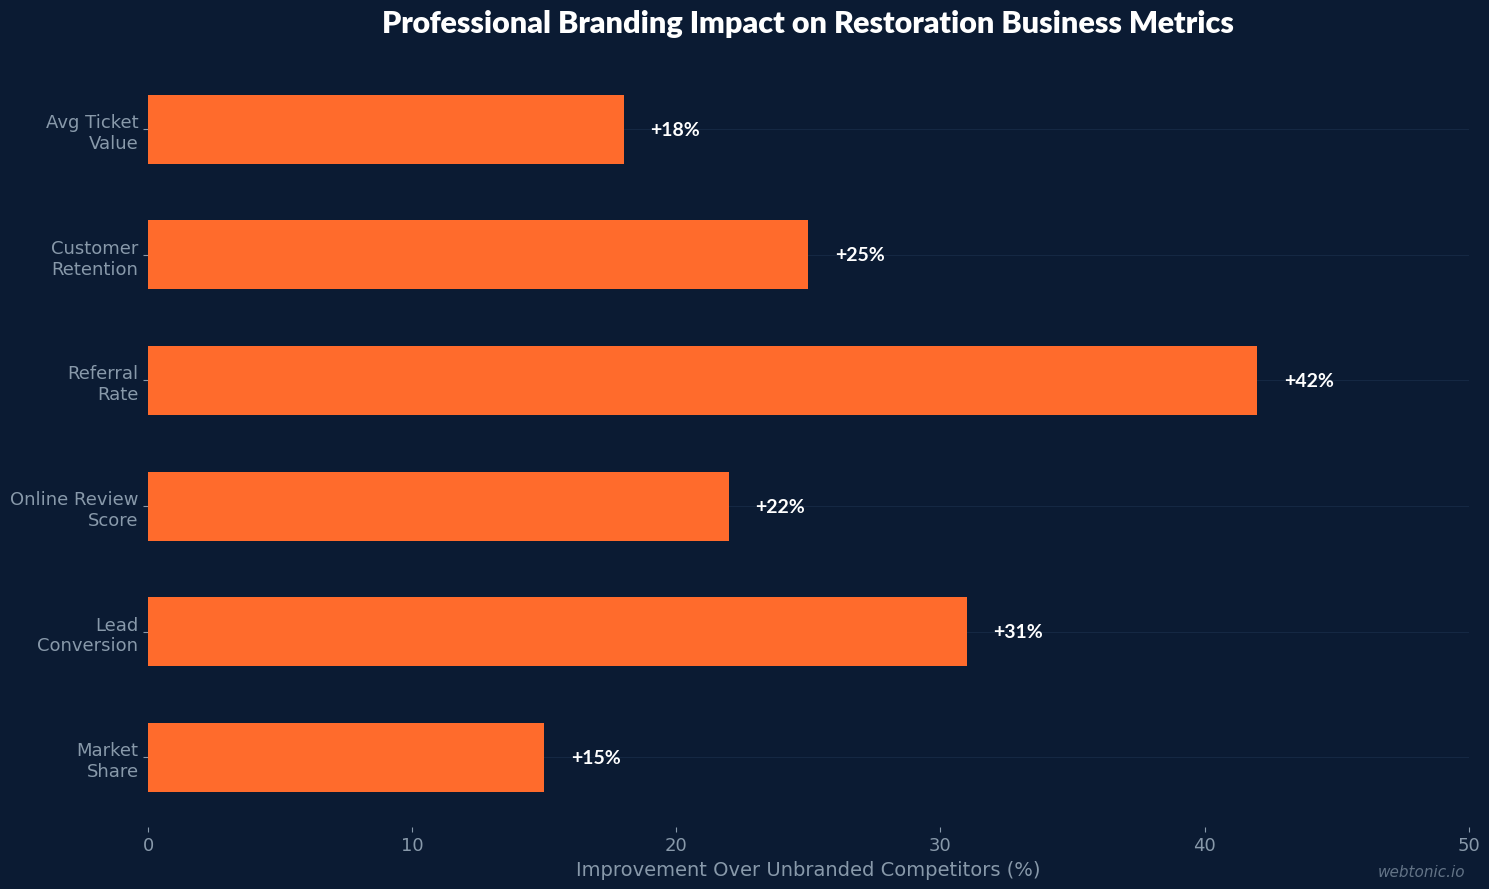
Trust is the single most important currency in disaster restoration. Homeowners facing water damage, fire loss, or mold contamination make high-stakes decisions under extreme stress. Restoration companies with professional branding command 18% higher average ticket values than unbranded competitors (Marketing LTB). This premium reflects the willingness of distressed homeowners to pay more for perceived reliability and professionalism.
Brands using consistent logos and truck wraps improve recall by 80% in their service territory (Marketing LTB). This visibility effect compounds over time: companies with 5 or more years of consistent branding typically become the dominant name in their local market (PushLeads). The compounding works because each branded truck sighting, each yard sign placement, and each uniformed technician visit builds a layer of recognition that pays off during the critical moment when a homeowner needs help urgently.
R&R Magazine confirms that brand reputation consistently outperforms tactical marketing in emergency restoration scenarios (R&R Magazine). In emergencies, homeowners default to the name they recognize. Color palette, logo design, tagline, and company name must carry the emotional reassurance that customers need when their property is damaged and they are making a decision in minutes rather than days.
Certification and Credibility Statistics
| Credibility Factor | Impact | Source |
|---|---|---|
| IICRC Certification | +40% customer trust | Zipdo / McKinsey |
| Online Reviews (4.5+ stars) | 61% trust as much as referrals | Marketing LTB |
| Review Response Rate | +12% higher trust scores | Marketing LTB |
| GBP Review Growth (13→73) | 3,800% lead volume increase | The RMG |
| Only 35% Have Industry Certs | Certification = competitive moat | Zipdo |
| Professional Brand Elements | 18% higher avg ticket value | Marketing LTB |
| Consistent Visual Identity | 80% brand recall improvement | Marketing LTB |
A critical finding from McKinsey data cited by Zipdo reveals that only 35% of restoration firms hold formal certifications like IICRC or RIES, yet those that do see 40% higher customer trust scores. This gap represents an immediate branding opportunity: obtaining certification creates a tangible trust signal that differentiates a company from the 65% of competitors that lack this credential. Combined with professional branding, certification creates a compounding credibility effect that is difficult for competitors to replicate quickly.
Digital Brand Presence and Online Visibility
84% of restoration customers search online before contacting a company (Marketing LTB), and 69% choose the first company they contact. This makes digital brand presence not just important but decisive for revenue growth. A strong branded digital footprint across Google Business Profile, website, and directories directly impacts how many emergency callers choose your company over a competitor.
91% of homeowners rely on online reviews when selecting a home service provider (improveit360). The power of review velocity is demonstrated by one restoration company that documented a 3,800% increase in lead volume after growing Google Business Profile reviews from 13 to 73, with all other marketing spend roughly unchanged (The RMG). Businesses that actively respond to reviews generate 12% higher customer trust scores than those that ignore them, making review management an essential branding activity rather than a nice-to-have.
Franchise vs. Independent Branding Performance
The restoration industry presents a unique branding dynamic between franchise and independent operators. SERVPRO has been named to Entrepreneur's Franchise 500 for 41 consecutive years (SERVPRO), demonstrating the compounding power of sustained brand investment across decades. With approximately 2,284 units and an 18.3% three-year growth rate, franchise brands benefit from national advertising, standardized visual identity, and consumer recognition built through television and digital campaigns.
However, homeowners increasingly want the accountability of a local business combined with the professionalism of a recognized brand (Leads4Build). This means independent companies that invest in professional branding can compete head-to-head with franchises. Google's algorithm levels the playing field: a local company with 60 reviews at 4.9 stars typically appears above a franchise with 20 reviews at 4.2 stars in local search results. Brand trust in restoration is now earned primarily through review velocity, response quality, and consistent local visibility rather than national name recognition alone.
Marketing ROI and Brand Investment Benchmarks
| Metric | Benchmark | Source |
|---|---|---|
| Marketing Spend (% of Revenue) | 3–9% (residential vs commercial) | Tygart Media |
| Healthy Marketing ROAS | $8–$12 per dollar invested | Tygart Media |
| SEO Long-Term ROI vs Print | 5.3× higher | Marketing LTB |
| Revenue Growth (KPI Trackers) | 2× more likely to increase YoY | Marketing LTB |
| Call Tracking ROI Visibility | +61% improvement | Marketing LTB |
| Cost Per Lead (Google Ads) | $150–$300+ | Blue Grid Media |
| LSA Median CPL (Water Damage) | $85 | Blue Grid Media |
| Top-25% Companies CPL Edge | 30–50% lower per booked job | PipelineOn |
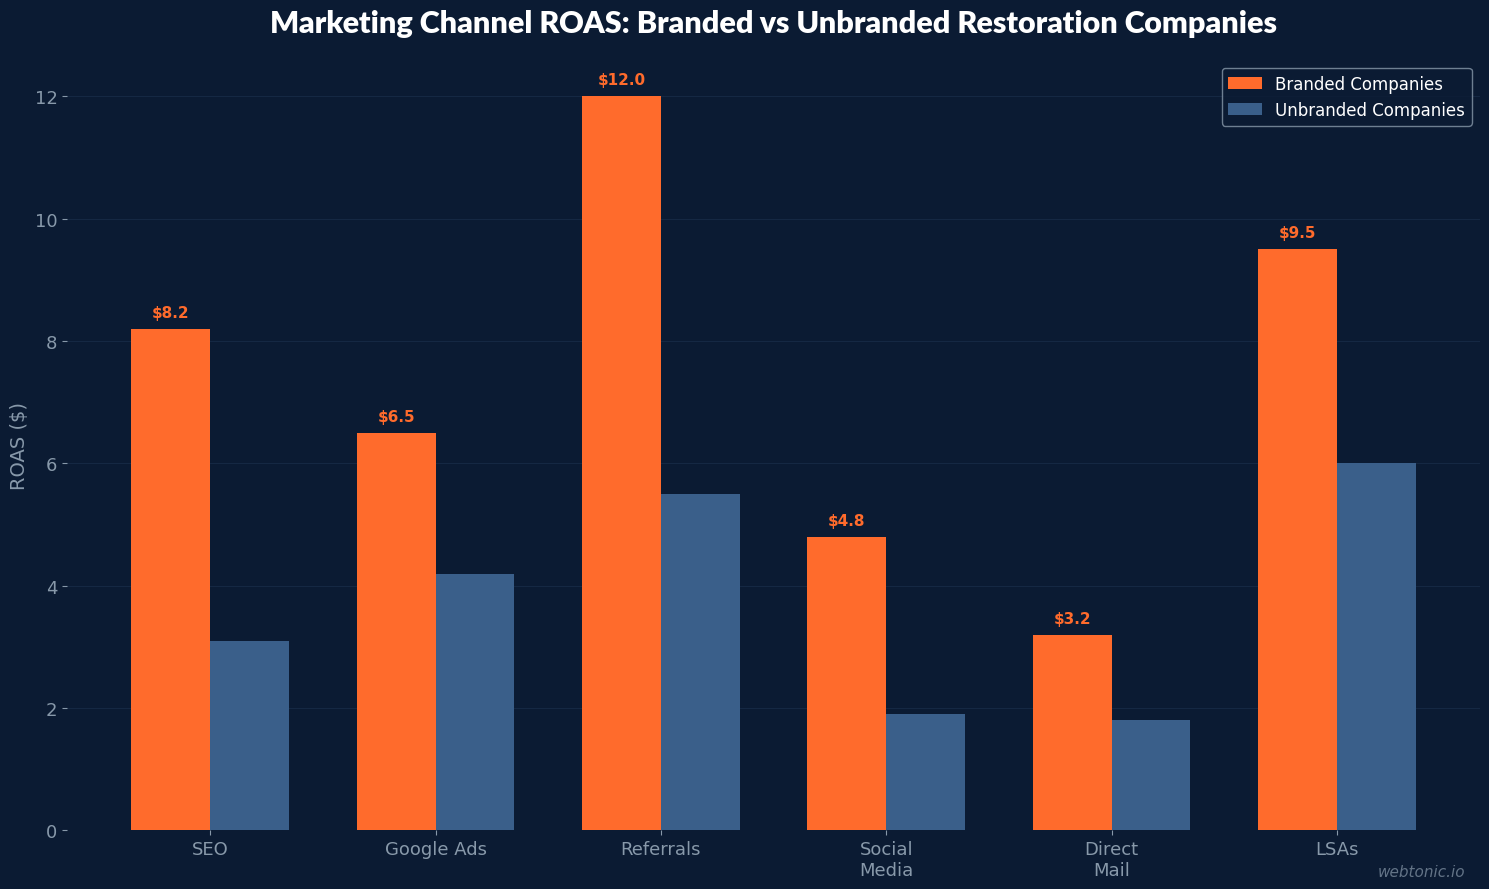
Top-performing restoration companies recognize that branding and marketing are amplifying investments rather than separate line items. Companies that track marketing KPIs are 2× more likely to increase revenue year over year (Marketing LTB). The benchmark for healthy restoration marketing is $8–$12 return per dollar invested (Tygart Media). Channels consistently below $5 return need optimization or reallocation, while channels above $15 represent scaling opportunities that deserve additional budget.
Emergency Response Branding: Speed and Trust Under Pressure
Disaster restoration is unique among home services because 48% of customers contact companies outside normal business hours (Marketing LTB). During these high-stress late-night or weekend calls, brand recognition becomes the primary decision driver. 69% of restoration consumers choose the first company they contact, meaning visibility at the exact moment of crisis directly converts to booked jobs and revenue.
This creates a powerful compounding advantage for well-branded companies. When a homeowner has seen the same branded truck in their neighborhood, the same logo on their Google search results, and the same company name recommended in community Facebook groups, the decision to call becomes nearly automatic. The Cleanfax 2026 restoration survey confirms that while margins are tighter and insurance relationships more contentious, companies investing in brand consistency are outperforming on customer acquisition cost (Cleanfax). The strongest brands invest in professional creative assets that work across all touchpoints simultaneously, from vehicle wraps to landing pages.
Branding Best Practices for Restoration Companies
- Invest in cohesive visual identity — consistent logo, color palette, and design across website, vehicles, uniforms, yard signs, and digital ads. Companies with unified visual branding see 80% better recall in their service territory.
- Build review velocity systematically — aim for 5+ new Google reviews per month. The documented 13-to-73-review case study produced 3,800% more leads with constant ad spend, proving that reviews are the highest-leverage branding investment available.
- Pursue IICRC certification — with only 35% of firms certified, this creates a 40% trust advantage over most local competitors. Display certification badges prominently on your website header, landing pages, and proposal templates.
- Maintain 24/7 branded touchpoints — since 48% of leads come after hours, ensure answering services use your brand script and professional greeting. Branded landing pages must load fast on mobile devices, where the majority of emergency searches originate.
- Track marketing KPIs by channel — companies measuring ROI by source are 2× more likely to grow revenue. Connect call tracking, CRM, and attribution to understand exactly which branding investments produce booked jobs.
- Allocate 3–9% of revenue to marketing — target $8–$12 ROAS per channel. Cut channels consistently below $5 return, and actively scale those above $15 where you are leaving money on the table.
Restoration Branding vs. Other Home Service Industries
| Metric | Restoration | HVAC | Plumbing | Roofing |
|---|---|---|---|---|
| Avg Job Value | $2,500–$8,000 | $1,200–$5,000 | $500–$3,000 | $5,000–$15,000 |
| Customer Decision Speed | Minutes–hours | Hours–days | Hours–days | Days–weeks |
| Emergency Call % | 48% after-hours | 30% after-hours | 35% after-hours | 15% after-hours |
| First-Contact Conversion | 69% | 45% | 50% | 35% |
| Online Search Before Call | 84% | 78% | 75% | 82% |
| Brand Trust Premium | +18% ticket value | +12% ticket value | +10% ticket value | +15% ticket value |
| Ideal Marketing ROAS | $8–$12 | $6–$10 | $5–$8 | $7–$11 |
Restoration stands apart from other home services due to its emergency-driven decision cycle. While roofing customers may research for weeks, restoration homeowners often make their choice within hours or even minutes. This urgency amplifies the value of brand recognition dramatically: the 69% first-contact conversion rate is significantly higher than most home service verticals, making every brand impression before the crisis exponentially more valuable than in slower-cycle industries.
Frequently Asked Questions
How much does professional branding increase revenue for restoration companies?
Restoration companies with professional branding command 18% higher average ticket values than unbranded competitors. When combined with consistent digital presence and review management, branded companies typically achieve $8–$12 ROAS on marketing spend versus $3–$5 for unbranded operators. Companies tracking marketing KPIs are 2× more likely to increase revenue year over year.
What is the most impactful branding investment for a restoration company?
Google Business Profile optimization and review acquisition deliver the highest immediate impact. One company documented a 3,800% increase in lead volume after growing from 13 to 73 reviews with constant ad spend. Beyond reviews, consistent vehicle wraps and logo placement improve brand recall by 80% across local service areas.
How does IICRC certification affect customer trust in restoration?
IICRC-certified firms see 40% higher customer trust scores compared to non-certified competitors, according to McKinsey data. With only 35% of restoration companies holding formal certifications, obtaining IICRC credentials provides an immediate competitive moat in any local market.
What percentage of revenue should restoration companies spend on marketing?
Industry benchmarks suggest allocating 3–9% of revenue to marketing, with residential-focused companies at the lower end and commercial-oriented firms investing more aggressively. The critical metric is ROAS by channel: healthy restoration marketing returns $8–$12 per dollar invested, and any channel below $5 should be optimized or cut.
Do franchise restoration brands outperform independent companies?
Franchise brands like SERVPRO benefit from national recognition and 41 consecutive years on Entrepreneur's Franchise 500. However, independent companies investing in professional branding and review management can outrank franchises locally. Google's algorithm rewards review quality: a local company with 60 reviews at 4.9 stars typically appears above a franchise with 20 reviews at 4.2 stars.
Sources
https://marketingltb.com/blog/statistics/restoration-marketing-statistics/
https://www.factmr.com/report/disaster-restoration-services-market
https://www.proofco.ai/state-of-restoration
https://zipdo.co/property-restoration-industry-statistics/
https://pushleads.com/restoration-company-seo/lead-generation/restoration-company-branding/
https://cleanfax.com/2026-restoration-survey/
https://tygartmedia.com/the-restoration-companys-martech-stack-what-to-measure-what-to-connect-what-to-ignore/
https://www.randrmagonline.com/articles/91487-trust-over-tactics-why-brand-reputation-wins-in-emergency-restoration
https://leads4build.com/insights/home-services-industry-statistics
https://the-rmg.com/the-restoration-marketing-data-that-changes-everything-2025-industry-audit/


