Table of contents
Australia's internet advertising market grew 14.0% to AUD 19.8 billion in FY26, its fastest pace in four years, according to the IAB Australia Internet Advertising Revenue Report prepared by PwC. This page breaks that figure down by channel, format and industry, then checks it against official retail-turnover data to see whether the spend is chasing real demand.
Key Takeaways
- Australia's internet ad market reached AUD 19.8 billion in FY26, up 14.0% year over year.
- That beats the market's own six-year average growth rate of 13.7%.
- Search remains the largest category at 43% of spend, AUD 8.6 billion.
- Search grew 13.2% year over year to a new financial-year record.
- Video advertising grew 18.8% to AUD 5.9 billion, now 30% of the market.
- Social video alone reached AUD 2.4 billion, up 29.5% year over year.
- Social video is now 41% of all video spend, up from 38% a year earlier.
- Connected TV took 60% of publisher video expenditure, up from 51% in FY25.
- Desktop's share of that video spend fell from 37% to 25%.
- Classifieds grew 12.6% to AUD 3.1 billion, its first double-digit year since FY22.
- Audio advertising grew 6.6% to AUD 353 million, driven by podcasting.
- Podcasting is now 40% of total audio ad spend.
- Non-video display advertising rose 6.9% to AUD 2.2 billion.
- The top 5 industries account for 56% of display spend: Retail, Automotive, Entertainment & Media, Finance, FMCG.
- Retail leads industry spend share at 17.8%, up from 17.2%.
- Australian retail turnover rose 1.2% in June 2025, per the ABS's final Retail Trade release.
The FY26 headline: fastest growth in four years
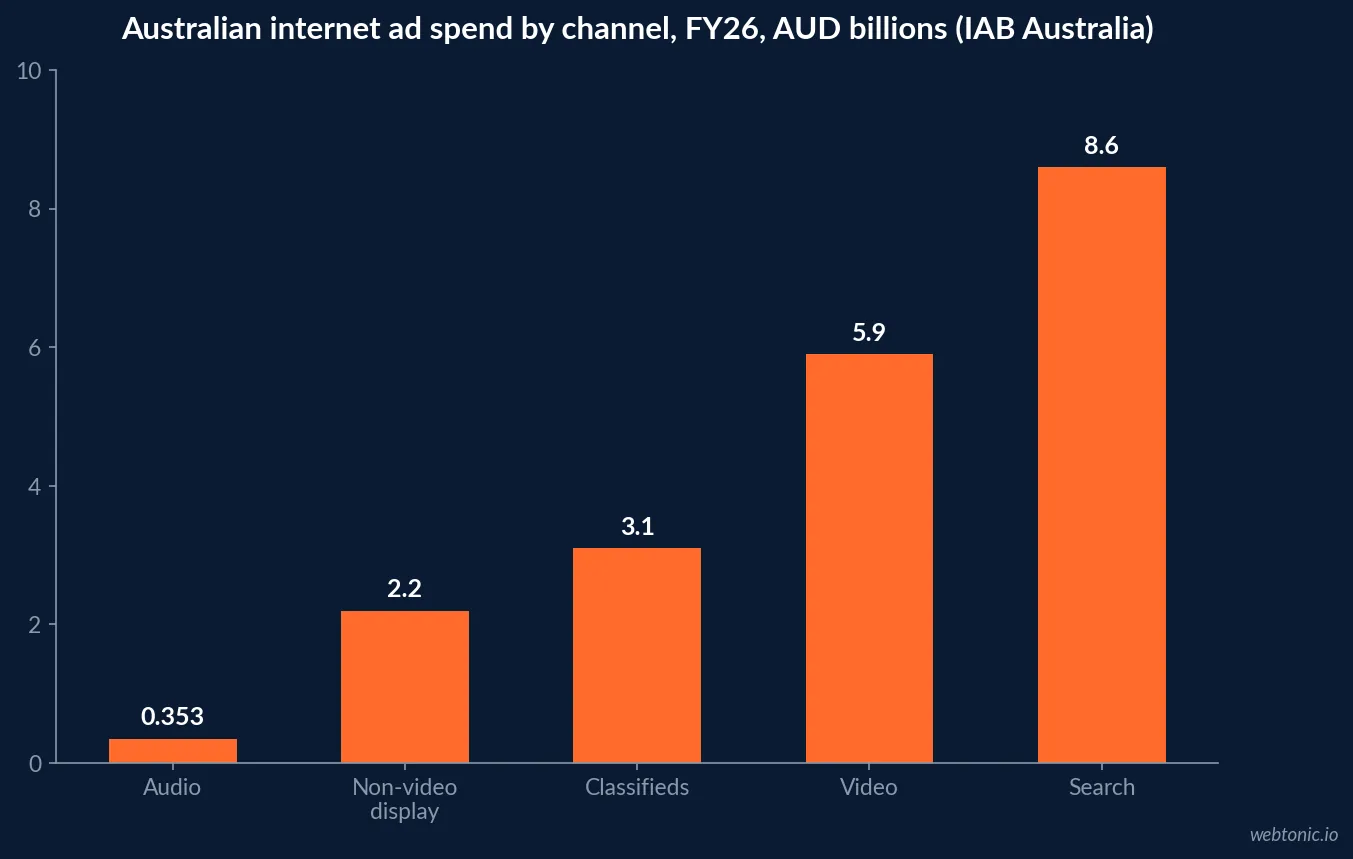
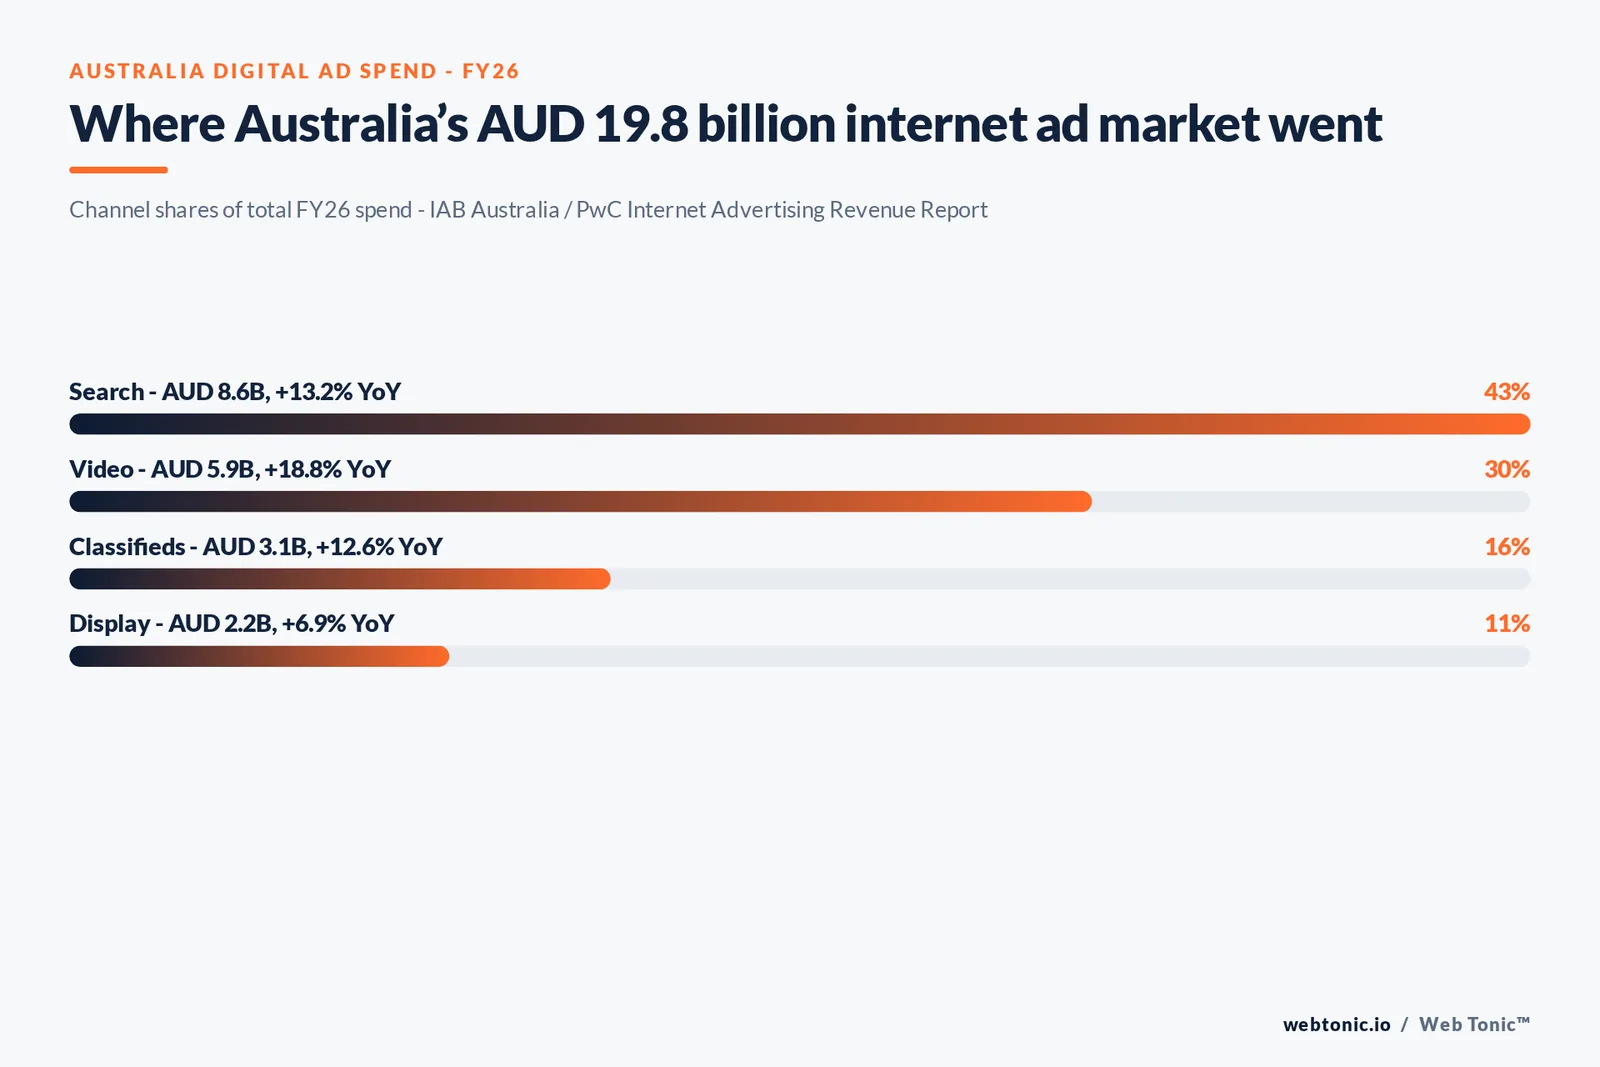
The IAB Australia Internet Advertising Revenue Report, compiled by PwC from data submitted directly by IAB member companies plus estimates from public sources, measured the Australian internet advertising market at AUD 19.8 billion for the financial year ended 30 June 2026 - growth of 14.0% year over year, ahead of the market's own six-year average of 13.7% and its strongest financial-year result since FY22.
| Channel | FY26 spend | YoY growth | Share of total market |
|---|---|---|---|
| Search | AUD 8.6 billion | +13.2% | 43% |
| Video (all formats) | AUD 5.9 billion | +18.8% | 30% |
| Classifieds | AUD 3.1 billion | +12.6% | 16% |
| Non-video general display | AUD 2.2 billion | +6.9% | 11% |
| Audio | AUD 353 million | +6.6% | 2% |
Source: IAB Australia, Internet Advertising Revenue Report FY26.
Video is where the format shift is happening
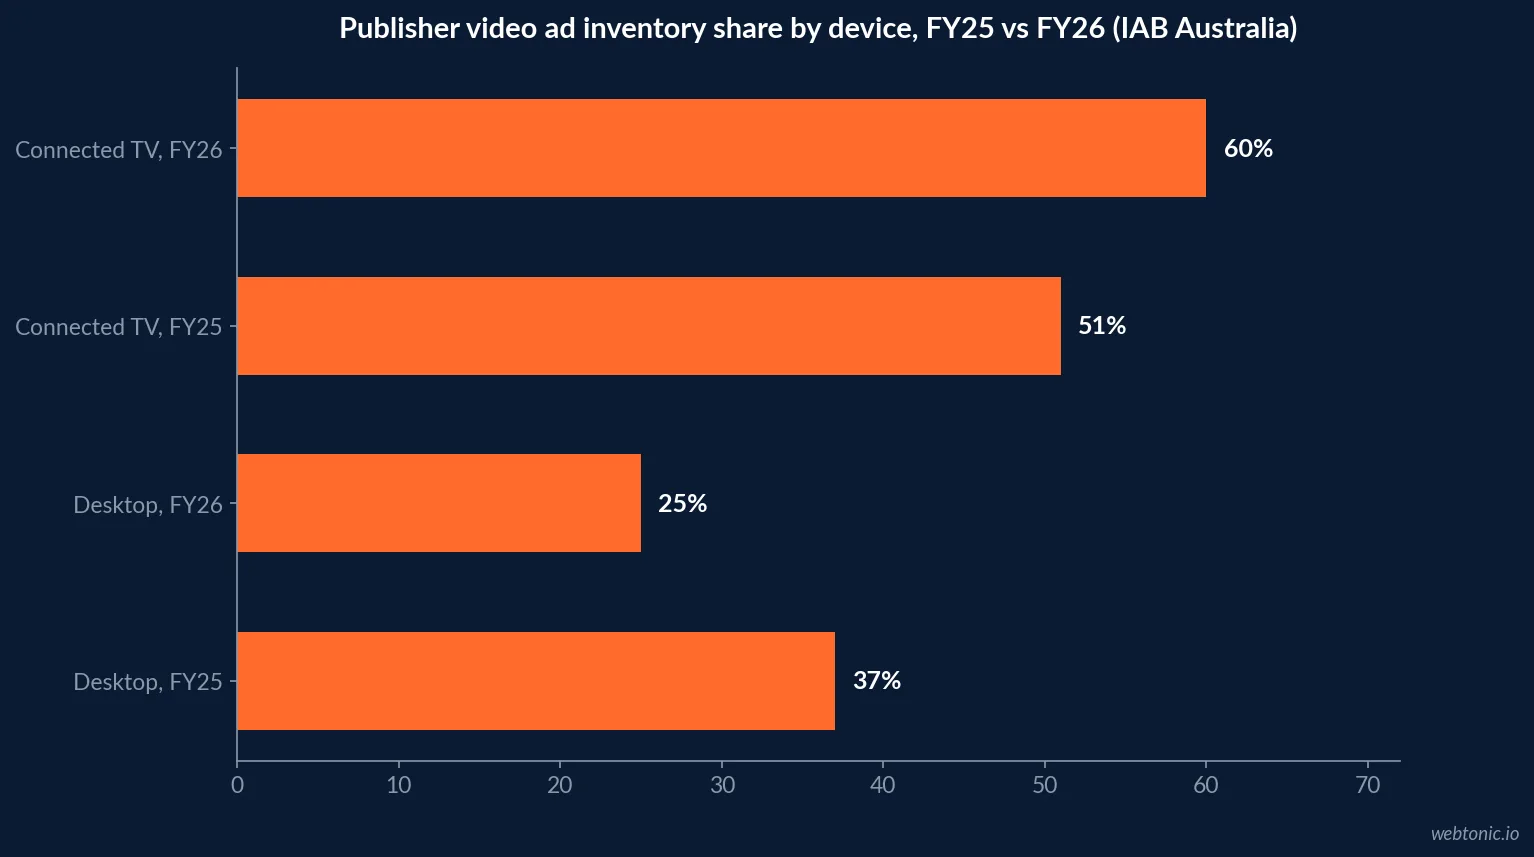
Video advertising was the market's clearest growth engine, up 18.8% to AUD 5.9 billion and now approaching a third of total spend for the first time. Inside that number, social video was the standout format, up 29.5% year over year to AUD 2.4 billion and now representing 41% of all video spend, up from 38% a year ago. The inventory itself is shifting toward premium environments: Connected TV took 60% of publisher video expenditure in FY26, up from 51% in FY25, while desktop's share of that same video spend fell from 37% to 25% and mobile ticked up slightly to 15%.
| Video inventory type | FY26 share of publisher video spend | FY25 share |
|---|---|---|
| Connected TV | 60% | 51% |
| Mobile | 15% | 12% |
| Desktop | 25% | 37% |
Beyond search and video: classifieds, audio and display
Classifieds recorded double-digit financial-year growth for the first time since FY22, up 12.6% to AUD 3.1 billion. Audio advertising grew 6.6% to AUD 353 million, driven mainly by podcasting, which grew 10.1% and now represents 40% of total audio ad spend, while streaming audio grew a more modest 4.3%. Non-video general display advertising increased 6.9% to AUD 2.2 billion, with infeed and native formats the strongest contributor at +10.9%.
Which industries are actually spending it
Content publishers' reported general display expenditure concentrates heavily in five verticals: Retail, Automotive, Entertainment & Media, Finance and FMCG together accounted for 56% of display spend in FY26. Retail grew its share to 17.8% (from 17.2% in FY25) and Automotive to 14.2% (from 13.7%), while FMCG eased slightly to 6.1% (from 6.4%) - a sign that discretionary retail and auto categories are outpacing staples in advertising intensity even as both grow overall.
| Industry | Share of display spend, FY26 | Share, FY25 | Direction |
|---|---|---|---|
| Retail | 17.8% | 17.2% | Up |
| Automotive | 14.2% | 13.7% | Up |
| Entertainment & Media | Part of top-5, 56% combined | - | Stable |
| Finance | Part of top-5, 56% combined | - | Stable |
| FMCG | 6.1% | 6.4% | Down |
Who the ad spend is actually reaching
DataReportal's Digital 2026 Australia report, built on proprietary Kepios analysis, counted 21.0 million active social media user identities in Australia as of October 2025 - 77.7% of the total population and 80.0% of the country's internet user base. Among adults specifically, 18.5 million people aged 18 and over used social media, equivalent to 87.0% of the adult population. That reach is exactly why social video captured 41% of FY26 video ad spend and grew nearly 30% year over year - the audience is already there at near-saturation levels among adults.
| Audience metric | Australia, 2025-26 |
|---|---|
| Active social media user identities | 21.0 million |
| Share of total population | 77.7% |
| Share of adult population (18+) | 87.0% |
| Share of total internet user base using social media | 80.0% |
Source: DataReportal, Digital 2026: Australia (Kepios analysis). Youth-specific reach is even higher: Roy Morgan's late-2025 research found 99.96% of Australians aged 14-15 use at least one social media platform in an average four weeks, led by YouTube at 95%, Snapchat at 87%, Facebook at 81% and Instagram at 78% - reach data that is now under regulatory pressure following Australia's under-16 social media access restrictions taking effect in December 2025, a policy shift that will directly affect where youth-targeted ad inventory in the categories above can still run.
What Australian SMBs actually spend, for comparison
Set against the AUD 19.8 billion market-wide figure, individual Australian SMB budgets are far smaller and scale predictably with revenue. A 2026 benchmark of published Australian agency rate cards found most SMBs allocate 7% to 10% of revenue to marketing, with typical monthly budgets running from AUD 500 to 2,000 for micro and solo businesses up to AUD 8,000 to 30,000 for medium-sized businesses running a full multi-channel mix.
| Business size | Revenue band | Typical monthly marketing budget |
|---|---|---|
| Micro / solo | Under AUD 250K | AUD 500 - 2,000 |
| Small | AUD 250K - 2M | AUD 2,000 - 8,000 |
| Medium | AUD 2M - 10M | AUD 8,000 - 30,000 |
Source: Workspacein, What Australian SMBs Pay for Marketing in 2026.
Checking ad spend against real retail demand
The Australian Bureau of Statistics' final Retail Trade, Australia release recorded retail turnover up 1.2% in June 2025, seasonally adjusted, driven mainly by household goods retailing (+2.3%) and other retailing (+1.9%), with department stores up 1.9% and clothing and footwear up 1.5% on end-of-financial-year sales activity. Retail volumes for the June 2025 quarter rose a more modest 0.3%. That release was also the ABS's final standalone Retail Trade publication before the survey's structure changed, which is itself a reminder that Australian retail-economy benchmarking is entering a transition period alongside the digital-ad-spend growth documented above.
| Retail category | June 2025 monthly change (seasonally adjusted) |
|---|---|
| Household goods retailing | +2.3% |
| Other retailing | +1.9% |
| Department stores | +1.9% |
| Clothing, footwear & personal accessories | +1.5% |
| Food retailing | +0.9% |
| Total retail turnover | +1.2% |
Source: Australian Bureau of Statistics, Retail sales surge in June.
What this means for a 2026 Australian media plan
A brand allocating a 2026 Australian media budget is allocating against a market growing 14% overall, with search still the single largest line at AUD 8.6 billion and video the fastest-growing. That mirrors the pattern Web Tonic tracks globally in Google Ads pricing: search demand keeps commanding premium budget even as newer formats grow faster in percentage terms. On the video side, the shift toward Connected TV and away from desktop inventory is exactly the kind of structural change that should reshape a Meta Ads and broader social-video plan, not just a linear-TV replacement strategy.
Building the channel mix around this data
The retail and automotive share gains inside display spend are a useful competitive signal for brands in adjacent categories: if the two fastest-growing verticals are already increasing their display intensity, category competitors bidding on the same inventory should expect rising costs there specifically, not just market-wide. Brands building a full-funnel Australian plan around this data typically pair it with a growth marketing program that can shift budget between search, video and display as the FY27 numbers start to diverge from the FY26 baseline established here.
What the numbers together suggest for 2026 planning
- Search still deserves the largest single line item in an Australian digital budget at 43% market share and a new spend record.
- Video budget should assume Connected TV, not desktop, given the inventory shift from 37% to 25% desktop share in one year.
- Social video specifically is the format growing fastest, at nearly 30% year-over-year growth.
- Retail and Automotive are the categories setting the pace on display spend intensity, useful competitive context for those verticals.
- Underlying retail demand is still growing, per the ABS, which supports continued ad-spend growth rather than a spend bubble disconnected from consumer activity.
Reading FY26 as a leading indicator for FY27
Three trends inside this data set are the ones worth carrying into next year's plan rather than treating as a one-off FY26 result. The Connected TV shift inside video spend moved nine percentage points in a single year (51% to 60%), which is a fast enough change that a media plan built on last year's device mix would already be misallocating budget. Social video's near-30% growth rate, against overall video growth of 18.8%, shows the format gap widening rather than converging, meaning the social-video share of the video budget is likely to keep climbing past its current 41%. And the classifieds category returning to double-digit growth for the first time since FY22 suggests a cyclical recovery in that segment specifically, worth watching against the broader 14% market growth rate to see whether it continues or was a one-year rebound.
Frequently Asked Questions
How big is Australia's digital advertising market in 2026?
AUD 19.8 billion for the FY26 financial year, according to the IAB Australia Internet Advertising Revenue Report prepared by PwC - a 14.0% year-over-year increase and the market's strongest financial-year growth since FY22, ahead of its own six-year average growth rate of 13.7%.
Which channel gets the most digital ad spend in Australia?
Search, by a wide margin. It remained the largest category at 43% of total spend, reaching AUD 8.6 billion in FY26, a new financial-year record, up 13.2% year over year. Video was the fastest-growing major category, up 18.8% to AUD 5.9 billion and now approaching a third of the market.
Is video advertising shifting toward premium inventory in Australia?
Yes. Connected TV represented 60% of publisher video expenditure in FY26, up from 51% in FY25, while desktop's share of that same video spend fell from 37% to 25%. Social video specifically grew 29.5% year over year to AUD 2.4 billion, now 41% of all video spend, up from 38% the year before.
Which industries spend the most on Australian digital display advertising?
The top five industry categories - Retail, Automotive, Entertainment & Media, Finance and FMCG - accounted for 56% of content publishers' reported general display expenditure in FY26. Retail grew its share to 17.8% (from 17.2%) and Automotive to 14.2% (from 13.7%), while FMCG eased slightly to 6.1% (from 6.4%).
Does the ad-spend growth match what is happening in Australian retail overall?
Directionally, yes. The Australian Bureau of Statistics' final Retail Trade release recorded retail turnover up 1.2% in June 2025, led by household goods retailing (+2.3%) and other retailing (+1.9%), consistent with a market where discretionary spend and the digital advertising chasing it are both still expanding rather than contracting.
Sources
IAB Australia, Internet Advertising Revenue Report FY26
Australian Bureau of Statistics, Retail sales surge in June
Australian Bureau of Statistics, Retail Trade, Australia (final release)
DataReportal, Digital 2026: Australia (Kepios)
Roy Morgan Research, youth social media reach
Workspacein, Australian SMB Marketing Costs 2026