Table of contents
Referrals still win the most new dental patients in 2026, but MouthWatch's own 448-practice survey shows Google closing that gap fast - while ADA Health Policy Institute data shows a third of practices have open chair capacity that demand generation is not currently filling. Here is what the two primary 2026 datasets actually say, read together.
Key Takeaways
- 65.6% of practices name word of mouth and referrals their top new-patient source in 2026, down from 77.5% in 2025.
- Google Business Profile (organic) is cited by 15.6% of practices as their top channel.
- Google Ads adds another 7.6%, for a combined Google share of 23.2%.
- Local sponsorships account for 3.3% of reported new-patient attribution.
- Loyalty and referral programs account for 2.2%.
- Facebook/Instagram ads account for 2.0%.
- Social organic, direct mail, email and video each account for under 2%.
- 51.5% of practices spend under $500/month or nothing on marketing.
- Marketing satisfaction rises from 5.7/10 at $0 spend to 6.7/10 at $1,500-$3,000/month.
- Average marketing satisfaction across all 448 practices: 6.21/10, down from 6.98/10 in 2025.
- 95.7% of owner dentists were accepting new patients in Q4 2025.
- Average new-patient wait for a first appointment: 13.4 business days.
- 33.3% of dentists said they were not busy enough and could treat more patients.
- Only 3.7% of dentists volunteered "acquire new patients" as a top 2026 priority.
- Average dental search-ad cost per lead: $83.93, on a 9.08% conversion rate.
Referrals are still first, but the gap to Google is closing fast
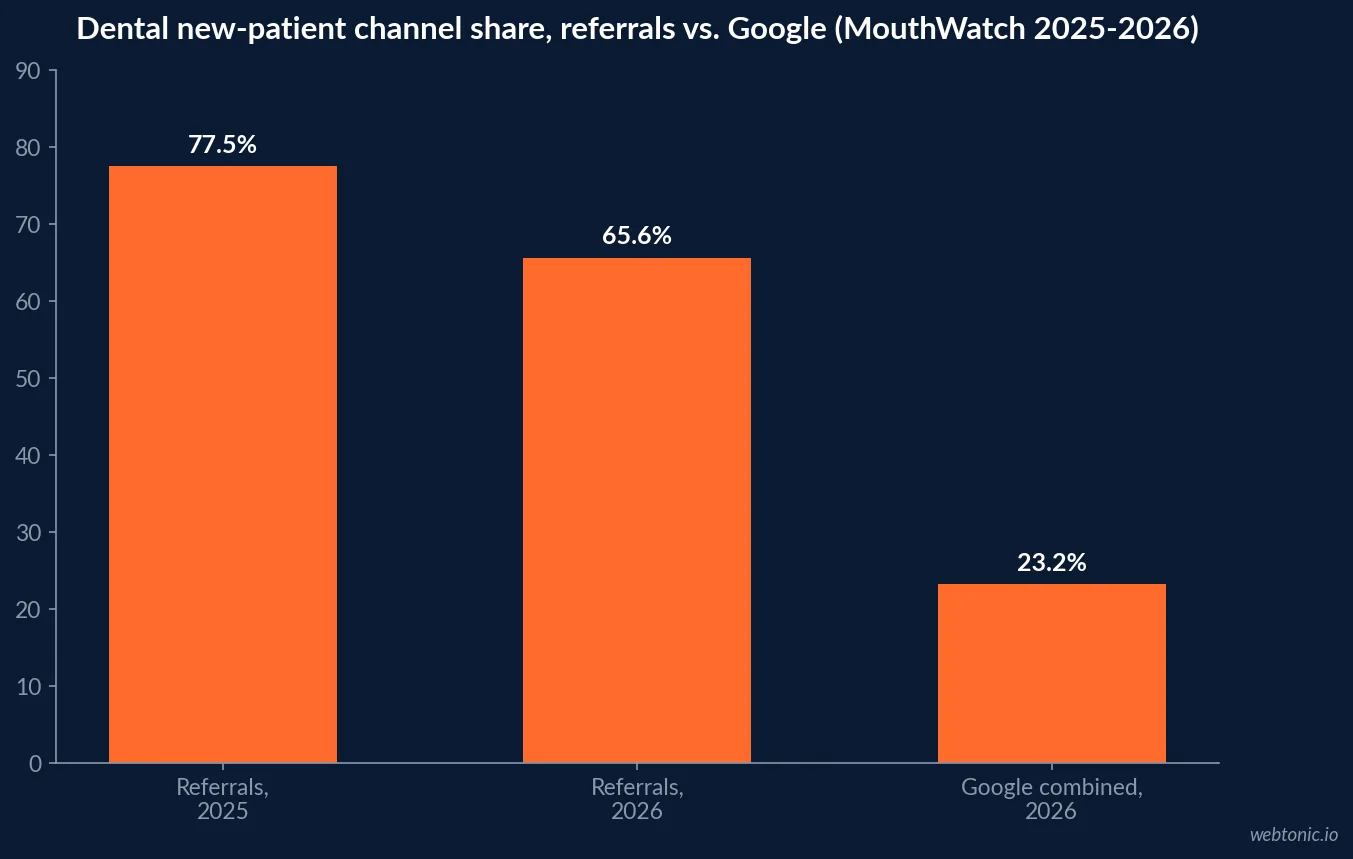
MouthWatch's 2026 Dental Practice Marketing Survey, its own annual research covering 448 practices, found 65.6% of practices named word of mouth and patient referrals their top new-patient source - still the largest single channel, but down from 77.5% in the 2025 edition of the same survey. That is not a sign referrals got less effective; it is a sign Google became a real second engine. Google Business Profile (organic) is now cited by 15.6% of practices as their top channel - more than any paid digital option - and Google Ads adds another 7.6%, for a combined Google share of 23.2% of reported new-patient attribution, up from roughly 17% total digital-marketing success in 2025.
| Most effective new-patient channel, self-reported (MouthWatch 2026, n=448) | 2026 share | 2025 share |
|---|---|---|
| Word of mouth & patient referrals | 65.6% | 77.5% |
| Google Business Profile (organic) | 15.6% | part of ~17% total digital |
| Google Ads | 7.6% | part of ~17% total digital |
| Local community involvement / sponsorships | 3.3% | n/a |
| Patient loyalty & referral programs | 2.2% | n/a |
| Facebook / Instagram ads | 2.0% | n/a |
What practices are actually spending, and what it buys them
Most dental practices market conservatively. MouthWatch's 2026 data found 51.5% of practices spend under $500 a month or nothing at all. Cross-referencing spend against self-reported satisfaction shows the biggest jump sits low on the curve: practices spending nothing average a 5.7/10 satisfaction score, those spending $1,500-$3,000/month average 6.7/10, and those spending $5,000+/month average 6.9-7.1/10. The overall average satisfaction score across all 448 practices was 6.21/10, down from 6.98/10 in the smaller 2025 sample.
| Monthly marketing spend band (MouthWatch 2026) | Avg. satisfaction score |
|---|---|
| $0 (no spend) | 5.7 / 10 |
| $1,500-$3,000/month | 6.7 / 10 |
| $5,000+/month | 6.9-7.1 / 10 |
| All 448 practices combined | 6.21 / 10 (was 6.98 in 2025) |
The capacity side most demand-gen plans ignore
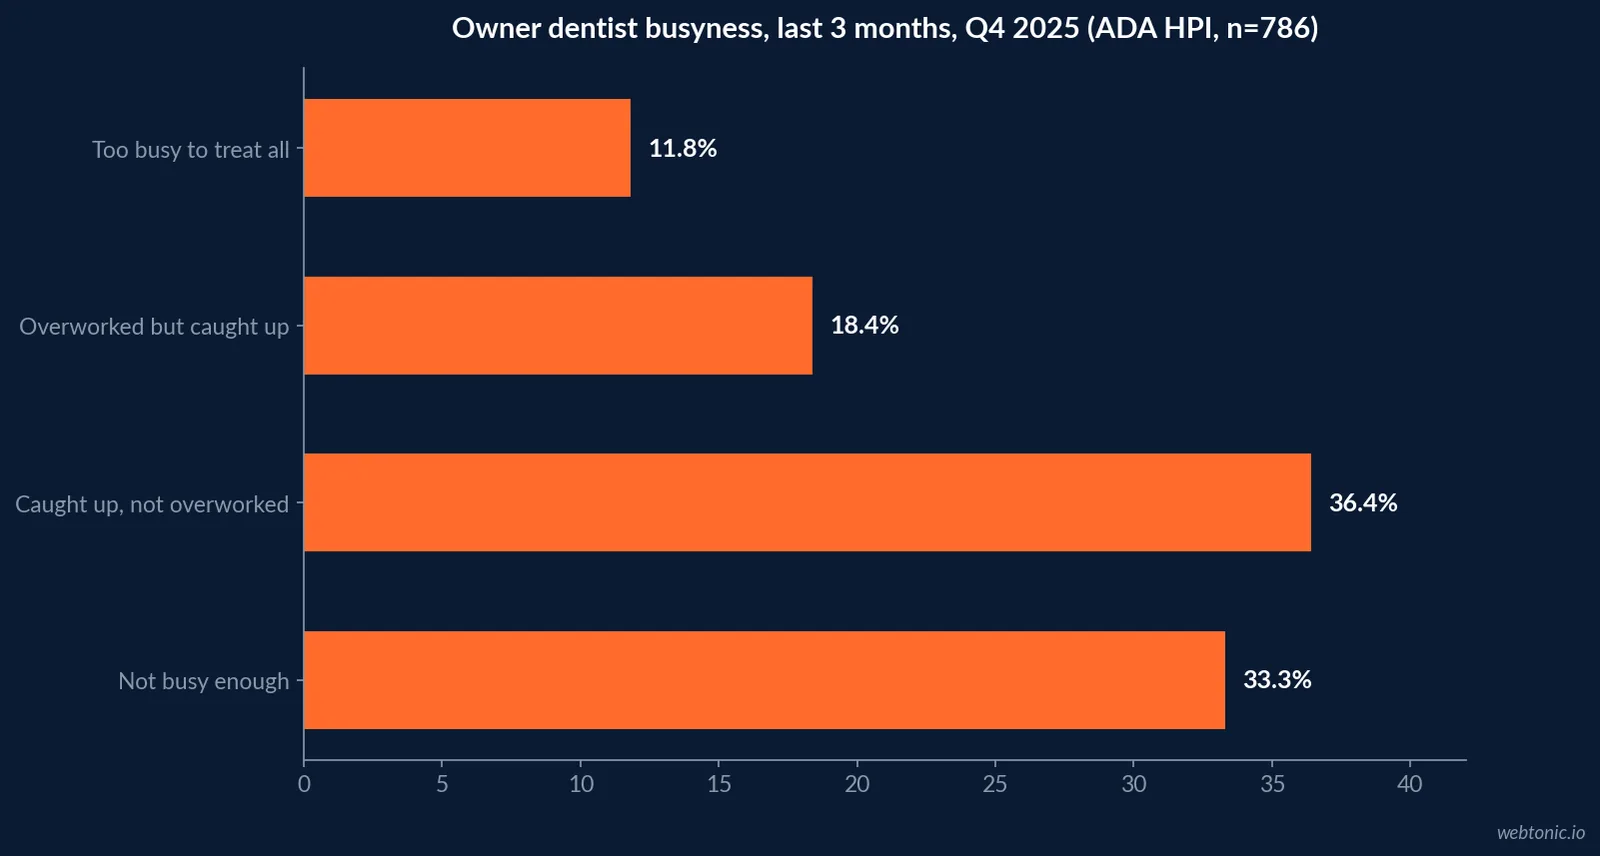
The ADA Health Policy Institute's Q4 2025 Economic Outlook and Emerging Issues in Dentistry report found 95.7% of owner dentists were accepting new patients that quarter, with the average wait for a first appointment at 13.4 business days. Yet when asked to describe their general busyness over the prior three months, 33.3% said they were not busy enough and could have treated more patients - almost exactly the mirror image of the 36.4% who said they provided care to everyone who asked without being overworked. Practices in that under-capacity third are, by definition, a demand-generation gap before they are a pricing or staffing problem.
| Owner-dentist busyness, last 3 months (ADA HPI, Q4 2025, n=786) | Share |
|---|---|
| Too busy to treat all who requested appointments | 11.8% |
| Provided care to all, but was overworked | 18.4% |
| Provided care to all, was not overworked | 36.4% |
| Not busy enough, could have treated more patients | 33.3% |
Yet patient acquisition rarely makes the priority list
Despite that open capacity, when the ADA HPI survey asked owner dentists what else mattered most for their practice heading into 2026, only 3.7% volunteered increasing patient count / acquiring new patients - well behind refreshing or expanding the practice (13.4%), considering a sale or closure (13.0%), and preparing for retirement (12.5%). Focusing on marketing specifically was cited by 6.0%. That gap - real open capacity against a low stated priority on filling it - is the clearest argument in this data for a deliberate demand-generation plan rather than an assumption that referrals alone will keep the schedule full.
| Owner dentist's other top 2026 priority, write-in (ADA HPI, n=354) | Share of respondents |
|---|---|
| Refresh / remodel / expand the practice | 13.4% |
| Sell the practice / consider closing | 13.0% |
| Retire / prepare for retirement | 12.5% |
| Reduce overhead / manage rising expenses | 6.9% |
| Focus on marketing | 6.0% |
| Increase number of patients / acquire new patients | 3.7% |
Why most patients are not "in-market" until pain or a checkup forces the question
Dentistry has its own version of the pattern the LinkedIn B2B Institute calls the 95-5 rule: researcher John Dawes' finding, cited in the Institute's own writeup, that roughly 95% of a category's buyers are not actively in-market at any given moment. That research was built on B2B and consumer packaged-goods categories, not dental patients specifically, so treat the exact 95/5 split as an analogy rather than a dental statistic - but the underlying shape fits: most people are not searching for a dentist until a cleaning is due, a tooth hurts, or insurance is about to reset. That is consistent with referrals and an always-on Google Business Profile outperforming one-off paid campaigns in MouthWatch's own data above - both are "always visible" channels rather than channels that only work at the exact moment of search.
| Channel type | When it works | Dental-relevant example |
|---|---|---|
| Always-on / demand creation | Before the patient is actively searching | Google Business Profile, referral programs, reputation |
| Demand capture | The moment a patient searches | Google Ads on "emergency dentist near me" |
| Trigger event | What moves a patient into the 5% actively searching | Toothache, insurance renewal, a recall reminder |
Read together, the gap between the 33.3% of practices with open capacity and the 3.7% who name filling it a priority is not a contradiction - it is a sign that most owner dentists still think of "marketing" as an occasional project rather than an ongoing budget line, which is consistent with MouthWatch's finding that more than half spend under $500 a month. A practice sitting in that not-busy-enough third does not need a bigger campaign; it typically needs a first consistent one.
What paid search costs a dental practice specifically
WordStream's 2025 Google Ads Benchmarks report puts the average Dentists & Dental Services search-ad click-through rate at 5.44% - the lowest of the 23 industry categories it tracks - against a $7.85 cost per click and a 9.08% conversion rate, landing at an average $83.93 cost per lead. That CPL sits below the $90.92 all-home-services-and-professional average WordStream reports, which is consistent with Google Ads' relatively small 7.6% share of MouthWatch's reported new-patient attribution - it is a real, working channel, just a smaller second engine than organic Google or referrals for most of the 448 practices surveyed.
| Dental search-ad benchmark (WordStream 2025) | Figure |
|---|---|
| Click-through rate | 5.44% (lowest of 23 categories tracked) |
| Cost per click | $7.85 |
| Conversion rate | 9.08% |
| Cost per lead | $83.93 |
Reading the two datasets together
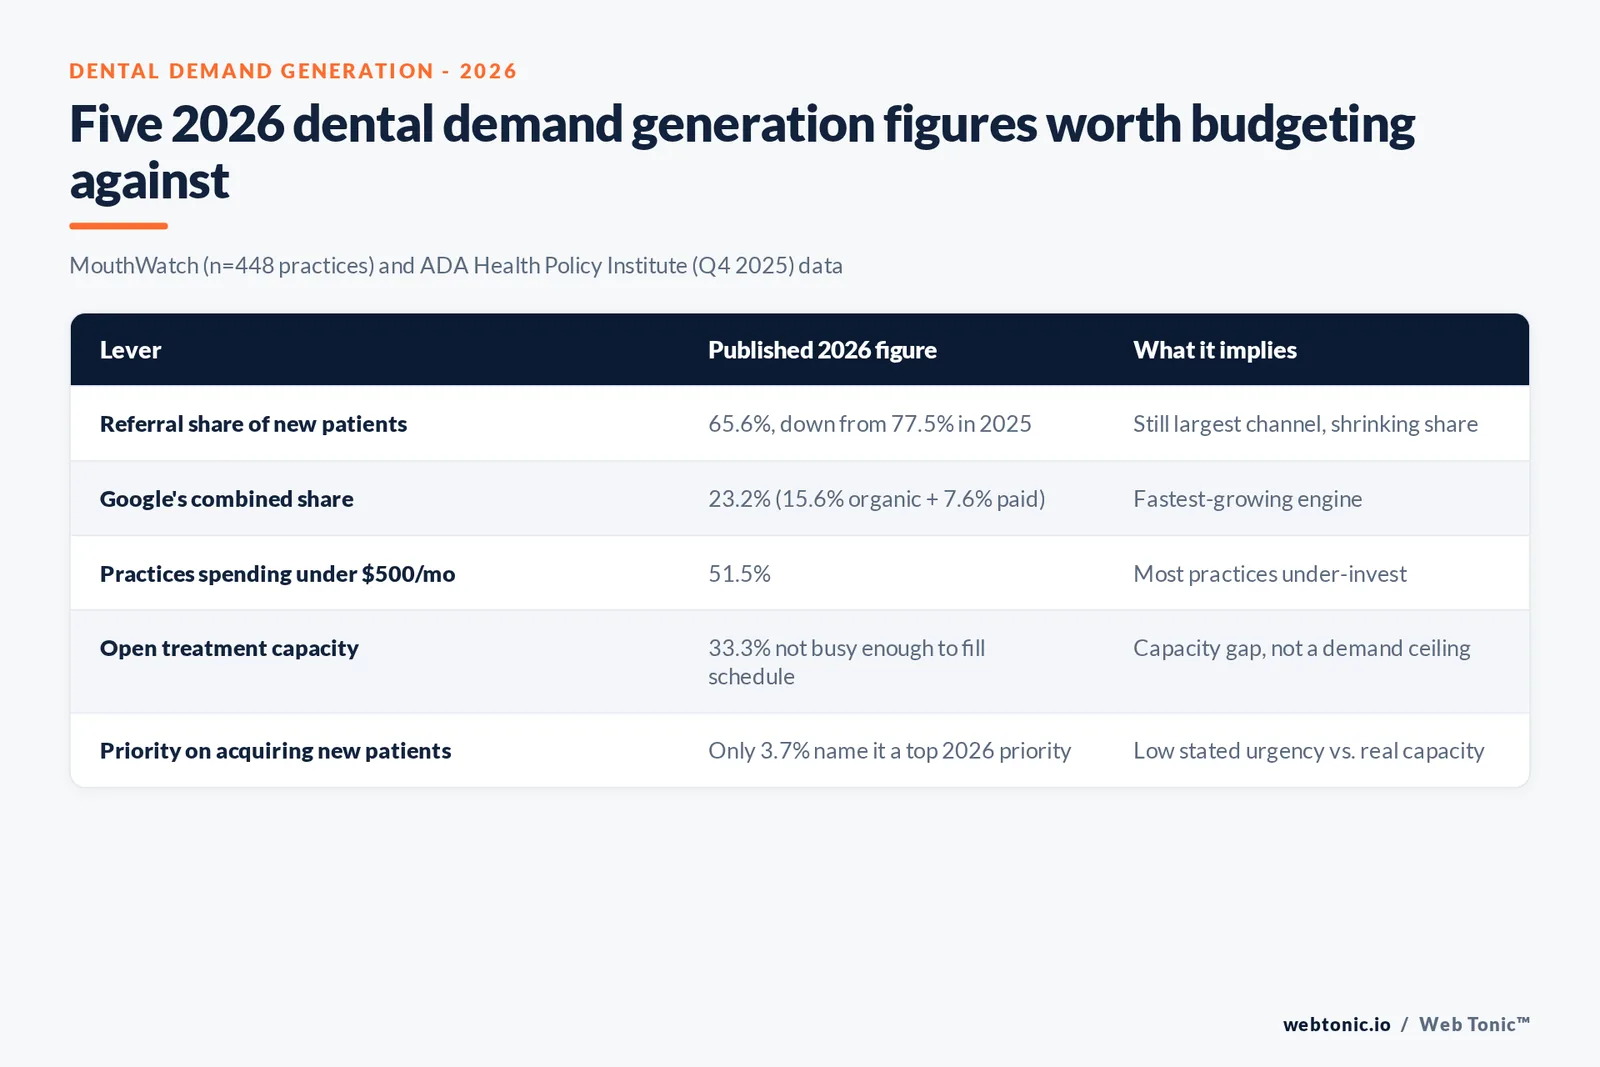
Put the MouthWatch channel-mix survey next to the ADA HPI capacity data and the honest 2026 picture is: referrals are still the largest channel but shrinking share, Google is the fastest-growing engine at 23.2% combined, most practices spend cautiously on marketing, and roughly a third of dentists have unused chair capacity while only 3.7% name filling it a stated priority. None of that supports an "essential" or "must-do" framing - it supports a specific, sourced gap between capacity and demand generation effort that a practice can choose to close or not. Our growth marketing practice builds that plan against a practice's own scheduling and channel data, and our data and analytics practice connects the scheduling side to the marketing side so capacity and demand generation get planned together; talk to us if the capacity data above looks like your own schedule.
Frequently Asked Questions
What is still the top source of new dental patients in 2026?
Word of mouth and patient referrals, but the margin is shrinking. MouthWatch's 2026 Dental Practice Marketing Survey of 448 practices found 65.6% named referrals their top new-patient source, down from 77.5% in the 2025 edition of the same survey - not because referrals got weaker, but because Google is becoming a genuine second engine for new-patient growth.
How much of new dental patient volume is Google responsible for now?
Nearly a quarter. MouthWatch's 2026 survey found Google Business Profile (organic) is cited by 15.6% of practices as their top new-patient channel - more than any paid digital option - and Google Ads adds another 7.6%. Combined, Google accounts for 23.2% of reported new-patient attribution, up from roughly 17% total digital-marketing success in the 2025 survey.
How much are dental practices actually spending on marketing?
Conservatively, for most of them. The same MouthWatch survey found 51.5% of practices spend under $500 a month or nothing at all on marketing. Practices spending $1,500-$3,000/month reported a 6.7/10 marketing satisfaction score versus 5.7/10 for those spending nothing, and $5,000+/month spenders reported 6.9-7.1/10 - the biggest satisfaction jump sits between $0 and roughly $1,500/month, not at the highest spend tiers.
Do most dental practices actually need more new-patient demand generation, or is it a capacity problem?
Both, depending on the practice. The ADA Health Policy Institute's Q4 2025 Economic Outlook found 95.7% of owner dentists were accepting new patients that quarter, with an average wait of 13.4 business days for a first appointment - but 33.3% of dentists said they were not busy enough and could have treated more patients. In that same survey, only 3.7% of dentists volunteered increasing patient count as a top 2026 practice priority when asked what else mattered most, well behind refreshing the practice (13.4%) or considering a sale (13.0%).
What dental demand generation channels are not working, per the data?
MouthWatch's 2026 survey found social media organic, direct mail, email marketing and video content each account for less than 2% of reported new-patient sources - not necessarily useless for a specific practice, but not broadly consistent drivers across the 448-practice sample. Local sponsorships (3.3%) and loyalty/referral programs (2.2%) outperform all four of those on new-patient attribution.
Sources
MouthWatch - 2026 Dental Practice Marketing Survey (448 practices)
American Dental Association Health Policy Institute - State of the US Dental Economy
ADA Health Policy Institute - Q4 2025 Economic Outlook and Emerging Issues in Dentistry
WordStream - Google Ads Benchmarks 2025
LocaliQ - 2025 Search Ad Benchmarks for Home Services
LinkedIn B2B Institute - Why You Should Follow The 95-5 Rule