



Table of contents
Crowdfunding statistics get quoted as one blended success rate, but the real Q1 2026 platform data - scraped campaign by campaign, not modeled - shows success running from 40.7% to 100% depending on the platform and category. This page works from that raw dataset plus SEC filings on equity crowdfunding, not a stats-roundup average.
Key Takeaways
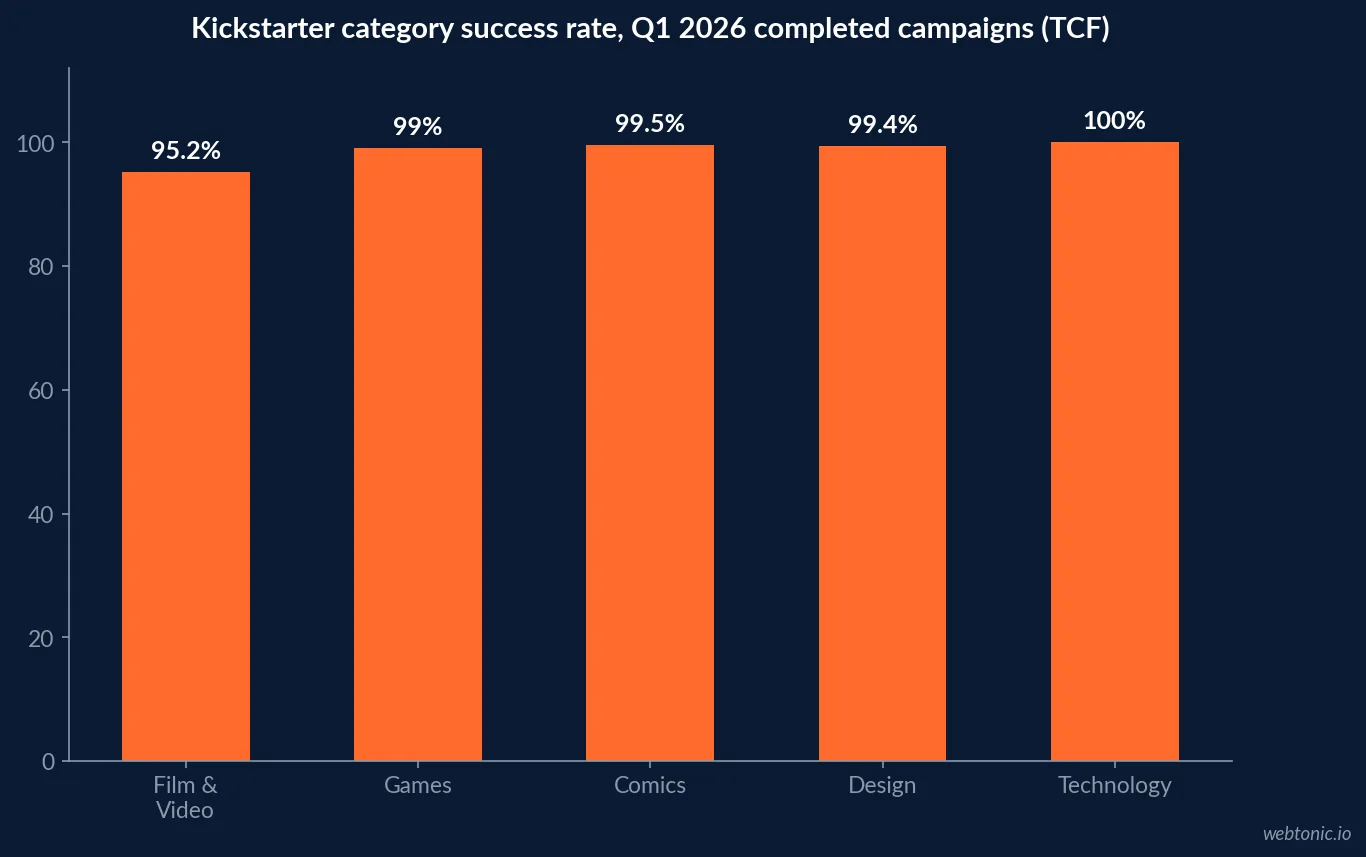
- Kickstarter technology campaigns hit a 100% success rate in Q1 2026.
- Games followed at 99.0% across 483 completed campaigns.
- Design hit 99.4% and comics 99.5%.
- Film and video was the category low at 95.2%.
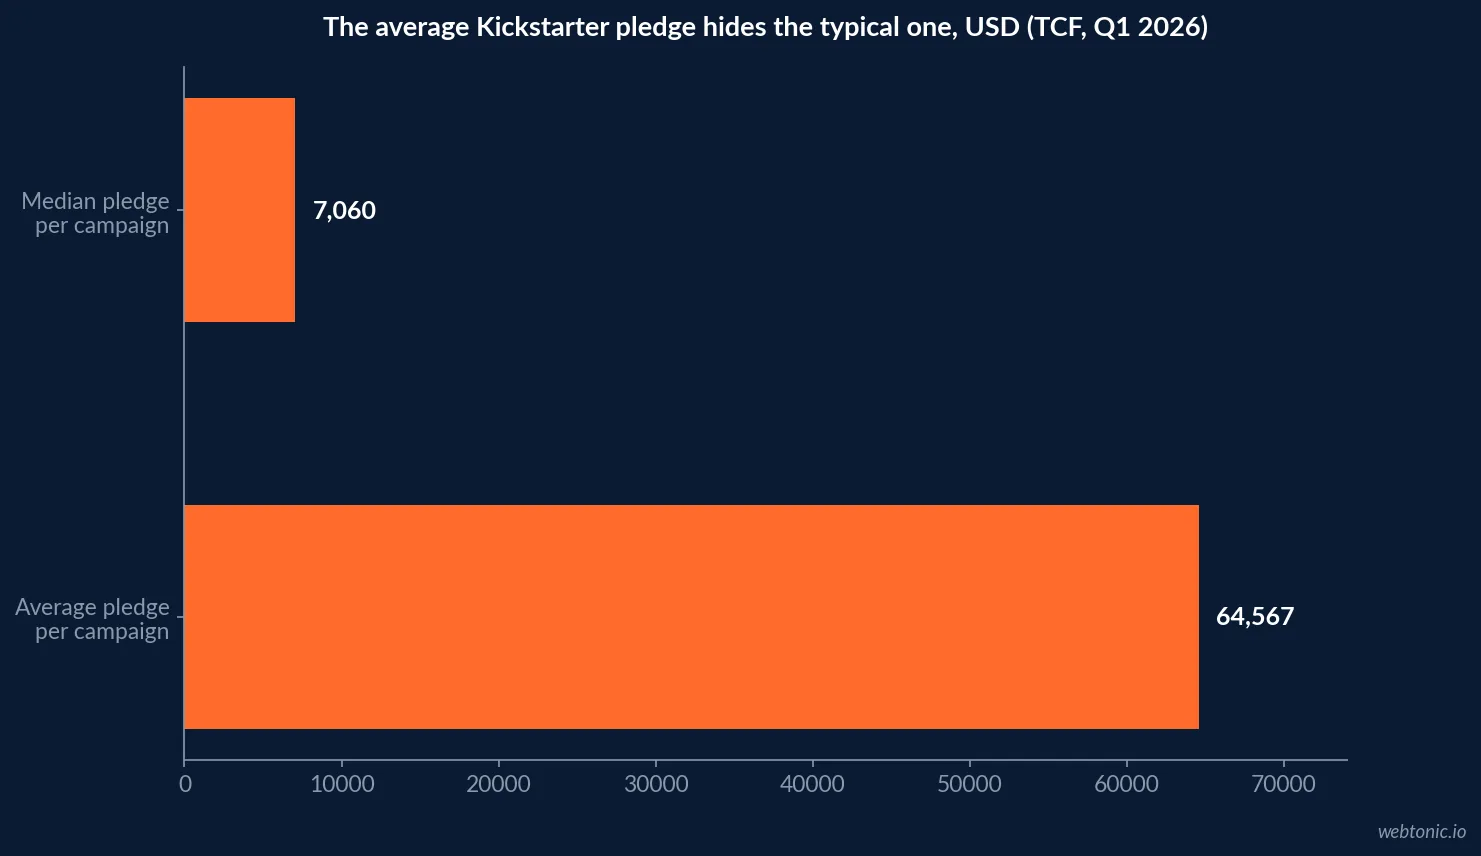
- Average Kickstarter pledge per campaign was USD 64,567.
- The median was just USD 7,060.
- The top 10 campaigns raised over USD 57 million combined.
- Indiegogo's Q1 2026 success rate was 40.7%.
- Only 8.7% of Indiegogo campaigns crossed USD 50,000.
- That result placed a campaign in Indiegogo's top 9%.
- One Indiegogo outlier raised USD 36 million alone.
- 9,461 Reg CF equity offerings were filed since May 2016.
- 1,052 issuers ran more than one Reg CF offering.
- Wefunder led Reg CF platforms at USD 39.4 million in H1 2026.
- March was Kickstarter's busiest 2026 launch month by far.
Why a blended crowdfunding success rate is close to useless
Most crowdfunding roundups quote one platform-wide success percentage. The Crowdfunding Formula's Q1 2026 report, built from a scraped dataset of 4,476 Kickstarter projects and 551 Indiegogo campaigns active or completed between January and March 2026, shows exactly why that number misleads: completed technology hardware campaigns hit a 100% success rate across 145 campaigns, while film and video closed at 95.2% - still well above most platform averages, but a very different starting point for a founder planning a launch.
| Kickstarter category | Completed campaigns | Success rate | Total raised (successful) |
|---|---|---|---|
| Technology | 145 | 100% | USD 52,888,420 |
| Comics | 213 | 99.5% | USD 3,532,220 |
| Design | 169 | 99.4% | USD 14,339,810 |
| Games | 483 | 99.0% | USD 19,667,450 |
| Film & Video | 166 | 95.2% | USD 4,753,552 |
The average hides the typical campaign
Across the full Q1 2026 Kickstarter sample - 4,476 projects captured, 1,583 confirmed successful, 2,869 still live at time of capture - total pledges to successful campaigns reached USD 102,209,443, and total pledges across everything captured, including still-live campaigns, reached USD 201,638,450. The average pledged per campaign was USD 64,567. The median was USD 7,060. That gap is the entire story: the top 10 campaigns alone accounted for over USD 57 million, more than half of all successful pledges combined, which means the "average successful campaign" figure quoted everywhere is not a realistic planning number for a typical creator.
| Kickstarter Q1 2026 metric | Value | Note |
|---|---|---|
| Total projects captured | 4,476 | Includes still-live campaigns |
| Confirmed successful | 1,583 | 35.4% of captured projects |
| Still live at time of capture | 2,869 | Final outcome not yet known |
| Total pledged, successful only | USD 102,209,443 | Realized funding |
| Total pledged, all incl. live | USD 201,638,450 | Includes pending campaigns |
| Average pledged per campaign | USD 64,567 | Skewed by top performers |
| Median pledged per campaign | USD 7,060 | Better planning baseline |
| Top 10 campaigns' combined total | USD 57 million+ | More than half of successful pledges |
Indiegogo's Q1 2026 numbers, and its outlier problem
Indiegogo's Q1 2026 sample of 551 campaigns confirmed 224 funded, a 40.7% success rate, with 327 still active at time of capture. Total pledged across all campaigns reached USD 64,706,423 - but excluding one outlier, the Creality Filament Maker M1 (which alone raised USD 36,047,003 at 4,604% of its goal), that total drops to USD 28,659,420. Only 48 campaigns, 8.7% of the total, crossed the USD 50,000 mark - a threshold that the same dataset frames as a top-9% result on the platform, with USD 100,000 landing in the top 6%.
| Indiegogo Q1 2026 metric | Value | Note |
|---|---|---|
| Total campaigns captured | 551 | Jan-Mar 2026 |
| Confirmed funded | 224 (40.7%) | Lower than Kickstarter's blended rate |
| Still active at capture | 327 (59.3%) | Outcome pending |
| Total pledged, all campaigns | USD 64,706,423 | Includes the Creality outlier |
| Total pledged, excl. outlier | USD 28,659,420 | More representative of a typical raise |
| Campaigns raising over USD 50,000 | 48 (8.7%) | A top-9% result on this platform |
| Campaigns raising over USD 1 million | 8 | Extreme outliers, not the norm |
Equity crowdfunding runs on entirely different rules
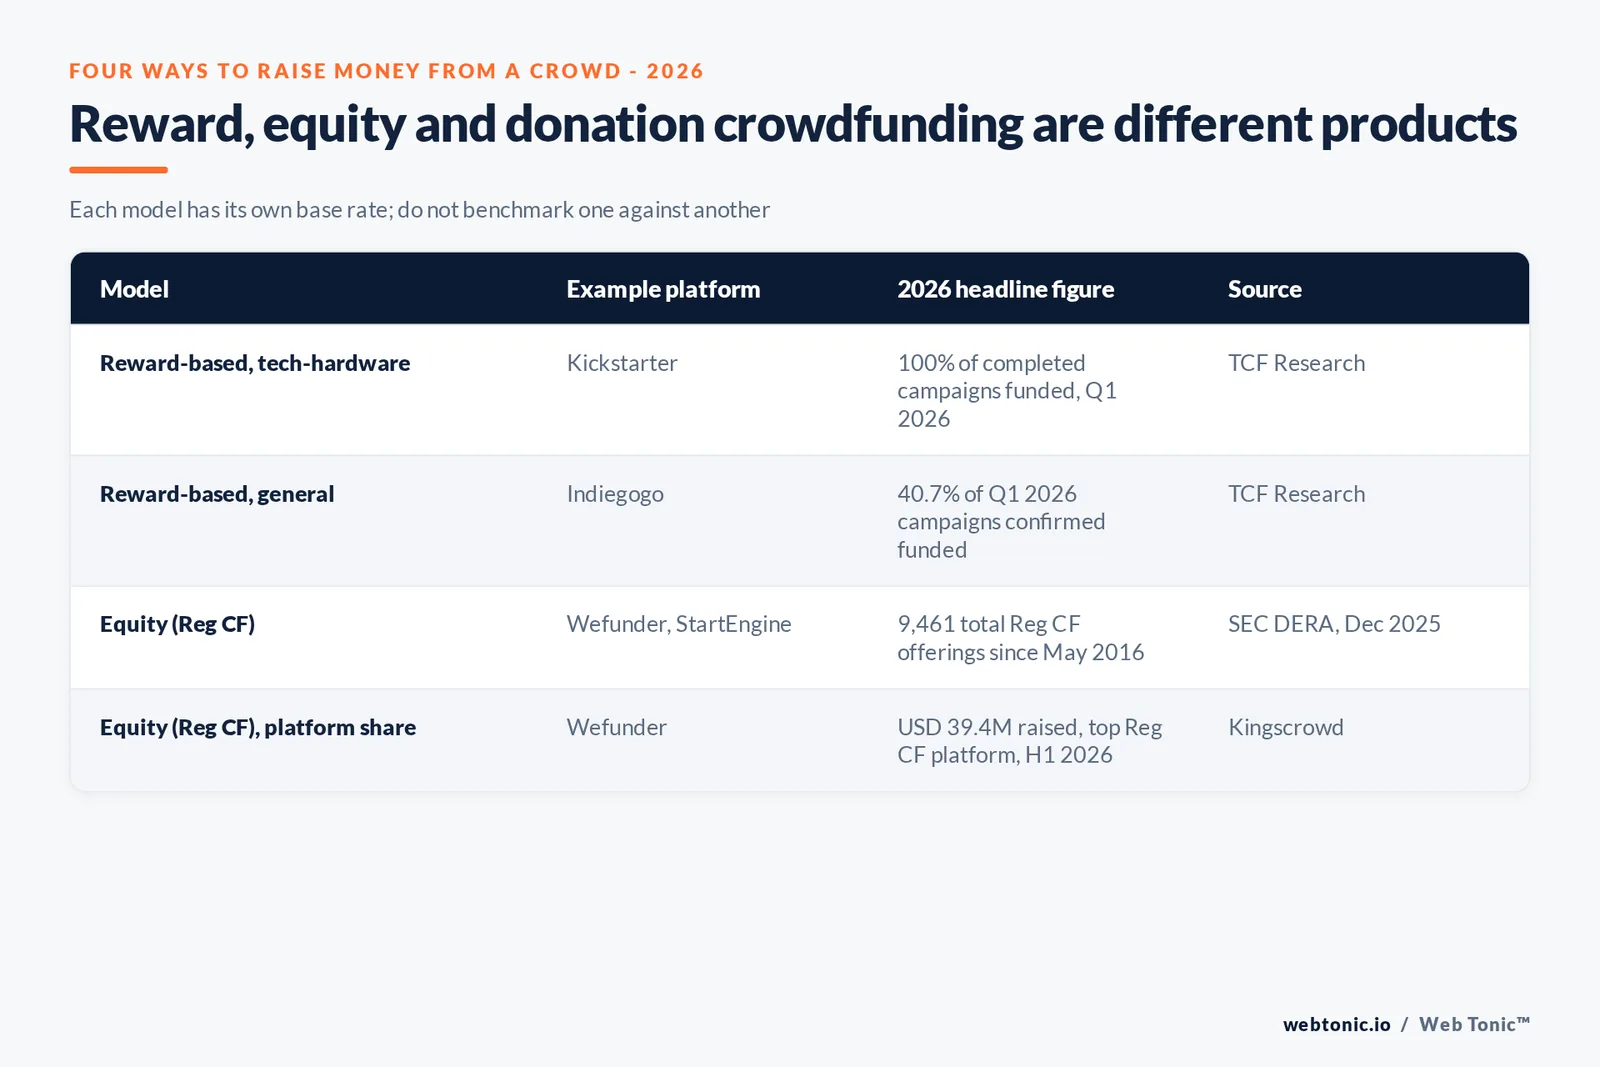
Reward-based platforms like Kickstarter and Indiegogo sell a product pre-order; Regulation Crowdfunding (Reg CF) sells equity to non-accredited investors, and it is tracked by the SEC rather than scraped from a public campaign page. SEC data on Reg CF offerings shows 9,461 total offerings filed between May 2016 and December 2025, with 1,052 issuers having filed more than one offering. Kingscrowd's H1 2026 data shows Wefunder leading all Reg CF platforms at USD 39.4 million raised, ahead of DealMaker Securities at USD 27.5 million and StartEngine at USD 24.3 million - while DealMaker Securities separately dominated the larger Reg A+ exemption at USD 140.4 million.
None of these figures are comparable to a Kickstarter pledge total; equity crowdfunding measures capital raised against a cap table, not pre-orders against a product goal. Treat the two as separate fundraising products when setting expectations for either.
| Crowdfunding model | What is sold | 2026 headline figure | Source |
|---|---|---|---|
| Reward-based, tech-hardware (Kickstarter) | Pre-ordered product | 100% success rate, Q1 2026 | TCF Research |
| Reward-based, general (Indiegogo) | Pre-ordered product | 40.7% success rate, Q1 2026 | TCF Research |
| Equity (Reg CF) | Company equity | 9,461 offerings filed since 2016 | SEC DERA, Dec 2025 |
| Equity (Reg CF), platform leaderboard | Company equity | Wefunder: USD 39.4M, H1 2026 | Kingscrowd |
Timing and geography also move the odds
Launch timing is not neutral. The Crowdfunding Formula's Q1 2026 dataset found March was the most active Kickstarter launch month by a wide margin, with 2,755 projects launched that month against just 1,059 in February - more than double. Geographically, the United States dominates as the home of Kickstarter creators, followed by the United Kingdom, Canada, Hong Kong, Spain and Germany, concentrating both competition and backer attention in a short list of markets rather than spreading it evenly worldwide.
Academic research on the same dynamics backs the platform data: a peer-reviewed study of Indiegogo campaigns found that campaign timing and category selection materially affect the likelihood of reaching a funding goal, independent of the product itself - which lines up with the category-level spread already shown above.
| Timing or geography signal | 2026 figure | Source |
|---|---|---|
| Kickstarter's busiest 2026 launch month | March: 2,755 projects launched | TCF Research |
| Kickstarter's slowest month shown | February: 1,059 projects launched | TCF Research |
| Top Kickstarter creator country | United States, followed by UK, Canada, Hong Kong | TCF Research |
| Academic finding on timing/category | Both materially affect funding likelihood | Global Journal of Accounting and Finance, 2021 |
What a realistic funding goal looks like
Set the goal against the median, not the average, and against the category, not the platform. A hardware or games campaign on Kickstarter is launching into a category with a near-100% completion rate in the Q1 2026 data, largely because those campaigns tend to arrive with a pre-built audience. A film, video or general-interest campaign is competing in a category running 4-5 points lower, and should plan funding and marketing timelines accordingly rather than assuming the platform-wide number applies.
Our creative and campaign team builds the pre-launch audience-building work - the email list and social following that the data above shows correlates with which campaigns land in the top 10 - before a crowdfunding page ever goes live.
What the numbers do not tell you
None of these datasets capture pre-launch effort, and that is precisely where most of the variance between a top-10 campaign and a median one gets decided before the campaign page even opens. The Crowdfunding Formula's own read of its data ties the gap between average and median pledges to audience-building done ahead of launch, not to platform algorithm luck - a conclusion consistent with why technology and games campaigns, categories with naturally built-in pre-existing communities, post the highest completion rates in the Q1 2026 data shown above.
Where to go from the benchmark
Use the category table to set a realistic success-rate expectation, the median-versus-average table to set a realistic funding target, and the equity-crowdfunding numbers only if the raise is actually selling equity rather than a product. Conflating the three is the single most common planning mistake in crowdfunding coverage.
If a product launch needs the pre-launch audience and paid media plan built alongside the campaign page, talk to us about scoping the work, or see how our growth marketing team approaches a pre-launch list-building campaign before the funding page ever goes live.
Frequently Asked Questions
What is the average Kickstarter success rate in 2026?
It depends entirely on category. The Crowdfunding Formula's Q1 2026 dataset of 4,476 Kickstarter projects found technology hardware campaigns completing at a 100% success rate across 145 finished campaigns, games at 99.0% across 483, design at 99.4% across 169, comics at 99.5% across 213, and film and video at the category low of 95.2% across 166. A single blended platform-wide percentage hides that spread and is not useful for planning a specific launch.
What is the difference between the average and median amount raised?
It is the most important number in the dataset. Across the 1,583 confirmed-successful Kickstarter campaigns in the Q1 2026 sample, the average pledged per campaign was USD 64,567 - but the median was just USD 7,060. A small number of breakout campaigns, the top 10 alone raising over USD 57 million combined, pull the average far above what a typical successful campaign actually raises. Plan around the median, not the average.
How does Indiegogo's success rate compare to Kickstarter's?
Lower, on the same Q1 2026 sample. Of 551 Indiegogo campaigns captured, 224 were confirmed funded, a 40.7% rate, against 327 still active at time of capture. Indiegogo's totals were also heavily skewed by one outlier - the Creality Filament Maker M1 raised USD 36 million on its own - and only 48 campaigns, 8.7% of the total, crossed the USD 50,000 mark, which the same data treats as a top-9% result on that platform.
Is equity crowdfunding a bigger or smaller market than reward-based crowdfunding?
Different shape, not directly comparable by dollar volume. SEC data on Regulation Crowdfunding (Reg CF) - the equity-crowdfunding rule that lets non-accredited investors buy into startups - shows 9,461 total offerings filed between May 2016 and December 2025, with 1,052 issuers having run more than one offering. In H1 2026 alone, Wefunder led all Reg CF platforms with USD 39.4 million raised, per Kingscrowd's mid-year data, followed by DealMaker Securities and StartEngine.
What predicts whether a crowdfunding campaign succeeds?
Category and realistic goal-setting dominate every dataset reviewed here. The Crowdfunding Formula's data shows technology hardware and games completing at 99-100% in Q1 2026, likely reflecting pre-existing audiences rather than platform-wide dynamics. On the goal side, campaigns crossing USD 50,000 sat in the top 9% of Indiegogo's Q1 2026 dataset, and USD 100,000 sat in the top 6% - most successful campaigns raise well under either threshold, which is exactly what the median-versus-average gap on Kickstarter also shows.
Sources
The Crowdfunding Formula - Q1 2026 Crowdfunding Report
Kickstarter - Kickstarter Stats (official blog)
Kickstarter - The Creative Download Report
U.S. Securities and Exchange Commission - Regulation Crowdfunding (CF) Offerings data
SEC Division of Economic and Risk Analysis - Analysis of Crowdfunding under the JOBS Act
Kingscrowd - H1 2026 Investment Crowdfunding Report
Statista - Crowdfunding, Statistics and Facts
Global Journal of Accounting and Finance - What Drives the Likelihood of Obtaining Capital in Online Crowdfunding


