Table of contents

Key Takeaways
- Only 22% of home service businesses track conversions beyond pageviews, leaving 78% spending $3K–$30K/month on ads with no true attribution in place.
- Multi-touch attribution adopters report an 18% average ROI lift, 22% better lead quality, and 15% lower customer acquisition cost compared to single-touch models.
- Countertop fabrication shops with a working CRM close 5–15% more qualified leads, translating to roughly $200K extra revenue on a $2M shop.
- Call tracking reduces cost per lead by 10% and boosts call lead-to-close rates by 7% for home services businesses using dynamic number insertion.
- 84% of marketers now use blended MER (revenue ÷ all marketing spend) as their primary attribution metric, surpassing platform-reported ROAS.
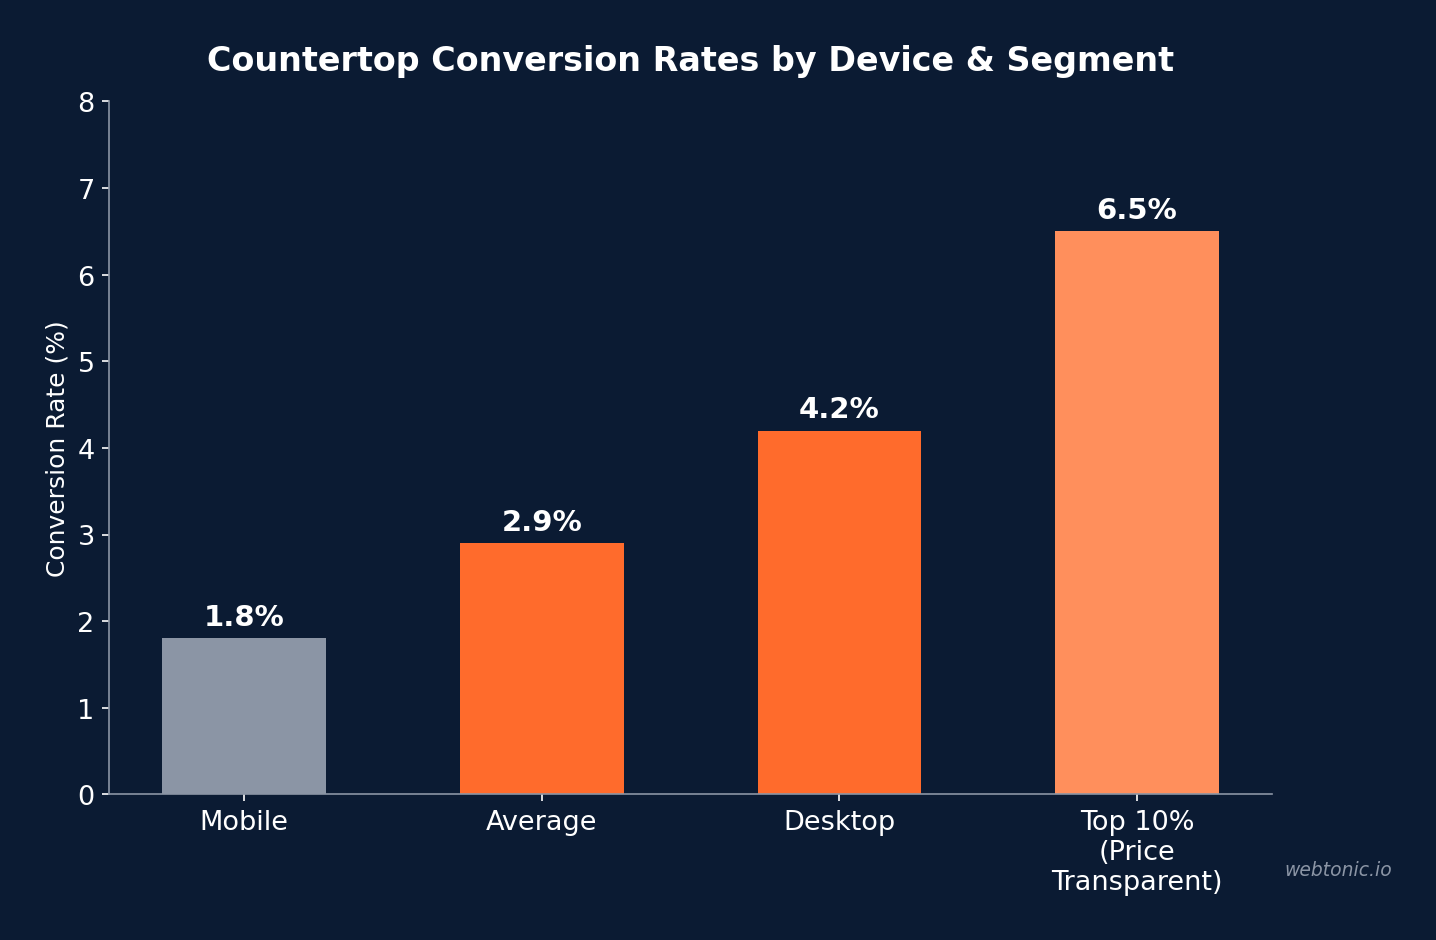
- The average countertop manufacturer conversion rate is 2.9%, but top-10% shops with pricing transparency hit 6.5%.
Countertop Marketing Attribution Benchmarks at a Glance
| Metric | Benchmark | Source |
|---|---|---|
| Average Conversion Rate | 2.9% | CuFinder, 2026 |
| Top-10% Conversion Rate | 6.5% | CuFinder, 2026 |
| Desktop Conversion Rate | 4.2% | CuFinder, 2026 |
| Mobile Conversion Rate | 1.8% | CuFinder, 2026 |
| Search CPL (Countertops) | $88 | CuFinder, 2026 |
| Social CPL (Countertops) | $65 | CuFinder, 2026 |
| Call Tracking CPL Reduction | 10% | CallRail, 2026 |
| Multi-Touch ROI Lift | +18% | MarqOps, 2026 |
| Blended MER Adoption | 84% | GrowWithBA, 2026 |
| CRM Close Rate Improvement | +5–15% | Stone World, 2025 |
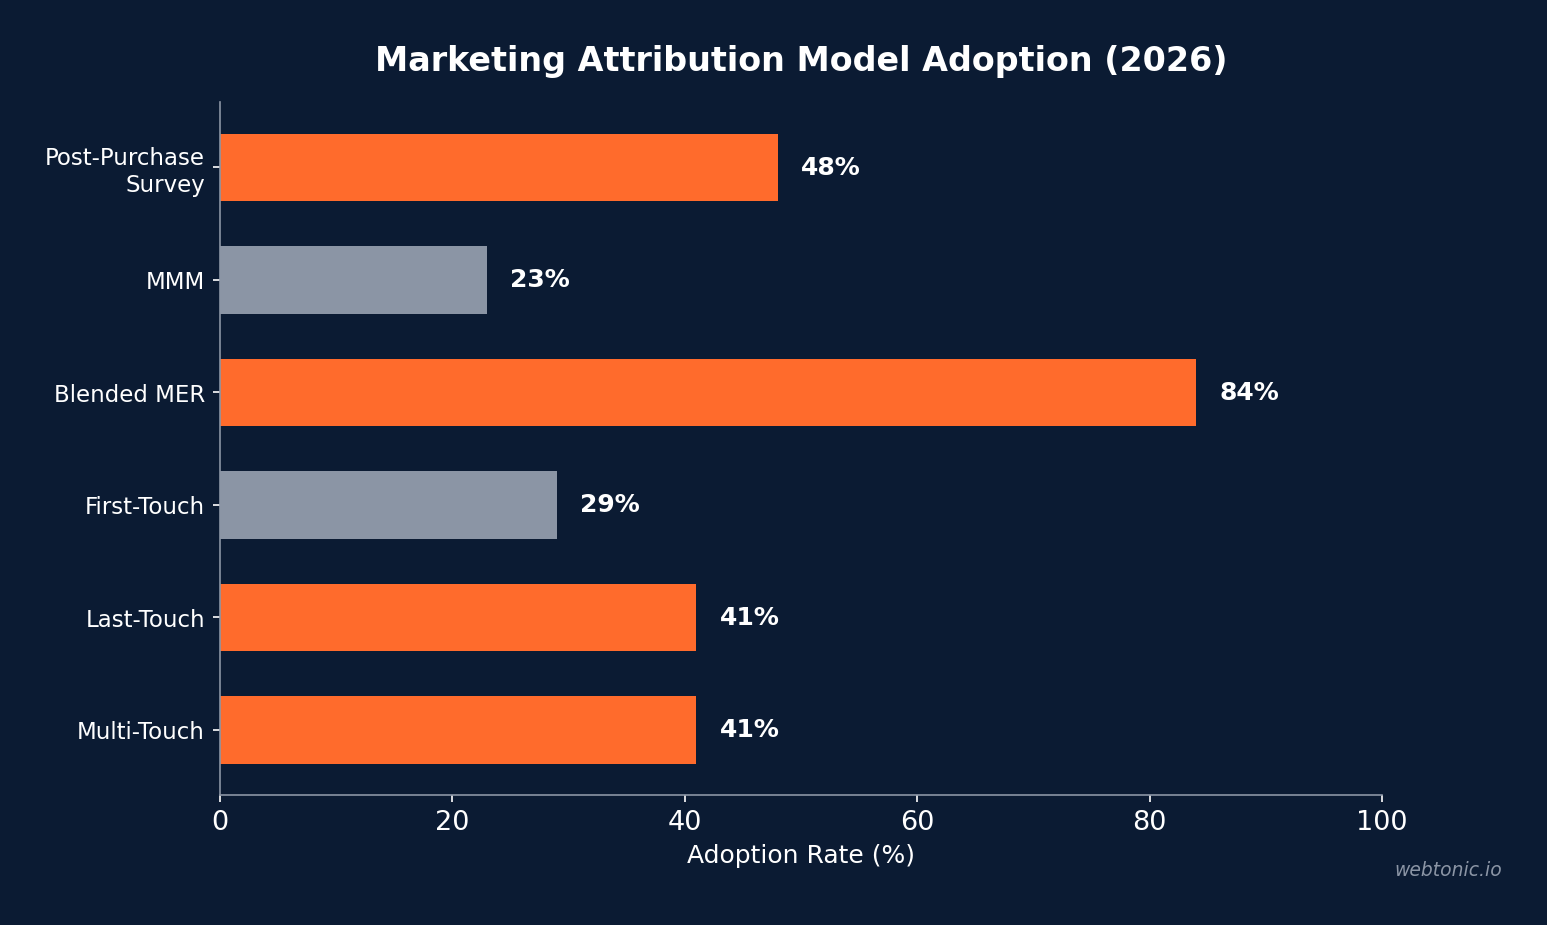
Marketing Attribution Model Adoption in 2026
Attribution has matured from a theoretical exercise into a revenue optimization tool. According to Digital Applied's 140-data-point analysis, multi-touch and last-touch models are nearly tied at 47% vs. 41% adoption, but most high-performing teams now run both simultaneously. Dual-model architecture is the 2026 operating norm for teams spending above $10K/month on paid channels.
MarqOps research reveals that only 41% of marketing teams have adopted multi-touch attribution, yet 67% of B2B marketers still rely on last-touch reporting. The disconnect creates a measurement gap that particularly affects high-ticket industries like countertops, where the sales cycle spans weeks and involves showroom visits, samples, and consultations.
For countertop fabricators, the attribution challenge is compounded by the hybrid online-to-offline customer journey. A homeowner may discover a fabricator through Google Ads, browse the website on mobile, request a sample through Instagram, visit a showroom, and ultimately book through a phone call. Without multi-touch tracking, the phone call gets 100% credit while the digital touchpoints that built trust receive none. Companies using advanced attribution solutions can map these journeys accurately and allocate budgets to the channels genuinely driving revenue.
Conversion Tracking Gaps in the Countertop Industry
The countertop industry shares the tracking deficit common across home services. PipelineOn's benchmarks found that only 22% of home service businesses track conversions beyond pageviews. The remaining 78% spend $3,000–$30,000/month on advertising while judging performance on clicks — a metric that does not predict booked jobs.
Meta Pixel adoption among home service trades averages just 16.5%, with solar contractors leading at 30.2% and electrical contractors trailing at 14.0%, according to PipelineOn's Pixel adoption audit. Countertop businesses, classified under specialty trades, typically fall in the 15–20% range — meaning roughly four out of five countertop advertisers on Meta cannot measure conversions at all.
| Tracking Metric | Adoption Rate | Impact |
|---|---|---|
| Track Conversions Beyond Pageviews | 22% | Baseline measurement capability |
| Meta Pixel Installed (Home Services) | 16.5% | Enables retargeting + conversion tracking |
| Full Pixel + CAPI Stack | 6.0% | Server-side tracking for iOS accuracy |
| Call Tracking Active | ~30% | 10% CPL reduction, 7% close rate boost |
| CRM With Lead Source Tracking | ~20% | 5–15% close rate improvement |
| Post-Purchase Survey | 48% (DTC) | Dark funnel visibility |
ROI Impact of Better Attribution for Countertop Businesses
The financial case for attribution investment is concrete. AMW Group's analysis shows teams that improved attribution accuracy saw a 33% average increase in marketing ROI. For a countertop fabricator spending $5,000/month on ads, that represents roughly $1,650 in additional monthly return — more than enough to cover the cost of a tracking platform.
Multi-touch attribution adopters specifically report 22% better lead quality and 15% lower CAC, per MarqOps. In the countertop industry, where the average search CPL is $88 and average project value ranges from $3,000–$8,000, a 15% CAC reduction saves $13.20 per lead. At 50 leads per month, that totals $660/month in savings from lead acquisition alone.
The GrowWithBA 150-brand study found that 84% of brands now use blended MER as their primary attribution metric, while 72% still track platform-reported ROAS but trust it less. This shift recognizes that no single platform can accurately claim credit in a multi-channel environment — a reality countertop fabricators face daily when customers interact across Google, Meta, showrooms, and referral channels. Investing in growth marketing infrastructure helps map these complex journeys to real revenue.
Call Tracking and Phone Attribution Statistics
Phone calls remain the dominant conversion action for countertop businesses. Unlike e-commerce where transactions happen online, countertop purchases require consultations, measurements, and quotes — all typically initiated by phone. CallRail's home services research shows call tracking reduces cost per lead by 10% and drives a 7% increase in call lead-to-close rates.
The disconnect is alarming: 20–30% of inbound calls to home service businesses never connect, hitting after-hours voicemail, overflow queues, or simply ringing out, according to Convirza's 2026 data. Additionally, 28% of all bookable demand arrives outside standard business hours. Countertop fabricators without call tracking cannot identify these missed revenue opportunities or attribute them to the marketing channels that generated the calls.
Advanced tracking solutions yield a 43% improvement in campaign performance, per RedTrack's aggregated client data cited by PipelineOn. The investment typically ranges from $500–$1,500/month for comprehensive tracking — a fraction of the waste eliminated when campaigns can be optimized against true cost-per-sale rather than vanity clicks.
CRM and Lead Source Tracking in Countertop Fabrication
CRM adoption in the countertop industry lags behind other home services sectors. SlabWise's digital transformation survey reveals the current state: 35% of countertop shops still handle quoting manually, 45% use basic spreadsheets, and only 20% use integrated software. Scheduling is even worse — 50% are fully manual.
Yet the ROI is undeniable. Stone World reports that shops using CRMs see up to 300% improvements in lead conversion rates. SlabWise's CRM comparison puts the improvement more conservatively: shops with a working CRM close 5–15% more qualified leads. On a $2M shop with a 60% close rate, picking up an additional five percentage points equals roughly $200,000 in annual revenue.
| Digital Maturity Metric | Manual / Paper | Basic Digital | Integrated Software |
|---|---|---|---|
| Quoting | 35% | 45% | 20% |
| Scheduling | 50% | 30% | 20% |
| Customer Communication | 60% | 30% | 10% |
| Slab Inventory | 40% | 35% | 25% |
The Dark Funnel Challenge in Countertop Marketing
The "dark funnel" — customer interactions invisible to traditional tracking — is especially large in the countertop industry. A homeowner may see a neighbor's new countertops, browse Pinterest for inspiration, read Reddit threads about quartz versus granite, and mention the project to a contractor who recommends a fabricator. None of these touchpoints appear in any analytics platform, yet they collectively drive the purchase decision.
GrowWithBA's 150-brand study quantifies this blind spot: 48% of DTC brands now use post-purchase surveys to capture dark-funnel data, but adoption in home services is far lower. The study also found that 23% of brands now use marketing mix modeling (MMM) for planning, a methodology that uses statistical analysis rather than click tracking to attribute revenue across channels.
For countertop businesses, the dark funnel typically represents 30–50% of total purchase influence. Word-of-mouth referrals from contractors account for over 40% of countertop purchases according to NKBA research, yet these referrals rarely appear in digital attribution reports. Fabricators who combine digital tracking with offline attribution methods — referral codes, QR-coded showroom materials, and post-sale surveys — capture a significantly more accurate picture of their marketing effectiveness.
The contractor referral network is particularly important for attribution planning. SlabWise's industry data shows the US countertop market at $22.1 billion with 8,000–10,000 fabrication shops. In this fragmented landscape, contractor relationships are the single largest lead source for most fabricators — yet they are entirely invisible to digital attribution tools. Tracking contractor referral sources through CRM tagging and unique phone numbers closes one of the biggest blind spots in countertop marketing measurement.
Cross-Channel Attribution: Countertop Customer Journey Data
The typical countertop purchase involves 7–12 touchpoints across 3–5 channels over a 2–6 week decision cycle. Understanding this journey is critical for accurate attribution. SlabWise's marketing guide documents the pattern: initial discovery happens on search (42% of traffic is organic), followed by social engagement on platforms like Instagram (1.45% engagement rate) and Meta Ads platforms for visual inspiration.
The mid-funnel is where attribution breaks down most dramatically. Homeowners compare materials, browse galleries, request samples, and discuss options with family — activities that occur largely offline or across devices that are difficult to track. BaaDigi's remodeling benchmarks suggest a 5:1 marketing ROI target for kitchen and bath projects — $5 in revenue for every $1 spent. Achieving this requires understanding which channels drive the top-of-funnel awareness that ultimately leads to showroom visits and signed contracts.
The conversion data further illustrates the device-attribution gap. Desktop users convert at 4.2% while mobile users convert at just 1.8% in the countertop industry, per CuFinder. But mobile often drives the initial discovery — a homeowner searching "countertop fabricator near me" on their phone, then returning on desktop to browse galleries and fill out a quote form. Last-click attribution credits desktop and ignores mobile's critical role, leading fabricators to underinvest in the channel that starts the journey.
Attribution Best Practices for Countertop Marketers
- Implement call tracking with dynamic number insertion (DNI). Since phone calls dominate countertop conversions, DNI is the single highest-impact attribution investment. Budget $200–$500/month for a platform like CallRail or WhatConverts.
- Install Meta Pixel and Conversions API (CAPI) together. Pixel alone misses 20–40% of iOS conversions. CAPI provides server-side tracking that bypasses browser restrictions. Only 6% of home services businesses have this stack — be among them.
- Track cost per booked project, not just CPL. A $90 Google Ads lead that converts to a $6,000 countertop project delivers 67:1 ROAS. A $45 social lead that never visits a showroom is worthless. Revenue attribution per channel is the metric that matters.
- Adopt blended MER as your north star metric. Calculate total revenue divided by total marketing spend monthly. Cross-reference with per-channel data for optimization, but let MER guide overall budget decisions.
- Use a CRM with source tracking from day one. Tag every lead with its originating channel (Google, Meta, referral, home show, contractor). This data compounds — after 12 months, you can model lifetime value by acquisition source and make confident reallocation decisions.
- Run post-purchase surveys to capture dark-funnel data. A two-question "How did you hear about us?" survey at the point of sale captures the word-of-mouth, podcast, and social browsing that no pixel can track. 48% of DTC brands already do this.
Countertop Attribution vs. All-Industry Averages
| Metric | Countertops | All-Industry Avg. | Gap |
|---|---|---|---|
| Conversion Rate | 2.9% | 3.6% | −0.7pp |
| Search CPL | $88 | $91 | −3.3% |
| Social CPL | $65 | $72 | −9.7% |
| Multi-Touch Attribution Adoption | ~15% | 41% | −26pp |
| Call Tracking Adoption | ~30% | 74% | −44pp |
| CRM With Source Tracking | ~20% | 55% | −35pp |
The data reveals a significant attribution maturity gap in the countertop industry. While all-industry call tracking adoption reached 74% in 2026 per Mediahawk's annual survey, countertop fabricators hover around 30%. Multi-touch attribution adoption is even more stark — an estimated 15% for countertop businesses versus 41% across all industries. This gap represents both a challenge and an opportunity: fabricators who invest in attribution infrastructure gain a substantial competitive advantage by outspending on channels that produce booked projects while competitors waste budget on untracked impressions.
Frequently Asked Questions
What is the best attribution model for countertop businesses?
A position-based (U-shaped) model works best for most countertop fabricators, assigning 40% credit to the first and last touchpoints with 20% distributed across middle interactions. Google's data-driven model requires 15,000 clicks and 600 conversions in 30 days — thresholds most countertop businesses never reach. Pair your position-based model with blended MER for a practical, accurate view of marketing performance. For shops spending over $15K/month, consider adding a quarterly marketing mix model review to calibrate digital attribution against actual revenue data.
How much does marketing attribution software cost for countertop businesses?
Expect $500–$1,500/month for comprehensive attribution tracking. This includes call tracking ($200–$500/month), CRM with lead source tracking ($50–$300/month), and analytics platform integration. The investment pays for itself when you eliminate spending on channels that produce clicks but not booked projects — most countertop businesses find 20–30% of their ad spend is wasted once attribution reveals the true numbers.
Why do countertop businesses struggle with attribution more than other industries?
The hybrid online-to-offline purchase journey makes countertop attribution uniquely challenging. A customer may click a Google Ad, browse on mobile, visit a showroom, request samples by email, and book via phone call — touching 5+ channels over 2–6 weeks. Digital-only attribution misses the showroom visit entirely, while phone-only tracking misses the digital touchpoints that built initial awareness and trust.
What percentage of countertop leads come from phone calls vs. online forms?
Phone calls typically account for 60–70% of countertop lead volume, with online form submissions making up the remaining 30–40%. However, 20–30% of inbound calls never connect due to after-hours timing or missed pickups, making call tracking and routing essential for capturing the full lead pipeline.
How quickly do countertop businesses see ROI from better attribution?
Most fabricators see measurable ROI within 60–90 days of implementing comprehensive attribution tracking. The first win typically comes from identifying and eliminating wasted ad spend on non-converting channels, followed by reinvesting those dollars into channels producing booked projects. Teams that improve attribution accuracy report a 33% average increase in marketing ROI according to AMW Group's research. The compounding effect is significant — after 6 months of clean attribution data, fabricators can model customer lifetime value by channel and make budget decisions with high confidence rather than gut feel.
Sources
cufinder.io/blog/benchmarks/countertop-manufacturing
digitalapplied.com/blog/marketing-attribution-statistics-2026
amworldgroup.com/statistics/marketing-attribution-statistics
marqops.com/blog/multi-touch-attribution-guide
growwithba.com/blog/attribution-reality-2026-study
pipelineon.com/blog/marketing-attribution-home-service
callrail.com/blog/home-services-marketing-statistics
slabwise.com/guide/digital-transformation
stoneworld.com — your-crm-should-be-the-single-source-of-truth
slabwise.com/best/best-crm-for-countertop-shops