



Table of contents
Cost per conversion measures how much you spend in advertising to generate a single desired action — whether that is a purchase, a lead form submission, or a phone call. It is the metric that determines whether your PPC campaigns are profitable or bleeding money.
Key Takeaways
- The average cost per conversion across all industries in Google Ads is $66.69 in 2026, according to WordStream's analysis of over 13,000 search advertising campaigns.
- Cost per conversion dropped for the first time in five years in 2026, while conversion rates increased across 87% of industries — a rare double win for advertisers.
- Improving your Quality Score from 5 to 8 can reduce cost per click by up to 37%, which directly lowers your cost per conversion without changing your targeting or bidding.
- The formula for cost per conversion is simple: Total Ad Spend ÷ Number of Conversions = Cost Per Conversion (CPC). Also known as cost per acquisition (CPA).
- Industries with the highest cost per conversion include legal ($111.05), home services ($93.12), and B2B ($100.48), while e-commerce and automotive tend to run significantly lower.
Whether you manage Google Ads campaigns for a local business or oversee six-figure monthly budgets for an enterprise brand, understanding and optimizing cost per conversion is essential to maximizing your return on investment (ROI). This guide covers how to calculate cost per conversion, what benchmarks look like by industry, and the proven strategies that reduce it without sacrificing lead quality or conversion volume.
What Is Cost Per Conversion
Cost per conversion — also called cost per acquisition (CPA) — is a PPC metric that tells you how much money you spend in advertising to generate one conversion. A conversion can be any action you define as valuable: a purchase, a phone call, a form submission, an email signup, a download, or a chat initiation.
The formula to calculate cost per conversion is straightforward:
Cost Per Conversion = Total Ad Spend ÷ Number of Conversions
For example, if you spend $5,000 on a Google Ads campaign and generate 100 leads, your cost per conversion is $50. If your average customer lifetime value (LTV) is $500, that $50 CPA represents a 10:1 return on ad spend — an excellent result for most businesses.
Cost per conversion is different from cost per click (CPC), which measures how much you pay for each click on your ad regardless of whether that click converts. It is also different from cost per mille (CPM), which measures cost per thousand impressions. While CPC and CPM measure traffic acquisition costs, cost per conversion measures actual business outcome costs — making it the most meaningful KPI for performance-driven advertisers.
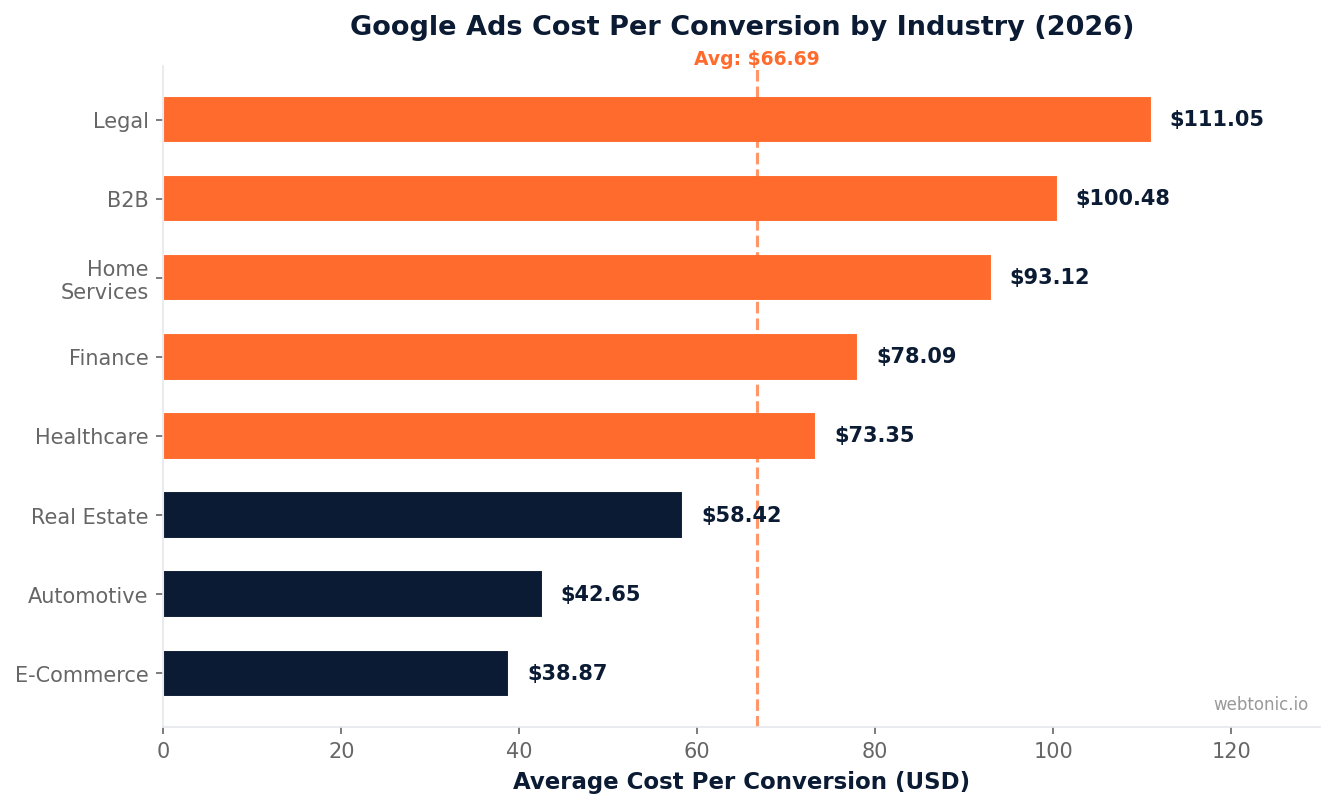
Average Cost Per Conversion by Industry (2026 Benchmarks)
Understanding what a "good" cost per conversion looks like requires industry context. According to WordStream's 2026 Google Ads Benchmarks, the overall average cost per lead (CPL) across all industries is $66.69. However, the range varies dramatically by industry and business model.
| Industry | Avg. Cost Per Conversion | Avg. Conversion Rate | Avg. CPC |
|---|---|---|---|
| Legal | $111.05 | 4.3% | $4.66 |
| B2B | $100.48 | 3.7% | $5.42 |
| Home Services | $93.12 | 6.1% | $3.95 |
| Finance & Insurance | $78.09 | 5.6% | $4.01 |
| Healthcare | $73.35 | 5.8% | $3.19 |
| Real Estate | $58.42 | 4.2% | $2.10 |
| E-Commerce | $38.87 | 6.8% | $1.72 |
| Automotive | $42.65 | 7.1% | $2.14 |
One important note from the 2026 benchmarks: cost per lead went down for the first time in five years, breaking a trend of steady increases. At the same time, conversion rates increased across 87% of industries. This rare combination means that advertisers are getting more conversions at a lower cost — likely driven by improvements in conversion tracking, smarter bidding algorithms, and better landing page optimization.

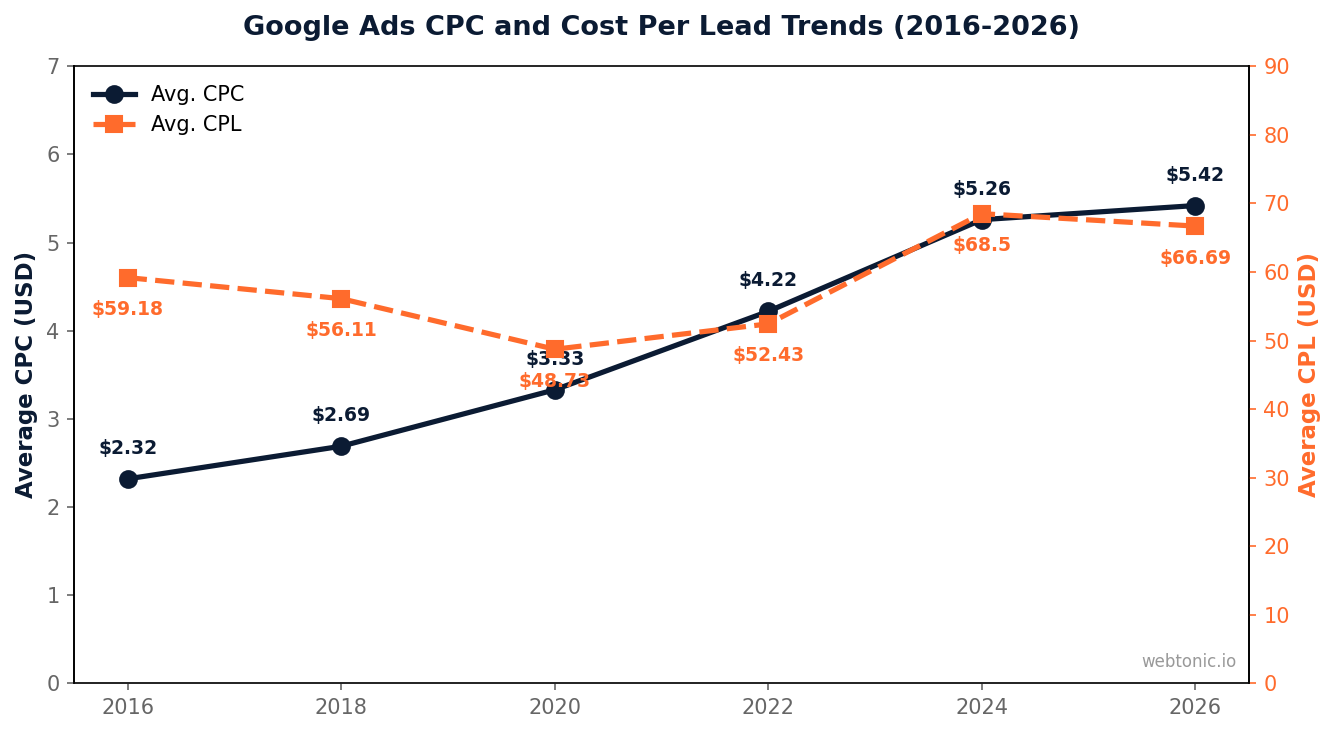
However, costs have increased significantly over the long term. The average CPC is now over twice what it was in 2016 ($5.42 vs. $2.32), and CPL has risen approximately 13% from $59.18 to $66.69. Factors like inflation, increased competition, and privacy-driven signal loss have all contributed to rising acquisition costs.
How to Calculate Cost Per Conversion
While the basic formula is simple (Total Ad Spend ÷ Number of Conversions), applying it correctly requires understanding which costs to include and how to attribute conversions accurately.
Include All Relevant Costs
Your total cost should include every dollar spent to generate the conversion: ad spend, management fees, creative production, and landing page costs. If you spend $10,000 on Google Ads and $2,000 on agency management, your true cost per conversion includes both. Using ad spend alone underestimates your real acquisition cost by 15–25% in most cases.
Define Your Conversion Actions Precisely
Not all conversions are created equal. A "conversion" in Google Ads might include micro-conversions (newsletter signups, content downloads) alongside macro-conversions (purchase completions, qualified lead submissions). Mixing them inflates your conversion count and artificially lowers your reported CPA. Track and report macro-conversions separately to get an accurate picture of your actual cost per acquisition.
Account for Attribution
In a multi-channel marketing mix, attributing conversions correctly matters. A user who clicks your Google ad but converts through a direct visit three days later should still count toward your Google Ads cost per conversion. Use data-driven attribution models in Google Ads and connect your analytics platform to capture the full conversion path.
| Metric | Formula | What It Measures |
|---|---|---|
| Cost Per Conversion (CPA) | Total Ad Spend ÷ Conversions | Cost to acquire one customer or lead |
| Cost Per Click (CPC) | Total Ad Spend ÷ Clicks | Cost for each ad click, regardless of outcome |
| Cost Per Mille (CPM) | Total Ad Spend ÷ (Impressions ÷ 1,000) | Cost per thousand ad impressions |
| Conversion Rate | Conversions ÷ Clicks × 100 | Percentage of clicks that become conversions |
| Return on Ad Spend (ROAS) | Revenue from Ads ÷ Ad Spend | Revenue generated per dollar spent on ads |
| Customer LTV | Avg. Order Value × Purchase Frequency × Customer Lifespan | Total revenue a customer generates over time |
9 Proven Strategies to Reduce Cost Per Conversion
Lowering your cost per conversion does not mean spending less — it means making every dollar work harder. Here are the nine most effective strategies, ranked by typical impact.
1. Improve Quality Score. Quality Score is the single biggest lever for reducing costs in Google Ads. It is a 1-to-10 rating that Google assigns to each keyword based on expected click-through rate (CTR), ad relevance, and landing page experience. Raising your Quality Score from 5 to 8 can reduce CPC by up to 37%, which directly lowers your cost per conversion without any change to targeting or bidding. Focus on aligning your ad copy to search intent — Google's own guidance recommends, organizing keywords into tightly themed ad groups, and improving landing page load speed and content relevance.
2. Optimize Landing Pages. A 1-second improvement in page load speed can increase conversions by 7%, according to Google's performance research. Beyond speed, your landing page must deliver on the promise of your ad. Match the headline to the search query, remove unnecessary navigation, add social proof (testimonials, trust badges, case studies), and make the CTA button visually dominant.
3. Refine Keyword Targeting. Broad match keywords cast a wide net but often attract irrelevant clicks that burn budget without converting. Review your search terms report weekly, add negative keywords aggressively, and consider shifting high-performing terms to phrase or exact match. Negative keyword lists can reduce wasted spend by 10–20% in most accounts.
4. Use Smart Bidding Strategically. Google's Target CPA bidding strategy automates bid adjustments to hit a target cost per conversion you set. It works best in campaigns with at least 30 conversions per month — below that threshold, the algorithm lacks sufficient data to optimize effectively. For newer campaigns, start with Maximize Conversions and switch to Target CPA once you have enough historical conversion data.
5. Write More Relevant Ad Copy. Ad copy that closely matches the user's search intent earns higher CTR and Quality Score, which lowers CPC and CPA simultaneously. Include your primary keyword in the headline, highlight a unique value proposition, and use a strong call to action. Ads with the search term in the headline achieve 15% higher CTR on average compared to generic headlines.

6. Implement Conversion Tracking Properly. You cannot optimize what you cannot measure. Ensure every valuable conversion action is tracked — phone calls, form submissions, purchases, and chat initiations. Use Google Tag Manager for clean implementation, enable enhanced conversions for better match rates, and verify your tracking is firing correctly before scaling spend.
7. Test Ad Scheduling. Not every hour of the day delivers equal conversion value. Analyze your campaign data by hour and day of week to identify when your cost per conversion is lowest. Increase bids during high-converting windows and reduce or pause ads during low-performing hours. For B2B advertisers, weekday business hours typically outperform evenings and weekends by 30–50% on CPA.
8. Use Audience Layering. Layer audience signals (remarketing lists, in-market audiences, customer match) on top of your keyword targeting to prioritize users who are most likely to convert. Remarketing audiences convert at 2–3× the rate of cold traffic, so increasing bids for these audiences effectively lowers your blended CPA across the campaign.
9. Monitor and Prune Regularly. Set a weekly review cadence to pause underperforming keywords, ads, and placements. The top 20% of keywords typically drive 80% of conversions — reallocating budget from low-performers to proven winners is the fastest way to reduce overall cost per conversion.
Cost Per Conversion vs. Other PPC Metrics
Understanding how cost per conversion relates to other PPC metrics helps you interpret campaign performance correctly and avoid common misinterpretations.
CPC vs. CPA. Cost per click tells you how much each click costs, while cost per acquisition tells you how much each conversion costs. A campaign with a low CPC but a poor conversion rate will have a high CPA — cheap clicks that do not convert are worse than expensive clicks that do. Always optimize for CPA over CPC when conversion tracking is in place.
CPM vs. CPA. Cost per mille is most relevant for awareness campaigns where the goal is impressions rather than direct response. For performance marketing campaigns, CPA is the primary success metric because it measures actual outcomes.
ROAS vs. CPA. Return on ad spend measures revenue generated per dollar spent, while CPA measures cost per conversion regardless of revenue. E-commerce advertisers typically optimize for ROAS because conversions have variable values (a $50 purchase vs. a $500 purchase), while lead generation advertisers optimize for CPA because each lead has roughly the same value until it enters the sales pipeline.
Frequently Asked Questions
What is a good cost per conversion?
A good cost per conversion depends entirely on your industry, business model, and customer lifetime value. As a general rule, your CPA should be no more than 20–30% of your average customer LTV. If your average customer generates $1,000 in revenue over their lifetime, a CPA of $200–$300 is sustainable. The industry averages from WordStream's 2026 benchmarks range from $38.87 (e-commerce) to $111.05 (legal), but these are averages — top-performing advertisers in every industry achieve CPAs 30–50% below these figures.
How do I calculate cost per conversion in Google Ads?
Google Ads automatically calculates and displays cost per conversion in the Campaigns, Ad Groups, and Keywords views. Navigate to Columns, click Modify Columns, and ensure "Cost/conv." is selected under the Conversions category. The metric is calculated as Total Cost ÷ Conversions for any date range you select. You can also segment by conversion action to see CPA for specific conversion types (calls vs. forms vs. purchases).
Why is my cost per conversion increasing?
Rising cost per conversion typically stems from one of five causes: increased competitor bidding driving up CPCs, declining ad relevance reducing Quality Score, landing page issues lowering conversion rates, conversion tracking errors undercounting actual conversions, or audience saturation causing ad fatigue. Start diagnosing by checking your Quality Score trend, then review conversion rate by device, landing page, and ad group to isolate the root cause.
Is cost per conversion the same as cost per acquisition?
Yes, in most PPC contexts, cost per conversion and cost per acquisition (CPA) are used interchangeably. Both measure the total advertising cost divided by the number of desired actions (conversions). Some marketers use "cost per acquisition" specifically for customer acquisitions (purchases, signups) and "cost per conversion" more broadly to include any tracked conversion action, but in Google Ads and most advertising platforms the terms are functionally identical.
What is the difference between cost per conversion and cost per lead?
Cost per lead (CPL) is a specific type of cost per conversion where the "conversion" is defined as a lead (form submission, phone call, chat request). Cost per conversion is the broader term that includes all conversion types — purchases, downloads, signups, and leads. In lead generation businesses, CPL and CPA are effectively the same metric. In e-commerce, CPA typically refers to the cost of acquiring a purchase, not just a lead.
Sources
wordstream.com/2026-google-ads-benchmarks
web.dev/articles/vitals
support.google.com/quality-score
support.google.com/smart-bidding
adexpert.io/lower-google-ads-cost-per-conversion
blog.hubspot.com/cost-per-acquisition


