Table of contents

The conversion rate on your dashboard is a measurement, not a fact. Roughly half of iOS users still opt out of tracking in 2026, and Google's own data shows consented users converting several times more often than unconsented ones - which means a chunk of your reported CPL, CTR and CVR is shaped by tracking accuracy before it reflects buyer behaviour at all.
Key Takeaways
- 50% of iOS users globally now consent to tracking, up 10 points since ATT launched in 2021.
- Consented users convert 2 to 5 times more often than unconsented users, per Google.
- Server-side tracking adoption sits at 30-40% across the top 1,000 websites.
- Google Ads requires 700 ad clicks over 7 days before consent mode modeling activates.
- France leads opt-in at just under 51%; Germany sits at 47%.
- iOS ad spend grew 26% from 2023 to 2024, versus 10% growth on Android.
- 42% of apps increased iOS ad investment between Q1 2024 and Q1 2025.
- Developer adoption of the ATT prompt itself rose 71% since 2021.
- Non-organic iOS installs rose 29% year over year, versus 21% on Android.
- Average Google Ads CVR is 8.18%, but that figure already includes platform-side modeling.
- Average cost per lead is $66.69, the first year-over-year fall in five years.
- 90.2% of marketers use GA4 as their default measurement tool.
- Only 63.5% of marketers base most decisions on what GA4 shows, which defaults to last-click.
- 84% of marketers are confident marketing impacts revenue, but far fewer can prove it.
The iOS opt-in number that has not moved much in years
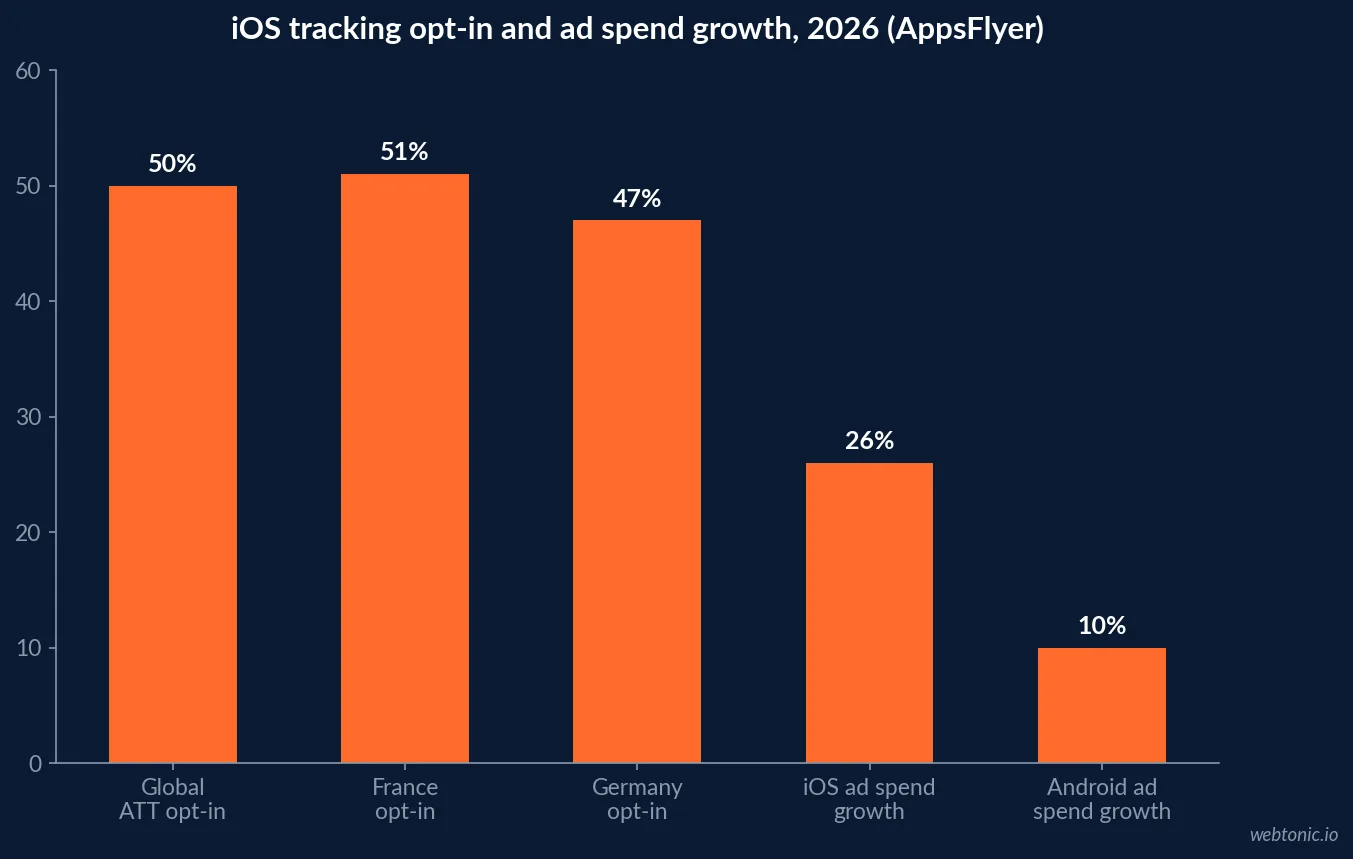
App Tracking Transparency is now old enough to have a stable baseline, and that baseline is close to a coin flip. AppsFlyer's four-years-after-ATT analysis found 50% of app users globally now consent to tracking, a 10-point increase since the framework rolled out in April 2021. Regional variation is modest: France sits just under 51%, Germany at 47%. Whatever your platform reports as a conversion, roughly half of the iOS audience behind it opted out of being directly tracked to get there.
Spend has followed anyway. AppsFlyer reports iOS ad spend grew 26% from 2023 to 2024, more than double Android's 10% growth, and 42% of apps increased their iOS ad investment between Q1 2024 and Q1 2025 - advertisers have adapted their measurement approach rather than pulling back from the platform.
| ATT / iOS tracking metric (2026) | Figure | Source |
|---|---|---|
| Global ATT opt-in rate | 50%, +10pp since 2021 | AppsFlyer |
| France opt-in rate | ~51% | AppsFlyer |
| Germany opt-in rate | 47% | AppsFlyer |
| iOS ad spend growth, 2023-2024 | +26% | AppsFlyer |
| Android ad spend growth, same period | +10% | AppsFlyer |
| Apps increasing iOS investment, Q1'24-Q1'25 | 42% | AppsFlyer |
| Developer ATT prompt adoption since 2021 | +71% | AppsFlyer |
Why a rising conversion rate might just be a rising consent rate
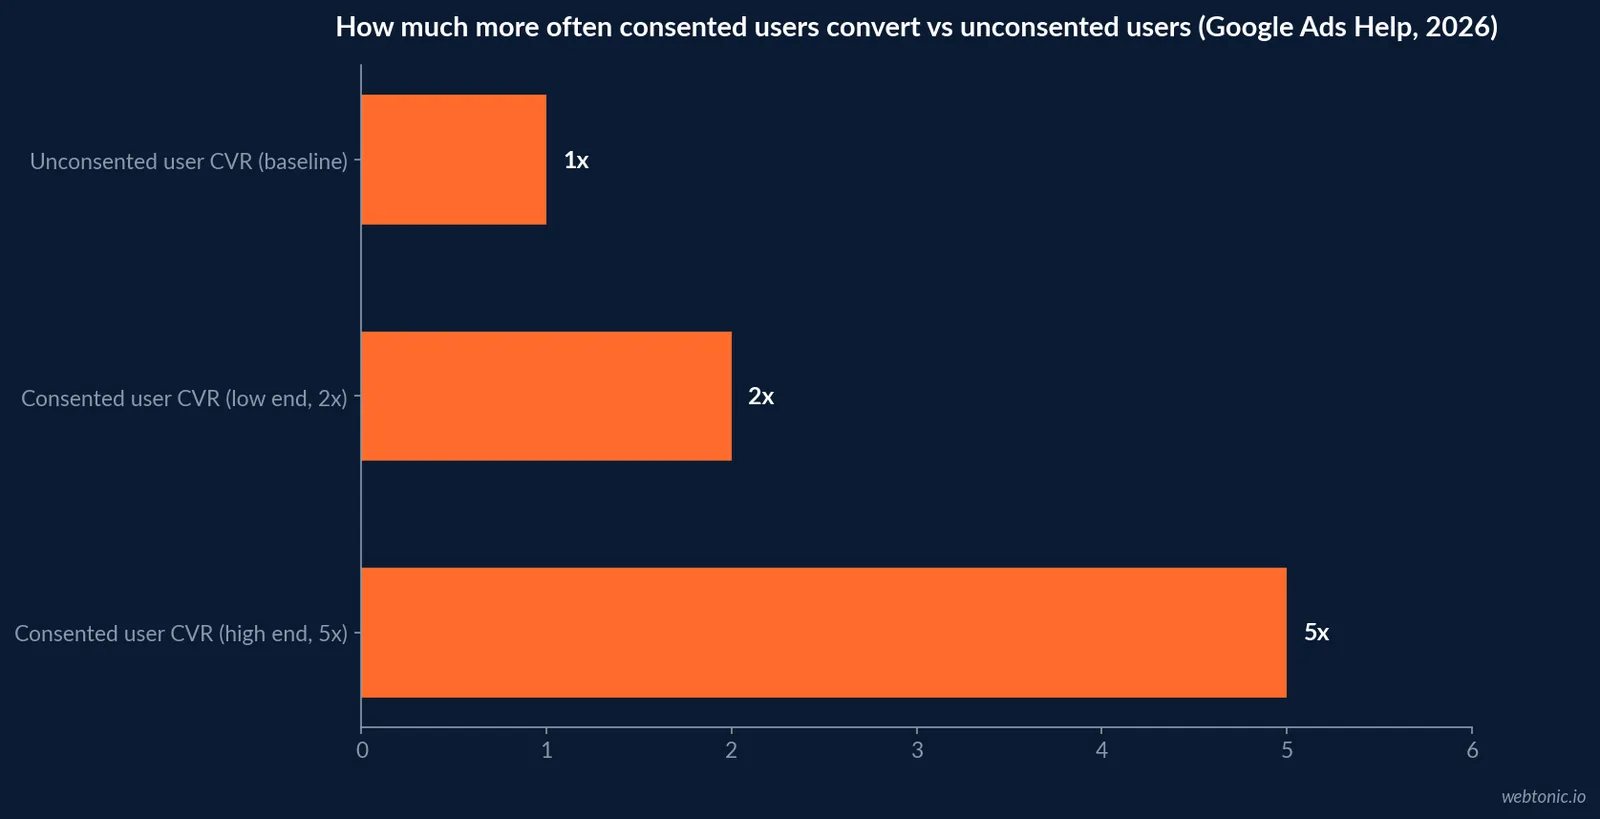
Google is unusually direct about this in its own documentation. Google Ads Help's guidance on consent mode modeling states plainly that consented users are typically 2 to 5 times more likely to convert than unconsented users in the data it observes. The platform then uses AI to model the unconsented journeys based on observable, consented ones - which is a genuine improvement over simply losing the data, but it means a meaningful share of "conversions" in your reporting are modeled estimates, not observed events.
There is a hard floor on when that modeling even activates: Google requires a minimum of 700 ad clicks over a 7-day period, per country and domain grouping, before conversion modeling for consent mode kicks in. Below that threshold - common for a new campaign, a smaller account, or a narrow geography - there is no model filling the gap, and the reported conversion rate simply reflects whatever share of users happened to consent.
| Consent mode mechanic | Detail | Practical effect |
|---|---|---|
| Consented vs unconsented conversion rate | Consented users convert 2-5x more often | Reported CVR skews with the consent rate, not just buyer intent |
| Minimum activation threshold | 700 ad clicks / 7 days, per country + domain | Small accounts see a bigger unmodeled gap |
| What gets modeled | Ad-click-to-conversion paths for unconsented users | Fills reporting gaps; cannot recover true ad-attribution certainty |
| Where it shows up | 'Conversions' and 'Conversion value' columns | Looks identical to observed data in-platform |
Server-side tracking is becoming the default fix, not a novelty
The structural response to eroding client-side signal is moving data collection off the browser entirely. IAB Tech Lab estimates server-side adoption at 30-40% across the top 1,000 websites as of 2026, citing an internal Addingwell study, with steady growth in server-side request volume over the past year. The appeal is structural: server-side setups sidestep Safari's ITP and Firefox's Enhanced Tracking Protection because the data never depends on a browser-executed pixel surviving in the first place.
The tradeoff is real. A server-side migration adds infrastructure overhead, still cannot resolve consent status on a user's very first visit, and creates new auditability requirements - there is no standardised way yet to prove to a regulator exactly which vendor accessed what data and when.
The reported benchmarks already assume some of this modeling
It matters for how you read published CPL, CTR and CVR benchmarks. WordStream's 2026 data, an average CVR of 8.18% and CPL of $66.69 across 13,000-plus campaigns, is pulled from accounts large enough to clear Google's modeling thresholds in most cases. A smaller advertiser, or one running in a market with lower consent rates, should expect its own raw numbers to sit below that published average for measurement reasons alone - not because the campaigns are performing worse.
The tool most teams use to sanity-check all of this has its own blind spot. Ruler Analytics' 2026 research found 90.2% of marketers default to GA4, and 87.5% trust the data in it, yet GA4's default model is last-click and only 63.5% of respondents say they base most decisions on it despite that limitation - and separately, 84% of marketers say they are confident marketing impacts revenue even though far fewer can prove it end to end.
| What gets published vs what a smaller account should expect | Published benchmark | Adjustment to expect |
|---|---|---|
| Conversion rate | 8.18% average (WordStream 2026) | Lower on accounts below the 700-click/7-day modeling threshold |
| Cost per lead | $66.69 average (WordStream 2026) | Higher effective CPL where iOS/privacy-conscious traffic is large |
| Attribution completeness | GA4 used by 90.2% of marketers | Last-click bias unless a multi-touch model is layered on |
| Confidence in revenue impact | 84% confident, per Ruler Analytics | Fewer can demonstrate it without server-side or CRM-linked data |
The measurement budget competes with every other martech line
Fixing a tracking gap costs money, and that money comes from the same shrinking pool as everything else in the stack. Adweek's coverage of AppsFlyer's data shows opt-in climbing unevenly by market - Germany at 47%, France at 53%, the UK at 46% as of Q1 2024 - which means a single global tracking fix will under- or over-correct depending on where your traffic actually comes from. Meanwhile Gartner's 2026 CMO Spend Survey, reported by Chief Marketer, found martech's share of the marketing budget at a five-year low of 19.4% - the exact line item a server-side tracking migration or a CAPI build usually has to compete inside.
Developer-side signals confirm the shift is durable
The privacy shift is not a one-time event marketers are waiting out - it is structural on the developer side too. AppsFlyer reports developer adoption of the ATT prompt itself rose 71% since 2021, and non-organic iOS installs - downloads driven by paid marketing rather than organic discovery - grew 29% year over year, ahead of Android's 21%. Gaming and non-gaming categories both increased ATT prompt adoption substantially since Q2 2021, at 53% and 80% respectively.
Rising prompt adoption alongside a stable ~50% opt-in rate means more apps are asking for permission, not fewer - the tracking gap is a permanent feature of the ecosystem to design around, not a temporary dip waiting for a policy reversal.
| Developer-side ATT signal (2026) | Figure | Source |
|---|---|---|
| Developer ATT prompt adoption since 2021 | +71% | AppsFlyer |
| Non-organic iOS installs, YoY | +29% | AppsFlyer |
| Non-organic Android installs, YoY | +21% | AppsFlyer |
| Gaming app ATT prompt adoption since Q2 2021 | +53% | AppsFlyer |
| Non-gaming app ATT prompt adoption since Q2 2021 | +80% | AppsFlyer |
The data-access gap sitting behind every tracking fix
Better pixels and server-side setups only help if the underlying customer data is actually connected. Salesforce's Tenth Edition State of Marketing Report, surveying nearly 4,500 marketers, found only 58% have complete access to service data, 56% to sales data and 51% to commerce data - the three data sources that any conversion tracking fix, modeled or server-side, ultimately has to reconcile against to credit a conversion to the right channel. Teams with unified data are 42% more likely to respond to customers reliably and 60% more likely to use AI agents to help do it, which is the same infrastructure a tracking fix depends on.
| Data access gap (2026) | Figure | Source | Why it matters for tracking |
|---|---|---|---|
| Complete access to service data | 58% | Salesforce | Needed to reconcile support-driven conversions |
| Complete access to sales data | 56% | Salesforce | Needed to close the loop on offline conversions |
| Complete access to commerce data | 51% | Salesforce | Needed to match a modeled conversion to real revenue |
| Teams with unified data replying reliably | 42% more likely | Salesforce | Unified data is a tracking-accuracy multiplier |
What to check before trusting this quarter's conversion numbers
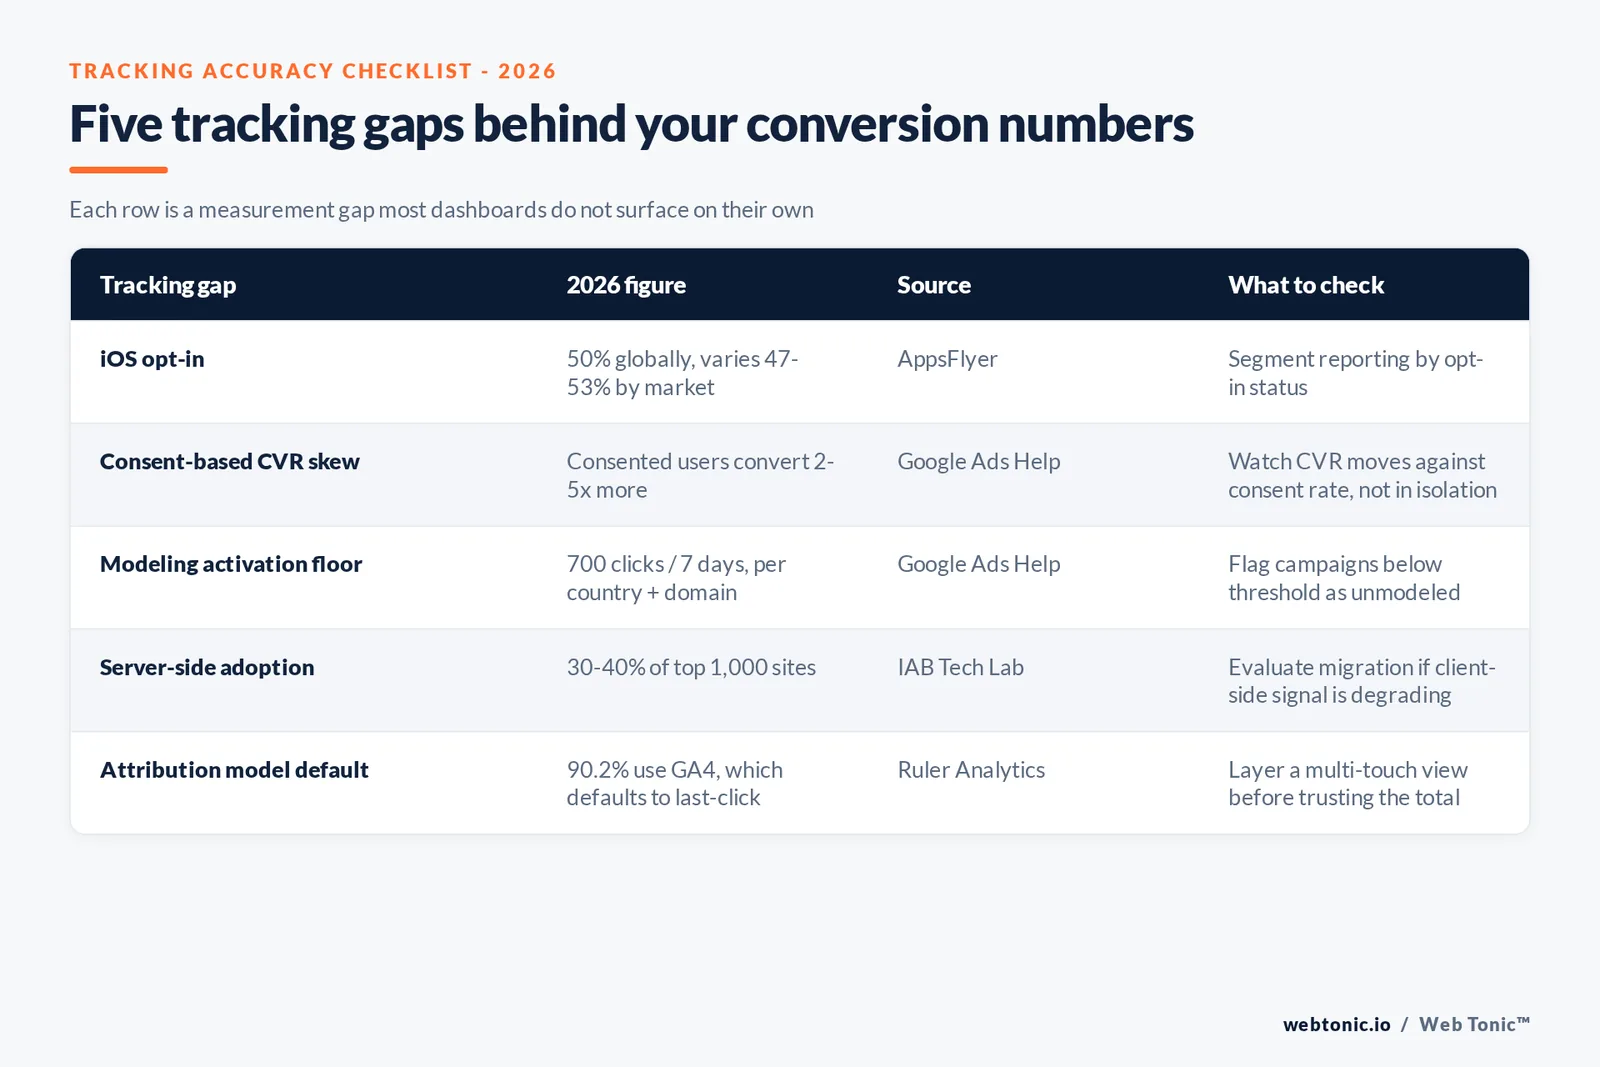
Check your consent rate trend line alongside your conversion rate trend line - if they move together, part of your "performance change" is a measurement change. Confirm which campaigns clear Google's 700-click/7-day modeling threshold and treat the ones that don't as under-reported by default. If iOS or EU traffic is a meaningful share of your funnel, budget time to evaluate server-side tracking rather than assuming pixel-based data alone will hold up through 2026 and beyond.
Our data and analytics practice audits exactly this gap between reported and real conversion volume before recommending a fix, and our breakdown of what Google Ads actually costs in 2026 is a useful companion once your tracking baseline is trustworthy again. Talk to us if you want that audit run against your own accounts.
Frequently Asked Questions
How much of my iOS conversion data am I actually missing?
Roughly half, and it has been stable for years. AppsFlyer's four-years-after-ATT analysis found 50% of iOS users globally now consent to tracking, up 10 percentage points since the 2021 rollout - meaning the other half of iOS conversions are invisible to standard pixel-based tracking unless a server-side or modeled solution fills the gap. Opt-in varies by market: roughly 51% in France and 47% in Germany, per the same data.
Does a rising or falling conversion rate always reflect real buyer behaviour?
Not necessarily. Google's own documentation on consent mode modeling states that consented users are typically 2 to 5 times more likely to convert than unconsented users in the reported data. If your consent rate shifts - a new cookie banner, a regional rollout, a policy change - your reported conversion rate can move for measurement reasons alone, before any change in actual buyer behaviour.
Is server-side tracking worth the migration effort?
For most mid-size and larger sites, the direction is already set. IAB Tech Lab estimates server-side adoption at 30-40% across the top 1,000 websites as of 2026, driven by resilience to Safari's ITP, Firefox's Enhanced Tracking Protection and ad blockers - all of which erode client-side signal regardless of consent. The tradeoff is real infrastructure and governance overhead, not a plug-and-play switch.
What does a 700-click threshold have to do with my conversion data?
Google Ads requires a minimum of 700 ad clicks over 7 days, per country and domain grouping, before consent mode conversion modeling activates. Below that threshold, Google's AI model does not have enough consented-user journeys to reliably estimate what unconsented users likely did, so smaller accounts or newly launched campaigns will show a larger, unmodeled measurement gap than an established account running above the threshold.
Should I trust the CPL and CVR benchmarks I read if tracking gaps are this large?
Use them as directional bands, not precise targets, and adjust them upward for expected under-reporting if a large share of your traffic is iOS or privacy-conscious. WordStream's 2026 benchmarks (CPL averaging $66.69, CVR averaging 8.18%) are built from Google and Microsoft Ads accounts that already benefit from platform-side modeling, so a smaller advertiser without that scale should expect its raw, unmodeled numbers to under-report versus the published average.
Sources
eCommerceNews - AppsFlyer four-years-after-ATT data
Google Ads Help - About consent mode modeling
IAB Tech Lab - Server-side implementations for AdTech
WordStream - 2026 Google Ads Benchmarks
Ruler Analytics - 150+ Marketing Attribution Statistics
Adweek - AppsFlyer data reveals increase in ad spend on iOS
Chief Marketer - Gartner 2026 CMO Spend Survey coverage
Salesforce - Tenth Edition State of Marketing Report, 2026