Table of contents
Content advertising is paid distribution for content you already own: you buy impressions for an article, video or guide instead of a product page. The asset does the selling; the buy only decides who sees it.
Key Takeaways
- Content advertising is a distribution decision, not a writing decision. The same asset can run as an in-feed placement, a social post or a Discovery-style ad — only the buy changes.
- Average CTR on Google Search paid ads sits at 4–6%, and display CTR is materially lower, so content ads are usually bought on impressions rather than clicks (WordStream).
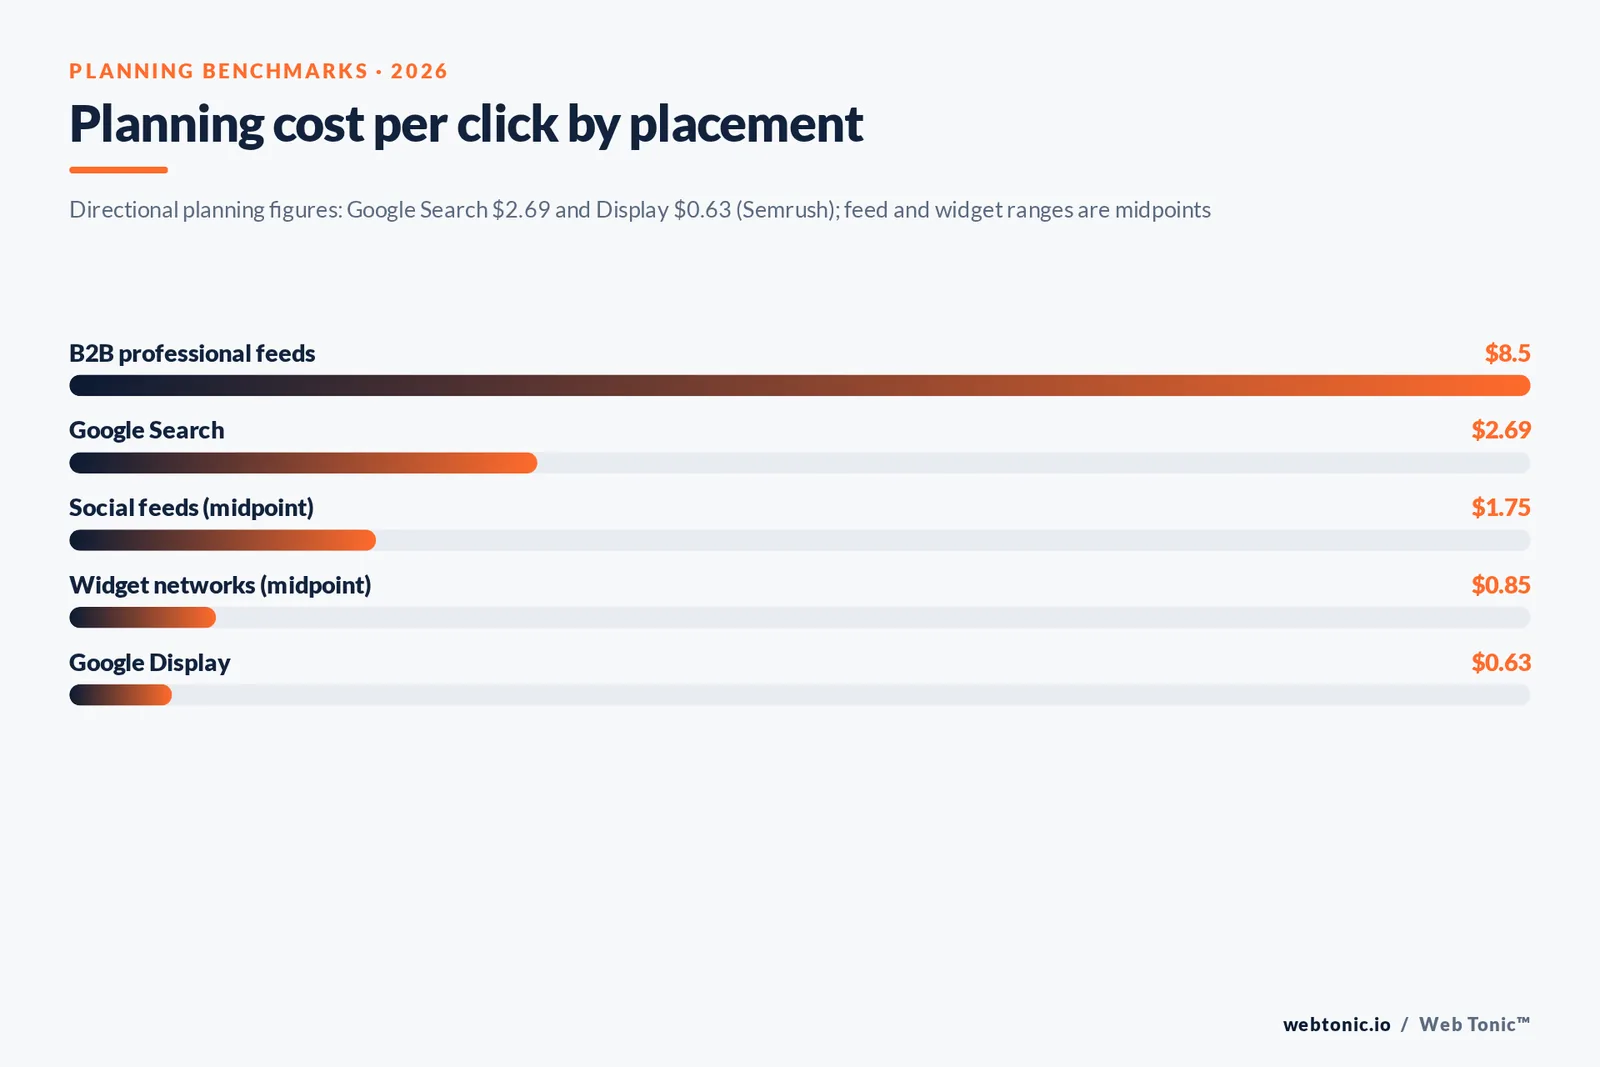
- Benchmark click costs to plan against: $2.69 average CPC on Google Search versus $0.63 on the Display Network (Semrush).
- The FTC treats deceptively formatted content as a Section 5 violation: disclosures must be in front of or above the headline, not below the unit.
- Most teams amplify fewer than 3 in 10 of their published assets. Ranking assets by proven organic engagement before spending is the single biggest efficiency lever in this channel.
What content advertising actually is
Content advertising is the promotion, with money, of an editorial asset — an article, a guide, a report, a video, a tool — to an audience that has not asked for it yet. The clicked destination is content, not a checkout. Revenue arrives later, through retargeting, email capture or brand recall, which is why the channel is measured on assisted outcomes rather than last-click sales.
That definition rules two things out. It is not the organic programme, because the budget carries distribution. And it is not a standard direct-response unit, because the landing experience teaches rather than sells. Roughly 60–80% of the spend typically goes to a handful of assets that already earn engagement organically; the rest funds tests.
Content advertising vs content marketing vs sponsored unitvertising
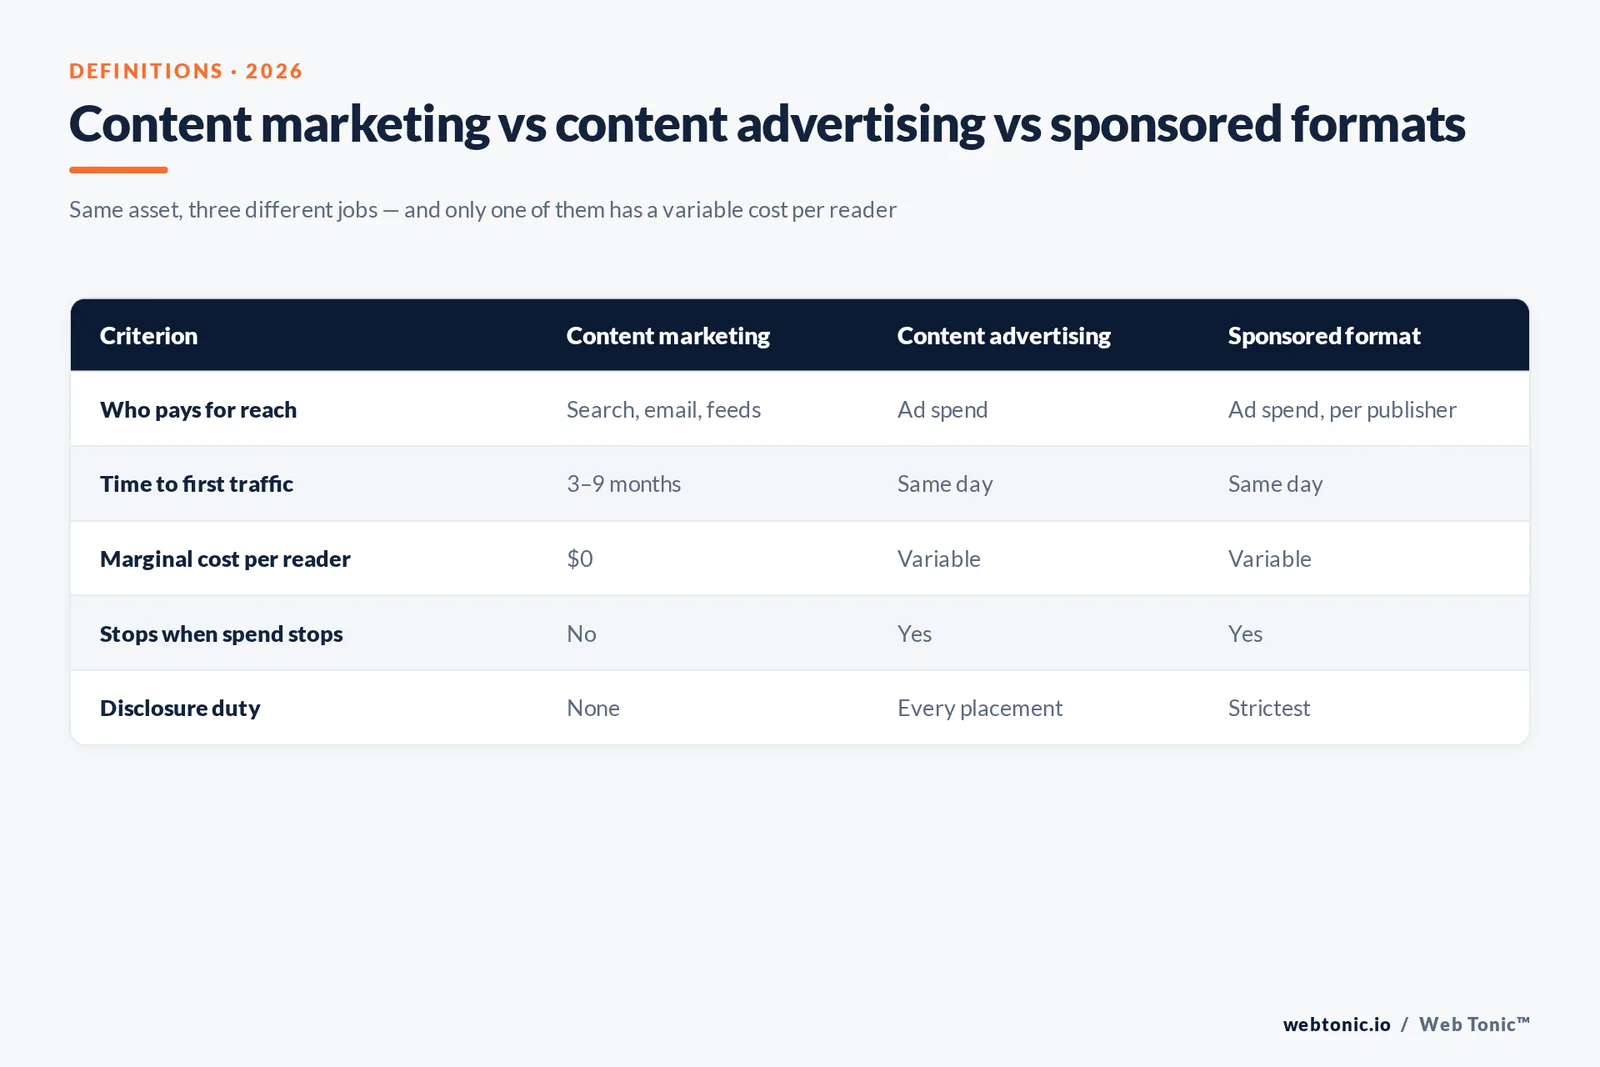
These three terms get used interchangeably and they are not the same thing. Content marketing is the programme, content advertising is the distribution layer inside it, and in-feed formats are one way to deliver it. The table separates them on the criteria that change how you budget.
| Criterion | Content marketing | Content advertising | In-feed format |
|---|---|---|---|
| Core definition | Producing and publishing owned assets | Buying distribution for those assets | An ad format that matches its surroundings |
| Who pays for reach | Search, email, social algorithms | Media budget | Media budget, bought per publisher or network |
| Time to first traffic | 3–9 months | Same day | Same day |
| Cost behaviour | Fixed production cost, free marginal distribution | Variable: every extra reader has a cost | Variable, priced on CPC or CPM |
| Stops when you stop paying | No | Yes | Yes |
| Primary KPI | Organic sessions, rankings | Cost per engaged reader, assisted conversions | CPC, scroll depth, post-click time |
| Disclosure duty | None (owned channel) | Yes, on every placement bought | Yes, and strictest — the format mimics editorial |
Rule 1 — one asset, three jobs. A single guide can be a ranking play, a social piece and a sponsored unit at the same time. Rewriting the headline per channel is cheaper than commissioning three assets. Moz's content marketing primer and Ahrefs on distribution both frame promotion as a separate workstream from production, and budgeting proves them right.
Where to buy distribution, side by side
Where you buy is where these budgets are won or lost. Search buys intent but rarely tolerates an ungated article; feeds buy attention cheaply but demand a hook in the first second; recommendation networks buy curiosity at scale with the weakest qualification. Benchmarks below are directional planning figures, not guarantees.
| Where to buy | Typical buy | Planning CPC | Best asset | Main risk |
|---|---|---|---|---|
| Search | CPC auction on query intent | $2.69 average | Comparison and cost pages | Editorial assets rarely beat product pages on ROAS |
| Display network | CPM or CPC, broad reach | $0.63 average | Report and webinar promos | Banner blindness and low-quality placements |
| Feeds | CPM auction on audience | $0.50–$3.00 | Short video, carousels, listicles | Creative fatigue within 2–3 weeks |
| Widget networks | CPC on publisher inventory | $0.20–$1.50 | Long-form articles and quizzes | Cheap clicks, thin qualification |
| CPC or CPM, job-title targeting | $5.00–$12.00 | Research reports, benchmark data | Highest floor price of any feed | |
| Video and connected TV | CPV or CPM | $0.03–$0.12 per view | Explainers and customer stories | Production cost dwarfs media cost |
| Podcast and newsletter | Flat fee per placement | $25–$50 CPM | Tools, calculators, free courses | No auction, so no fast iteration |
Rule 2 — never buy inventory you cannot exit in 48 hours during a first test. Auction inventory (search, feeds, widgets) let you kill a losing asset within a day; flat-fee placements lock the spend. LinkedIn's own native ad documentation and Google's campaign objective help pages both push advertisers toward objective-matched buying for exactly that reason. Our growth marketing team runs first tests on auction inventory only.
Sponsored formats and where they run
This is the format most people mean when they say content advertising, because the unit is designed to be read rather than clicked past. Nielsen Norman Group's banner-blindness research is the reason: readers learned to ignore anything shaped like a banner, so advertisers reshaped the ad to look like the page.
| Format | Where it appears | Content it carries | Disclosure pattern |
|---|---|---|---|
| In-feed unit | Inside a publisher's article stream | Headline plus thumbnail linking to your article | Label above the headline |
| Content recommendation widget | Below an article, "you may also like" | Curiosity-led article headlines | Widget-level label plus per-unit tag |
| Promoted listing | Marketplace and category pages | Buying guides, comparisons | "Sponsored" chip on the card |
| Search unit | Results page, above organic | Answer content matched to a query | Platform-applied "Ad" badge |
| Sponsored editorial | Publisher's own site, written by their staff | Feature articles, studies | Byline plus banner disclosure |
| In-feed social post | Facebook, Instagram, TikTok, X | Video, carousel, document posts | Platform "Sponsored" tag |
| Newsletter slot | Inside an email issue | Single-link recommendations | Inline "sponsored by" line |
Fact 1 — the cheapest native click is rarely the best one. A $0.20 recommendation-widget click that bounces in 4 seconds costs more per engaged reader than a $2 search click that stays 3 minutes. Outbrain's format overview and the Content Marketing Institute example library are useful for format inspiration, but scroll depth is what you should optimise.
What the FTC requires you to disclose
Disclosure is not a legal footnote in this channel; it is a design constraint that changes creative. The FTC's native advertising guide for businesses states that it is deceptive to mislead consumers about the commercial nature of content, and that ads implying they are independent or impartial can violate Section 5 of the FTC Act.
| FTC guidance | What it means in production | Common failure |
|---|---|---|
| Placement | Put the label in front of or above the headline | Label below the unit in a vertical stream |
| Proximity | As close as possible to the ad it clarifies | One footer disclosure for a whole page |
| Legibility | Font and shade that stand out from background | Light grey 9px label on white |
| Language | Clear, unambiguous, consumer-understood wording | Vague terms like "presented by partners" |
| Image focal points | Put the label on the thumbnail if the image is the focal point | Text label ignored beside a strong visual |
| Video timing | On screen long enough to be read and understood | One-frame disclosure at the end |
| Every device | Clear and prominent on all platforms consumers use | Desktop-only label that truncates on mobile |
| Group units | Visual cues showing one label covers each ad in the group | Single label read as applying to one card |
Limit 1 — disclosure effectiveness is measured by whether consumers actually recognise the ad, not by whether a label exists. The FTC's companion document, .com Disclosures, adds that advertisers should improve disclosures when a significant minority of reasonable consumers miss them. Design the label as part of the creative, not as a compliance patch.
Which content asset deserves promotion
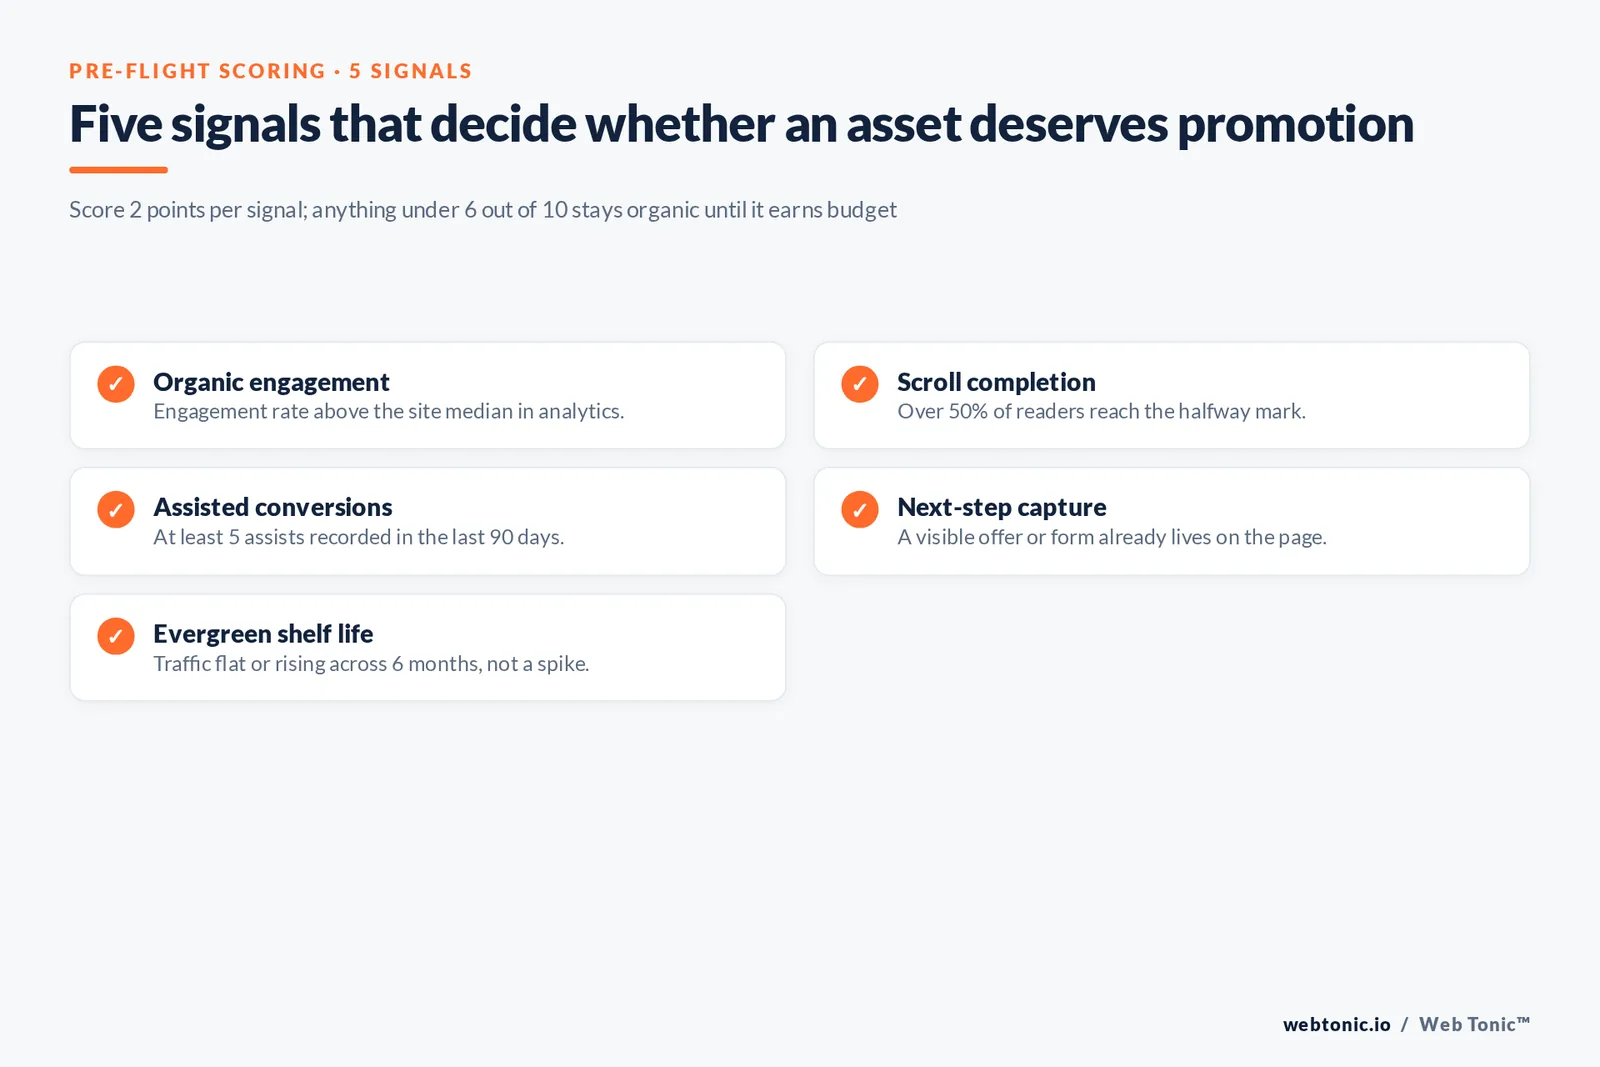
Amplify the wrong asset and no bid strategy saves the run. Score candidates before the plan, using data you already have. Anything below 6 out of 10 stays organic until it earns promotion.
| Signal | Where to find it | Score 2 points if |
|---|---|---|
| Organic engagement | Analytics engagement rate by page | Above the site median |
| Scroll completion | Scroll-depth events | Over 50% get to the halfway mark |
| Assisted conversions | Attribution or path reports | At least 5 assists in 90 days |
| Next-step capture | Form, email or demo events on page | A visible offer exists on the page |
| Evergreen shelf life | Traffic trend over 6 months | Flat or rising, not spiking then dying |
Rule 3 — every promoted asset needs a next step above the fold of the second screen. A promoted article with no capture point spends money to create anonymous readers. Reporting that ties the reader to a later conversion is the job of a measurement setup built before launch, not after.
What a content advertising campaign costs
Plans here fail when the spend line is funded and creative is not. Use the three tiers below as planning envelopes; each assumes a 90-day flight and one asset refresh.
| Tier | Monthly spend | Creative and production | Realistic scope | What it proves |
|---|---|---|---|---|
| Pilot | $1,500–$3,000 | $1,000–$2,500 | 2 assets, 2 channels, 1 audience | Whether buying distribution moves the asset at all |
| Programme | $5,000–$15,000 | $3,000–$8,000 | 5–8 assets, 3 channels, retargeting live | Cost per engaged reader by placement and audience |
| Always-on | $25,000+ | $10,000+ | Monthly asset pipeline, full-funnel sequencing | Contribution to pipeline and blended acquisition cost |
Fact 2 — plan on a creative-to-spend ratio near 1:2. Content ads fatigue like every other feed unit, so a campaign with one asset and a large budget buys the same reader repeatedly. The IAB's insights library tracks the format mix behind digital ad revenue and shows how quickly formats rotate. Ad production is where our performance creative work sits.
Six content advertising campaigns worth copying
These are patterns, not brand rankings — each one is a repeatable structure you can staff and buy this quarter.
| Pattern | Asset | Where to buy | Why it works |
|---|---|---|---|
| Original data drop | Annual benchmark report | B2B feeds plus widgets | Journalists and buyers both cite the numbers |
| Cost transparency page | "What X really costs" breakdown | Paid search | Matches a high-intent query nobody answers plainly |
| Free tool or calculator | Interactive estimator | Search plus newsletters | Utility earns the email without a gate |
| Customer story video | 90-second proof piece | Social and video | Evidence beats claims at the consideration stage |
| Contrarian teardown | Analysis of a failing tactic | Widgets and social | Disagreement earns free distribution on top |
| Sequenced explainer series | 3-part guide | Retargeting only | Each part is only shown to readers of the last |
Trap 1 — the ungated report bought on paid search. Search clicks cost 4x display ones and search users want an answer now, not a 40-page PDF. Put reports on feeds and reserve search for pages that resolve the query on screen. See how competing formats perform in Search Engine Journal's content marketing coverage.
Measuring content advertising by funnel stage
Last-click attribution will always make this channel look weak, because the asset's job is to create a reader who converts later. Measure per stage instead, and set a target for each row before the campaign starts.
| Stage | Primary metric | Healthy signal | Action if it misses |
|---|---|---|---|
| Delivery | CPM and frequency | Frequency under 3 per week | Widen the pool or rotate creative |
| Attention | Click-through rate | At or above placement median | Rewrite the headline, not the asset |
| Engagement | Scroll depth and time on page | 50%+ reach halfway | Fix the intro and page speed |
| Capture | Cost per engaged reader captured | Under 3x your cost per lead target | Add a next step matched to the asset |
| Pipeline | Assisted conversions | Rising share of converting paths | Extend the retargeting window |
| Brand | Branded search volume | Growth versus a pre-flight baseline | Sustain spend longer before judging |
Limit 2 — a 90-day flight is the shortest window that produces a readable answer for anything above the capture row. Brand and pipeline effects lag the spend. Read more field notes on measurement in the Web Tonic blog.

Seven mistakes that waste this spend
- Mistake 1 — promoting an asset with no proven engagement. Paid reach amplifies the response the asset already earns; it does not create one.
- Mistake 2 — one headline per asset. Run at least 4 headline variants per placement; headline is the highest-leverage variable in feeds and widgets.
- Mistake 3 — judging the channel on last-click ROAS. That metric structurally undercounts assets designed to be read before buying.
- Mistake 4 — leaving native placements unfiltered. Review placement reports weekly and block low-quality domains; the bottom 10% of inventory usually drives most of the wasted spend.
- Mistake 5 — no retargeting pool. A reader who never sees a second message is a purchased impression with no follow-up.
- Mistake 6 — funding media without creative refresh. Expect fatigue in 2–3 weeks on feeds; plan the replacement before launch.
- Mistake 7 — weak or hidden disclosures. The compliance risk is real and, per the FTC, the test is consumer recognition, not label presence.
Fact 3 — audience size sets the fatigue clock. An list of 50,000 with $10,000 of monthly feed spend hits high frequency in weeks; the same budget over 500,000 people does not. Consumer news-consumption data from Pew Research Center is a good sanity check on where your audience actually reads. If you want this built and run end to end, talk to us.
FAQ
What is content advertising in simple terms?
It is paying to put your own content in front of an audience. Instead of advertising a product page, you buy impressions or clicks for an article, video, report or tool, and the content does the persuading. The commercial outcome is measured downstream through capture, retargeting and assisted conversions rather than an immediate sale.
How is content advertising different from content marketing?
Content marketing is the full practice of creating and publishing owned assets, and its reach is earned through search, email and social algorithms. Content advertising is the paid distribution layer inside that programme: media budget carries the reach, results appear the same day, and traffic stops when the spend stops.
Is native advertising the same as content advertising?
No. Native advertising is a format — an ad unit designed to match the look of the content around it. Content advertising is the strategy of buying distribution for editorial assets, and the sponsored feed unit is one of several formats it can use, alongside paid search, paid social, video and newsletter placements.
What budget do I need to start?
A useful pilot runs at roughly $1,500 to $3,000 of monthly spend plus creative, covering two assets across two channels for 90 days. That is enough to read cost per engaged reader by placement. Below that level, data volume is too thin to separate a weak asset from a weak list.
How do I know if a content ad campaign worked?
Set a target for each funnel stage before launch: frequency and CPM for delivery, CTR for attention, scroll depth for engagement, cost per captured reader for conversion, and assisted conversions plus branded search for downstream effect. Judge the campaign on the stage where it broke, not on a single blended number.
Sources
FTC, Native Advertising: A Guide for Businesses · FTC, .com Disclosures · WordStream, Average Click-Through Rate · Semrush, How Much Does Google Ads Cost · Ahrefs, Content Distribution · Moz, Beginner's Guide to Content Marketing · Nielsen Norman Group, Banner Blindness · IAB Insights · LinkedIn Marketing Solutions, Native Advertising · Outbrain, Native Advertising · Content Marketing Institute, Native Advertising Examples · Search Engine Journal, Content Marketing · Pew Research Center, Social Media and News Fact Sheet. Figures accessed August 2026.