Table of contents
X (formerly Twitter) remains one of the most affordable paid social platforms in 2026 — yet its relevance for construction materials advertising is debated. With a median CPC of $0.74 and a CPM of just $5.65, X offers real cost advantages over Meta and LinkedIn. But declining ad revenue, advertiser flight, and brand safety concerns complicate the picture. This data report breaks down the latest X advertising benchmarks with a construction materials lens, showing where the platform delivers value and where it falls short.
Key Takeaways
- Average X ads CPC ranges from $0.27–$1.95, with a cross-industry average of $0.74 — making X one of the cheapest paid social channels (SearchLab 2026).
- X CPM averages $5.65 — roughly 62% cheaper than Meta ($14.91) and 83% cheaper than LinkedIn ($31–$34) (SearchLab 2026).
- 38% of B2B construction firms use X for marketing, primarily for real-time industry news and thought leadership (ZipDo 2026).
- X ad revenue has declined 54% since the Musk acquisition, driving down advertiser competition and costs (eMarketer/Bloomberg 2026).
- CTR for Promoted Tweets ranges from 1–3%, with B2B professional services averaging 1.2–2.5% (WebFX / Improvado 2026).
- Average conversion rate is 1–3% for X ad campaigns, comparable to Meta but below Google search (The Global Statistics 2026).
- Median ROAS on X sits at 2:1 to 2.5:1 — lower than Google Search (3:1–6:1) but competitive with other top-of-funnel channels (CO Consulting 2026).
- 611 million monthly active users globally, with 95.4 million in the U.S. — the platform still offers massive reach despite controversies (Statista/X Corp 2026).
X (Twitter) Advertising Cost Benchmarks
| Metric | X Platform Average | B2B / Professional Services | Source |
|---|---|---|---|
| CPC (Cost Per Click) | $0.74 ($0.27–$1.95 range) | $0.75–$2.00 | SearchLab / Improvado 2026 |
| CPM (Cost Per 1,000 Impressions) | $5.65 | $8–$16 | SearchLab / CO Consulting 2026 |
| CPE (Cost Per Engagement) | $0.13 (median) | $1.50–$4.00 | Hootsuite / SQ Magazine 2026 |
| CTR (Click-Through Rate) | 1–3% (Promoted Tweets) | 1.2–2.5% | WebFX / Improvado 2026 |
| Conversion Rate | 1–3% | 2–4% | The Global Statistics 2026 |
| ROAS (Median) | 2:1 to 2.5:1 | 1.5:1 to 3.5:1 | CO Consulting 2026 |
The cost story on X is straightforward: advertiser exodus has created a buyer's market. The 54% decline in ad revenue since the Musk acquisition means fewer advertisers competing for the same inventory, pushing costs down across every metric. For construction materials companies willing to navigate brand safety concerns, this creates a genuine cost arbitrage — particularly for reach and awareness objectives.
CPC Comparison: X vs. Major Paid Social Platforms
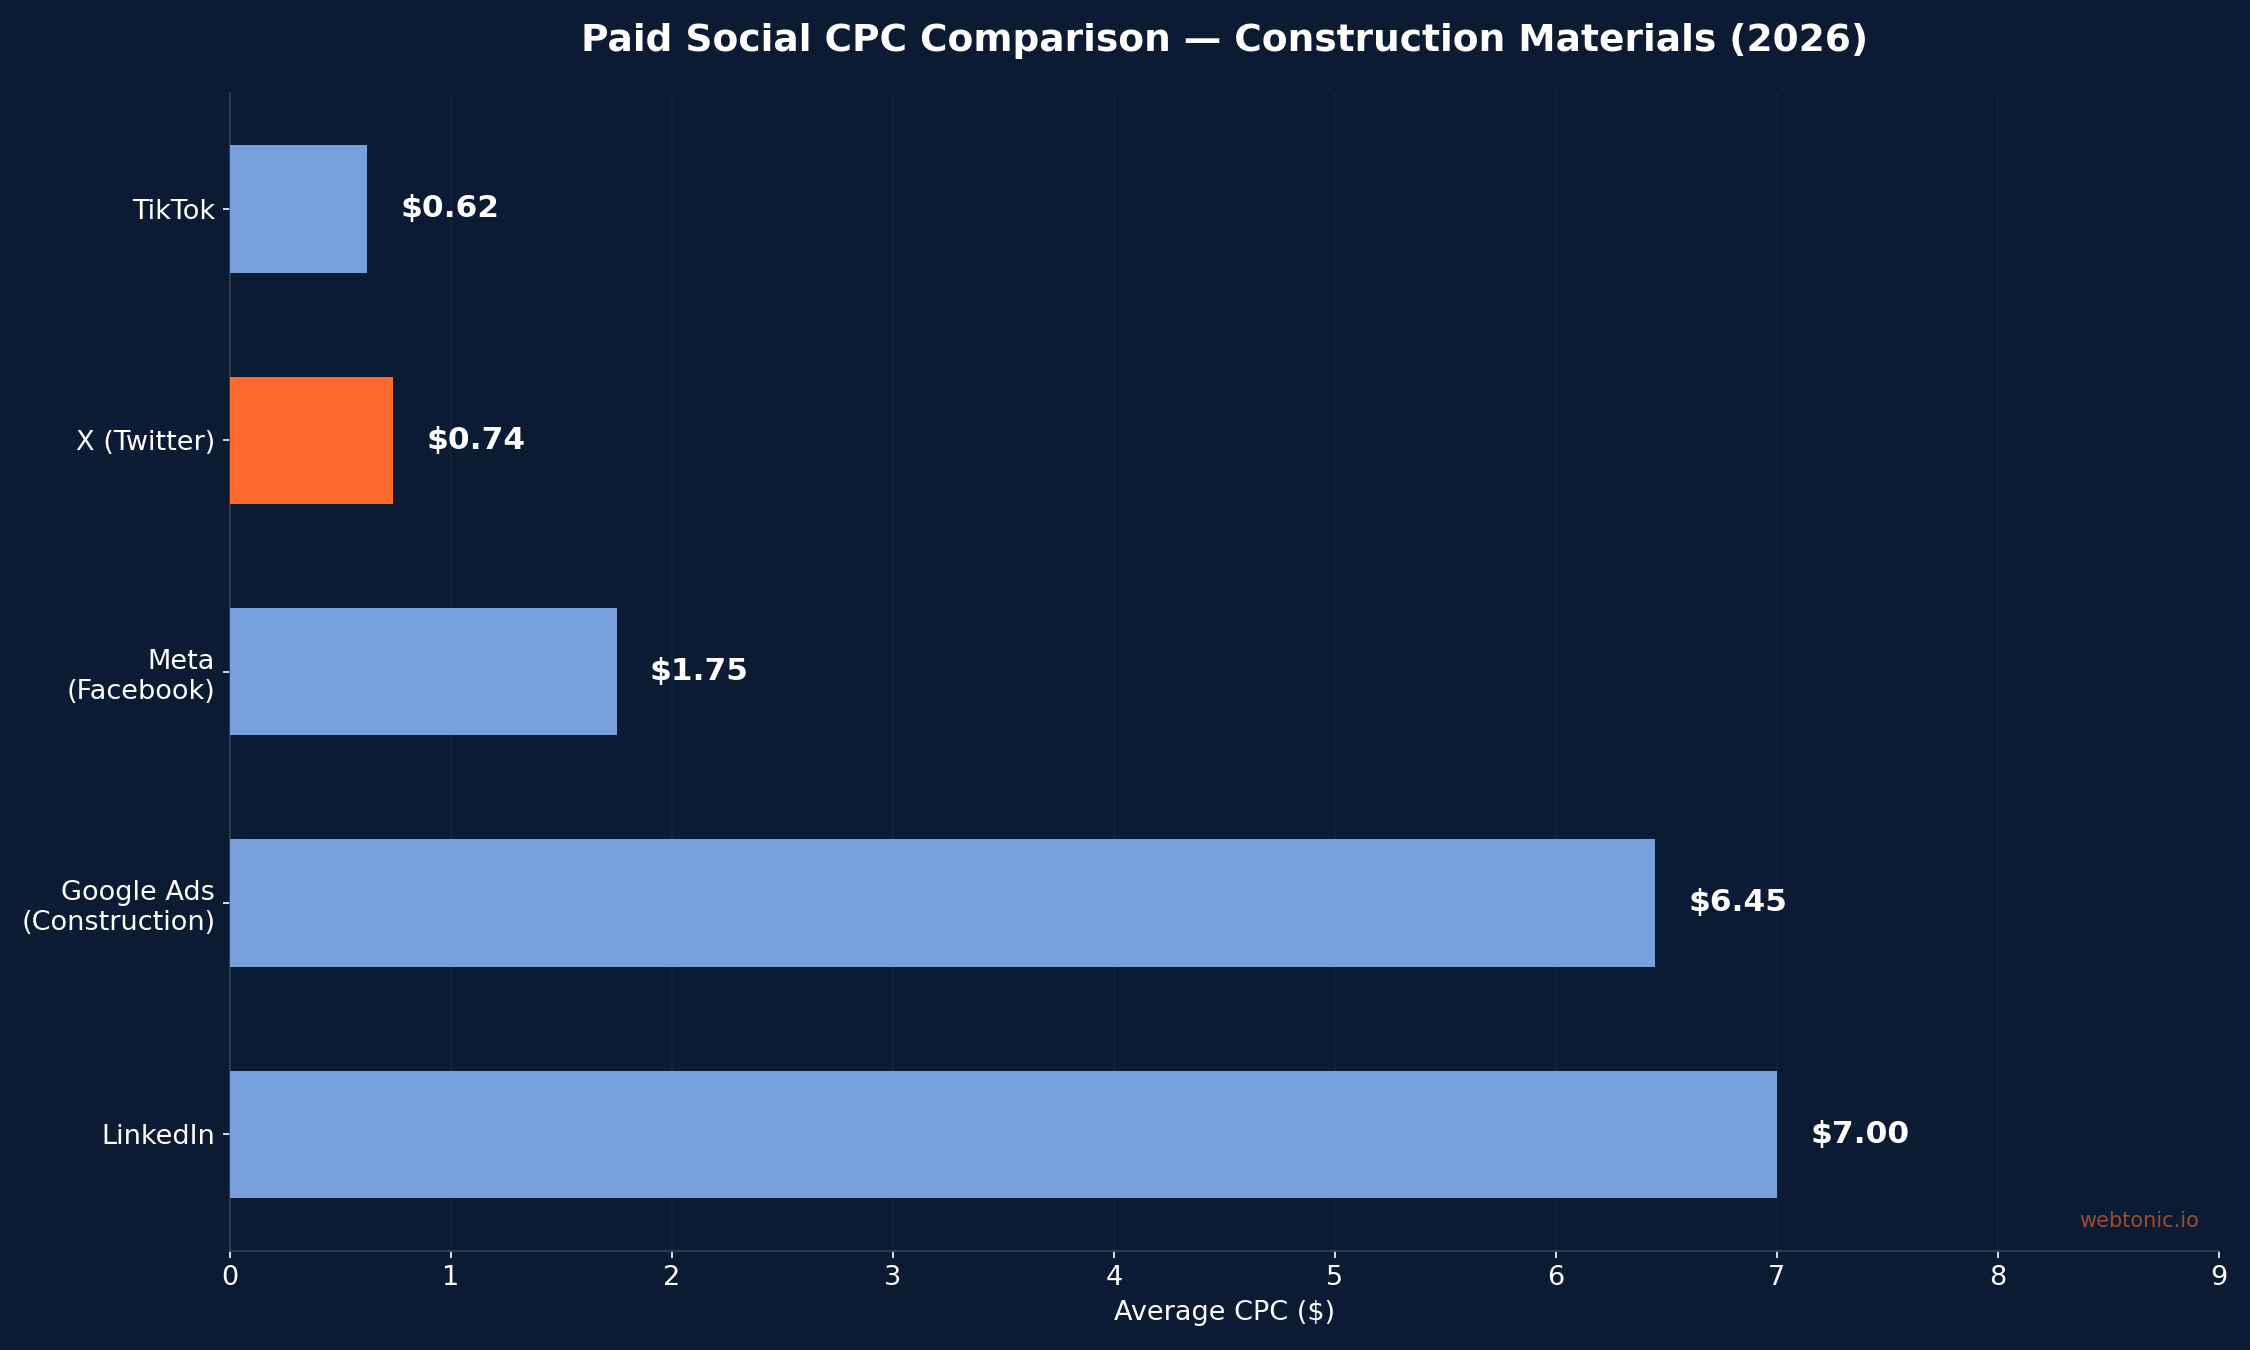
X's $0.74 average CPC positions it as the second-cheapest mainstream paid channel behind TikTok ($0.62). For construction materials brands, the comparison to LinkedIn is especially relevant: X delivers B2B clicks at roughly 10% of LinkedIn's $5–$9 CPC for manufacturing audiences. The trade-off is targeting precision — LinkedIn offers job-title and company-size targeting that X cannot match, but for broad awareness campaigns, X's cost advantage is substantial.
X Platform Audience for Construction Materials
X's user base offers specific advantages and limitations for construction materials marketing:
- 611 million MAU globally, with 259 million daily active users — the platform retains massive scale despite user churn fears (Statista/X Corp 2026).
- 25–34 age group represents ~36% of users; 18–24 adds another ~34%, making the combined 18–34 cohort over 70% of the platform (Marketing LTB 2026).
- 60–64% male — a demographic alignment advantage for construction, where the workforce skews heavily male.
- 38% of users research products on X, and 35% interact with brand content daily (Marketing LTB 2026).
- Users skew toward higher household incomes, with a large share in the $100K+ bracket — relevant for B2B decision-makers and premium building materials brands.
- 52% of construction X users cite "real-time industry news" as their primary reason for following construction-related accounts (ZipDo 2026).
The platform's strength for construction lies in its real-time information culture. Contractors, engineers, and project managers use X to track material pricing shifts, regulatory changes, and industry news — creating contextual opportunities for building materials brands that paid social advertising on other platforms cannot replicate.
X Ad Formats and Performance for B2B
| Ad Format | Best Use Case | Typical CTR | Cost Indicator |
|---|---|---|---|
| Promoted Tweets | Product announcements, project showcases | 1–3% | $0.50–$2.00 CPC |
| Video Ads | Installation demos, facility tours | 1.5–3.5% | $0.02–$0.05 CPV |
| Conversation Ads | Lead generation, polls, engagement | 2–4% | $1.50–$4.00 CPE |
| Website Cards | Catalog/spec sheet traffic | 0.8–2.0% | $0.50–$1.50 CPC |
| Follower Ads | Brand building, community growth | 0.5–1.5% | $2–$5 per follower |
Conversation Ads show the highest CTR (2–4%) for B2B advertisers, making them the strongest format for lead generation in construction. A B2B case study from SocialAds Studio achieved 3.5× ROAS and $32.45 CPL using Conversation Ads for technology sales — demonstrating that the format can generate qualified leads when targeting and creative align. Video ads showing real construction footage — installation processes, product stress tests, facility walkthroughs — also perform strongly, with CTRs reaching 3.5% in B2B contexts.
Brand Safety and Advertiser Concerns
Brand safety remains the most cited concern among B2B marketers considering X advertising in 2026. The platform's content moderation changes have driven a 54% decline in ad revenue, as major advertisers paused or left entirely. For construction materials brands, the practical implications include:
- Reduced competition — fewer advertisers means lower auction prices, directly benefiting remaining advertisers through cheaper CPMs and CPCs.
- Adjacency risk — ads may appear alongside controversial content, though X's rebuilt AI ad platform now offers improved placement controls (Gray Reserve 2026).
- Audience quality concerns — the median engagement rate on X decreased to just 0.015% in 2025 (Martech 2026), with top brands achieving about 0.08%. The platform-wide engagement decline suggests potential bot activity or disengaged users in the available ad inventory.
- Premium placements cost $100,000–$250,000/day for Takeover products (SearchLab 2026) — well beyond construction materials budgets, but standard formats remain affordable.
The strategic calculation for construction materials brands: if your marketing team can tolerate adjacency risk and your target audience (contractors, engineers, procurement) actively uses X for industry news, the cost savings over LinkedIn are significant enough to justify a test allocation.
X Ad Revenue Decline and Cost Impact
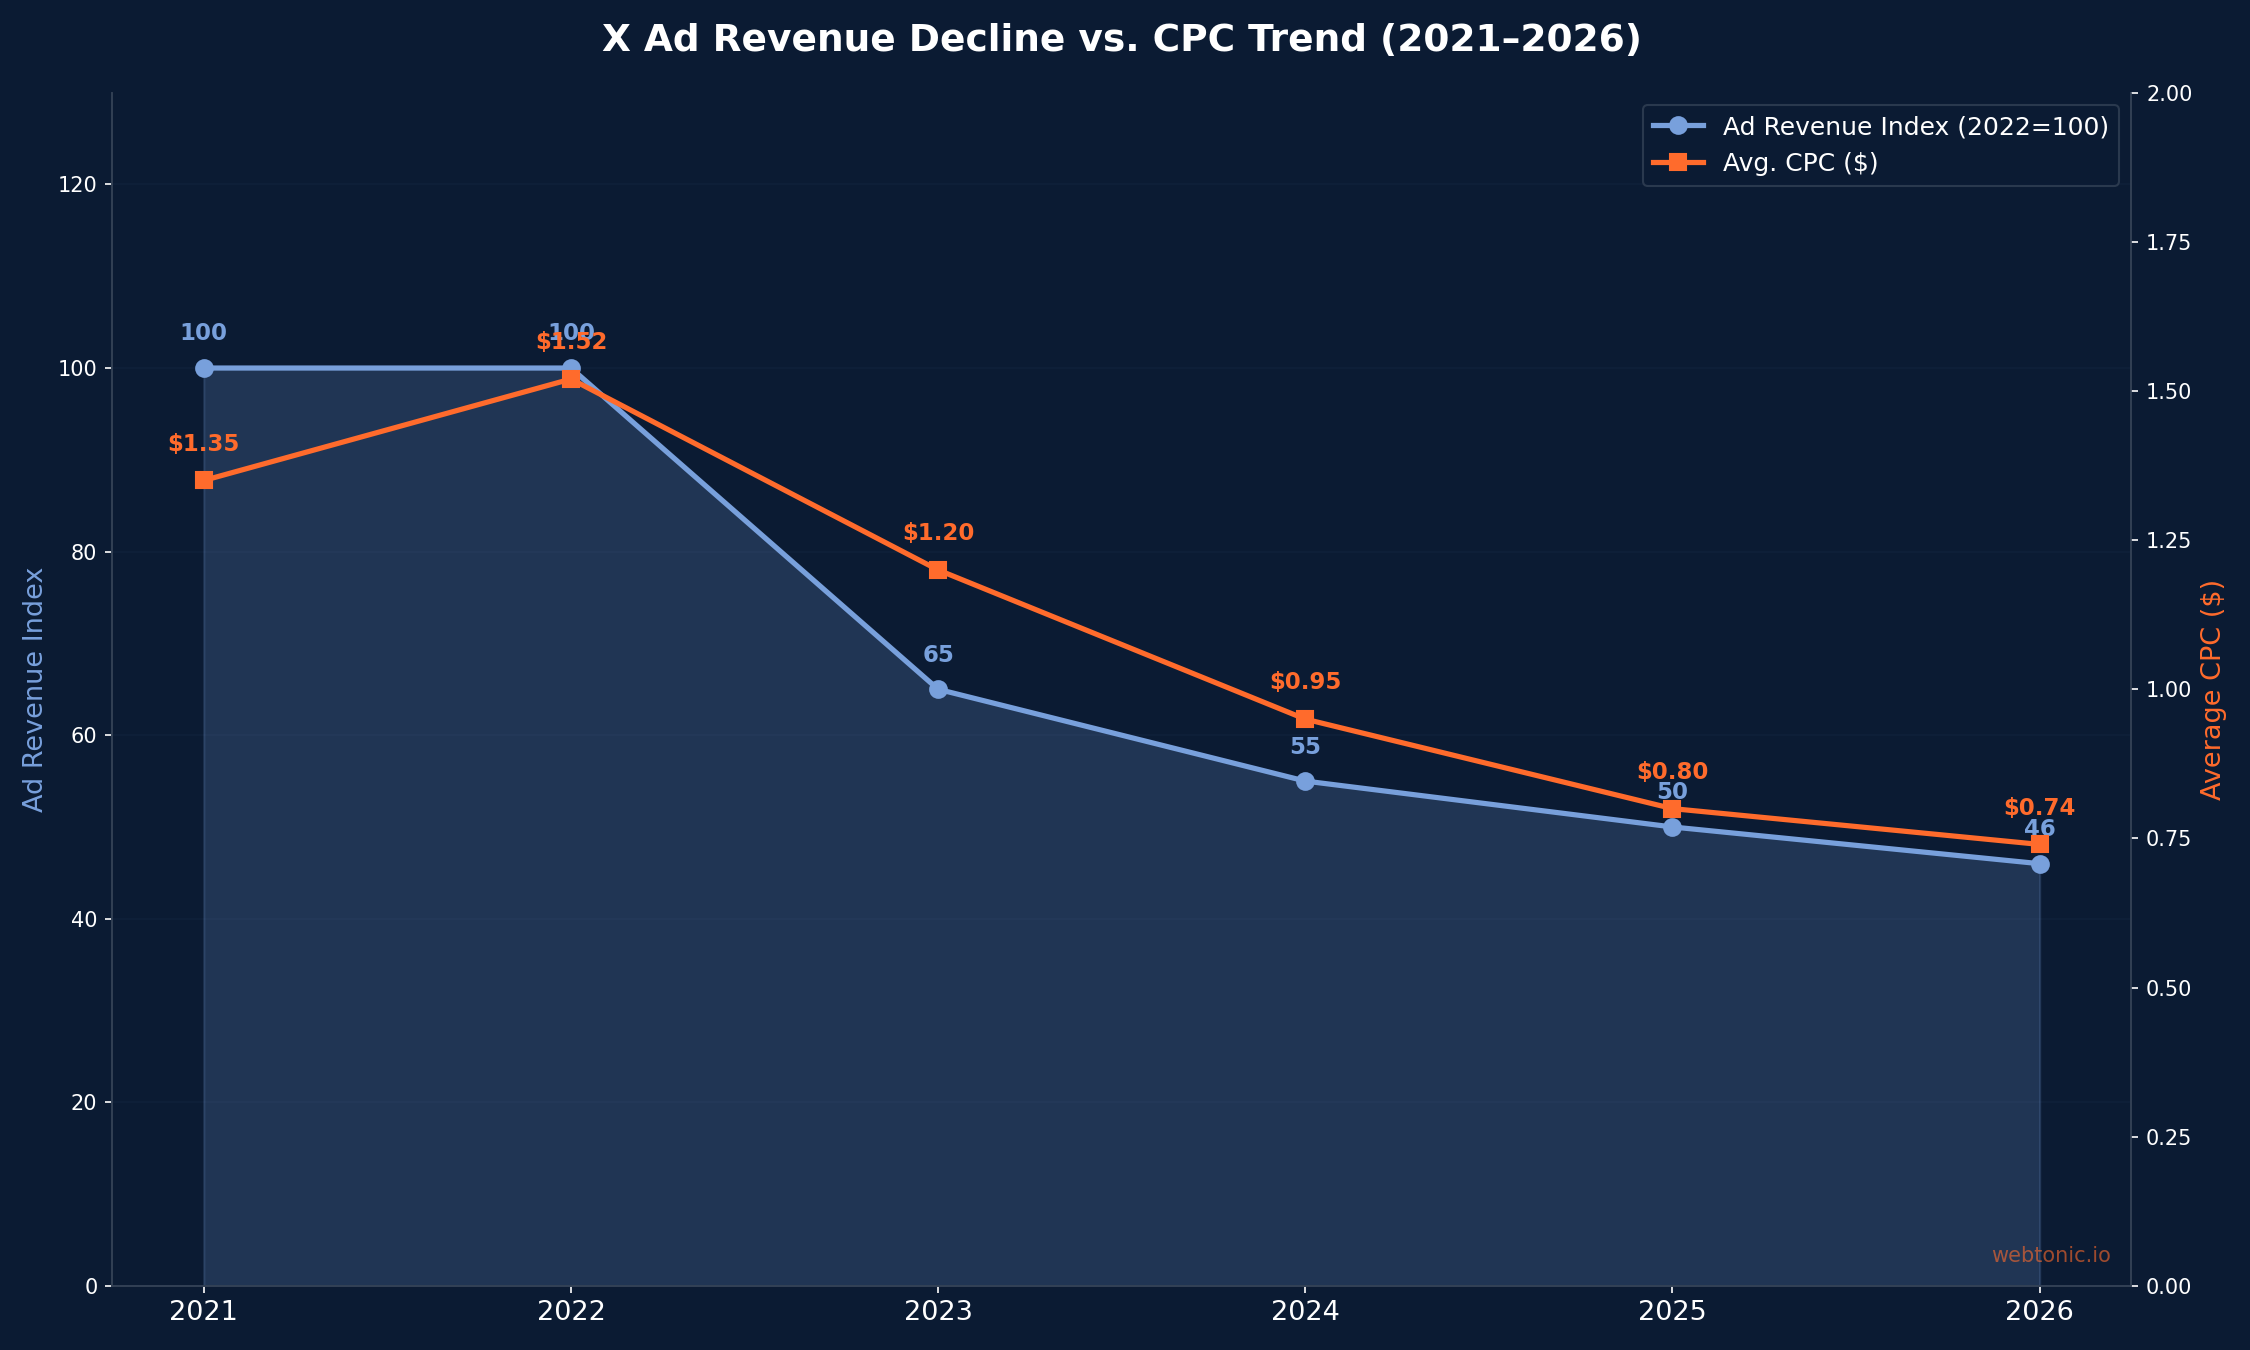
The correlation between ad revenue decline and CPC reduction is direct. As major brands exited, auction competition dropped, pulling down average CPCs from an estimated $1.52 in 2022 to $0.74 in 2026. For construction materials advertisers, this means the current cost environment is likely temporary — if X successfully rebuilds its advertiser base (which its AI ad platform rebuild aims to achieve), prices will rise. The current window represents the cheapest X advertising has been in years.
X Advertising Strategy for Construction Materials Brands
- Allocate 5–10% of social ad budget to X — enough to test meaningfully without overexposing the brand to platform risk. Start with $20–$50/day.
- Focus on Conversation Ads and Video Ads — these deliver the highest B2B CTRs (2–4% and 1.5–3.5% respectively) and best cost efficiency.
- Target CRM audiences and site retargeting — X's strongest B2B results come from CRM-based custom audiences, website visitor retargeting, and closed-won lookalikes (Directive 2026).
- Lean into real-time content — post during trade shows, extreme weather events (roofing/siding demand spikes), regulatory announcements, and material price changes when your audience is actively monitoring X.
- Measure against pipeline, not just CPL — X's value sits in top-of-funnel awareness and consideration. Track branded search volume lifts, multi-touch attribution, and pipeline influence rather than last-click conversions only.
- Use video featuring real construction footage — installation processes, stress tests, and facility tours generate 1.5–3.5% CTR versus 0.8–2.0% for static cards. Ferguson (bath/kitchen distributor) achieved a 3,000% increase in followers and 104% rise in engagements using this approach (CaseStudies.com).
X Advertising Trends Shaping Construction Materials in 2026
Several platform-level trends are reshaping how construction materials brands should approach X advertising:
- AI-powered ad platform rebuild — X has rebuilt its ad targeting system using AI, promising improved relevance and performance. Early tests show improved click quality for niche B2B audiences, though independent verification is limited (Gray Reserve 2026).
- Video dominance continues — video content consumption on X grew by an estimated 35% in 2025, and video ads consistently outperform static formats on every engagement metric. Construction brands with existing video assets (installation guides, product demos, project walkthroughs) have a natural advantage.
- X Premium subscriber targeting — with 1.3 million paying subscribers (The Information/Sensor Tower 2026), X now allows advertisers to target verified accounts. For B2B construction, this can help filter for more professional, higher-intent audiences who are willing to pay for platform access.
- Integration with Grok AI — X's AI assistant Grok is being integrated into the advertising experience, offering potential for more sophisticated audience segmentation and creative optimization. The impact on B2B verticals is still unproven.
The construction materials industry should view X advertising as a tactical opportunity, not a strategic pillar. The platform's cost advantages are real, its reach among industry professionals is meaningful (38% of B2B construction firms are active), and its real-time information culture aligns with how contractors actually consume content. But declining engagement, brand safety questions, and limited B2B targeting keep it firmly in the "supplement your core media mix" category rather than as a primary investment channel.
Frequently Asked Questions
How much do X (Twitter) ads cost for construction companies?
X ads average $0.74 CPC across industries, with B2B professional services paying $0.75–$2.00 CPC. CPM averages $5.65 platform-wide and $8–$16 for B2B segments. These are among the lowest paid social costs available in 2026, driven by reduced advertiser competition following the platform's ownership changes.
Is X still worth advertising on for B2B construction brands?
Yes, with caveats. 38% of B2B construction firms use X for marketing, and the platform's cost advantage over LinkedIn (roughly 90% cheaper CPC) creates real efficiency for awareness campaigns. However, brand safety concerns and declining engagement rates (median 0.015%) mean X works best as a supplementary channel — not a primary lead generation platform.
What ad format works best on X for construction materials?
Conversation Ads deliver 2–4% CTR for B2B advertisers — the highest of any X format. Video ads showing real construction processes also perform well at 1.5–3.5% CTR. Static website cards are less effective at 0.8–2.0% CTR but can drive catalog and spec sheet traffic cost-efficiently.
How does X compare to LinkedIn for construction B2B advertising?
X is dramatically cheaper: $0.74 avg CPC vs. $5–$9 on LinkedIn, and $5.65 CPM vs. $31–$34. LinkedIn offers superior targeting (job title, company size, seniority) and higher-quality B2B audiences. The optimal approach for construction materials brands is using X for broad awareness and LinkedIn for precision targeting of procurement decision-makers.
How many users does X have in 2026?
X reports 611 million monthly active users globally and 259 million daily active users. The U.S. accounts for 95.4 million users (15.6% of global MAU). The platform experienced substantial user churn from 2022–2024 but has shown stabilization signals in 2025–2026.
Sources
SearchLab — X (Twitter) Statistics 2026: 80+ Facts
The Global Statistics — X (Twitter) Advertising Statistics 2026
Marketing LTB — X Ads Statistics 2026: 96+ Stats
SQ Magazine — Twitter (X) Statistics 2026
CO Consulting — X Ads in 2026: When They Pay Back
ZipDo — Marketing In The Construction Industry Statistics
Improvado — Twitter Ads Guide 2026
HeyOz — Are X Ads Worth It for Businesses in 2026?