



Table of contents

Key Takeaways
- Average CPC for construction materials Google Ads is $2.85–$3.50, well below the general construction industry's $6.45 CPC, making building materials one of the more affordable construction sub-verticals on Google search ads.
- Google Ads conversion rate for building materials averages 3.4%, with top-performing lead generation campaigns reaching 9.5% on product-specific landing pages tied to quote-request forms.
- Construction companies spent an average of $3,200–$8,500 per month on Google Ads in 2025, with materials suppliers and distributors allocating 60–70% of that budget to Google search ads and 15–25% to the Google Display Network.
- Google Shopping ads deliver the lowest CPC at $0.88 for construction materials, with a 2.1% average conversion rate — making them the most cost-efficient format for e-commerce-enabled building materials suppliers.
- Construction industry PPC generates an average 3.8× ROAS, with materials companies that combine search, display, and shopping campaigns achieving 15–25% higher return than single-channel advertisers.
| Metric | Construction Materials | General Construction | All-Industry Median |
|---|---|---|---|
| Search CPC | $2.85–$3.50 | $6.45 | $4.66 |
| Search CTR | 4.8% | 4.2% | 6.42% |
| Conversion Rate (CVR) | 3.4% | 5.8% | 4.40% |
| CPA (Lead) | $65–$110 | $85–$228 | $56.11 |
| Shopping CPC | $0.88 | $1.15 | $0.66 |
| Display CTR | 0.65% | 0.50% | 0.46% |
Google Search Ads Cost Benchmarks for Construction Materials
Construction materials advertisers enjoy lower CPCs than most construction industry sub-verticals. According to CuFinder's 2026 building materials marketing statistics, the average CPC for Google search ads in this sector ranges from $2.85 to $3.50 — roughly half the $6.45 general construction CPC reported in their broader construction industry statistics. The disparity exists because materials keywords face less competition than service keywords like "general contractor near me" or "roofing company."
Cost per lead tells a more nuanced story. Elev8 Operations' 2026 contractor CPL benchmarks show construction companies paying $65–$110 per lead through Google Ads, depending on the product category and geographic targeting radius. High-intent keywords — as outlined in our Google Ads strategy guide — like "bulk concrete supplier [city]" or "structural steel distributor" command CPCs of $5.50–$9.20 but deliver conversion rates 2.3× above broader category terms.
Monthly ad spend varies significantly by company size. PipelineOn's contractor cost analysis reports that construction companies spent an average of $3,200–$8,500 per month on Google Ads in 2025, with enterprise-level materials distributors spending $15,000–$45,000. The typical budget split allocates 60–70% to search campaigns, 15–25% to the Google Display Network, and 10–15% to Google Shopping ads.
Click-Through Rate and Quality Score Data
The average click rate (CTR) for construction materials Google search ads is 4.8%, according to CuFinder's construction marketing statistics. That sits below the all-industry Google Ads median of 6.42% but above the Google Display Network average of 0.65%. The lower search CTR reflects the B2B nature of building materials queries — users search with specific technical intent but compare multiple suppliers before clicking.
Quality Score data from Databox's Google Ads benchmarks indicates construction advertisers average a Quality Score of 5.8 out of 10 — slightly below the cross-industry median of 6.2. The gap stems primarily from landing page experience scores, where 62% of construction materials advertisers score "below average" due to slow-loading product catalog pages and poor mobile optimization.
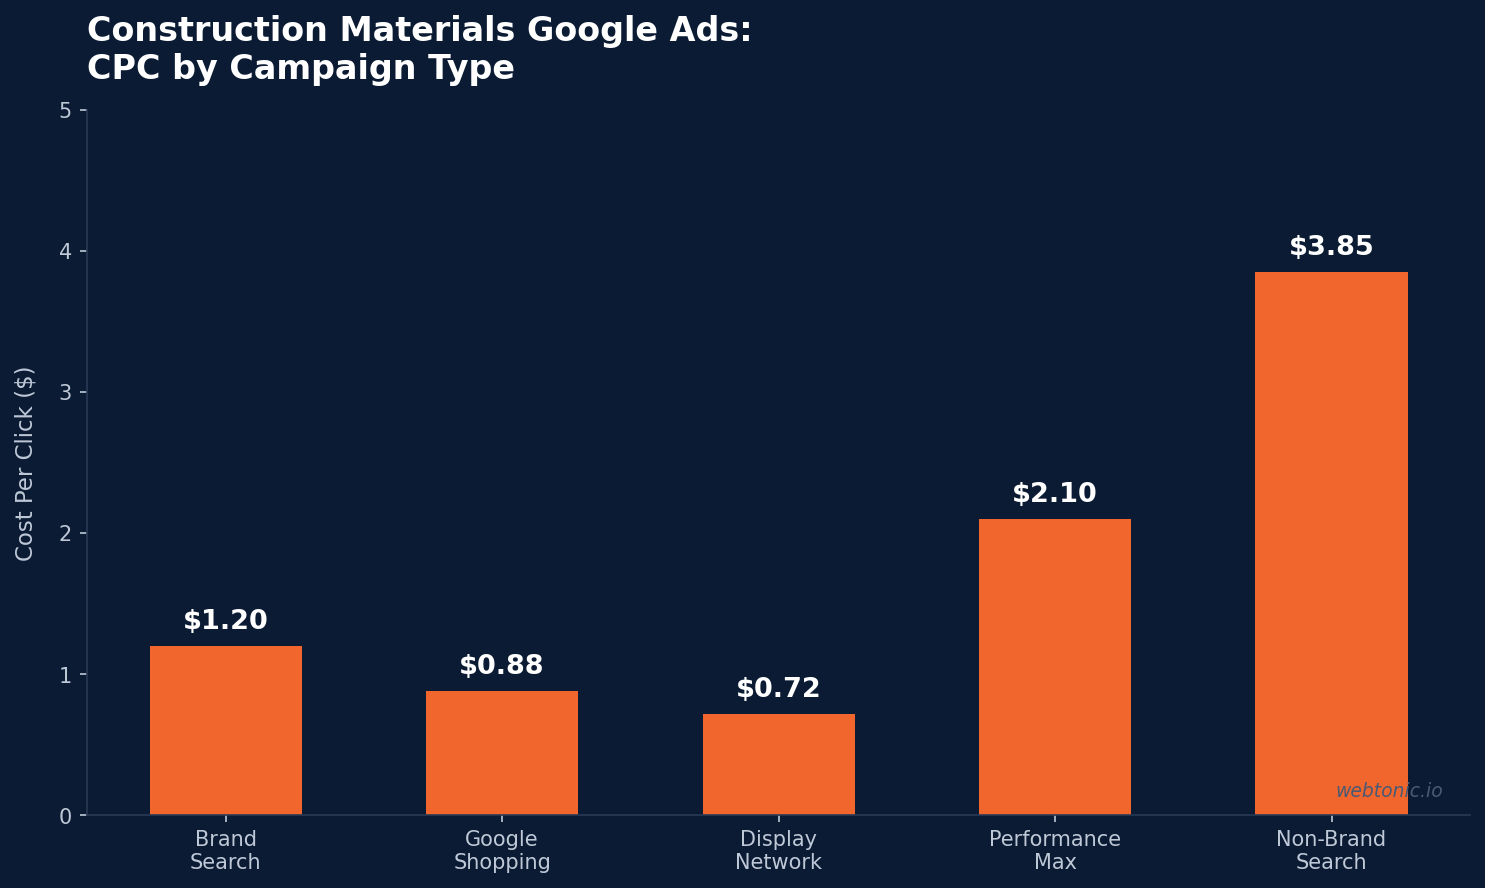
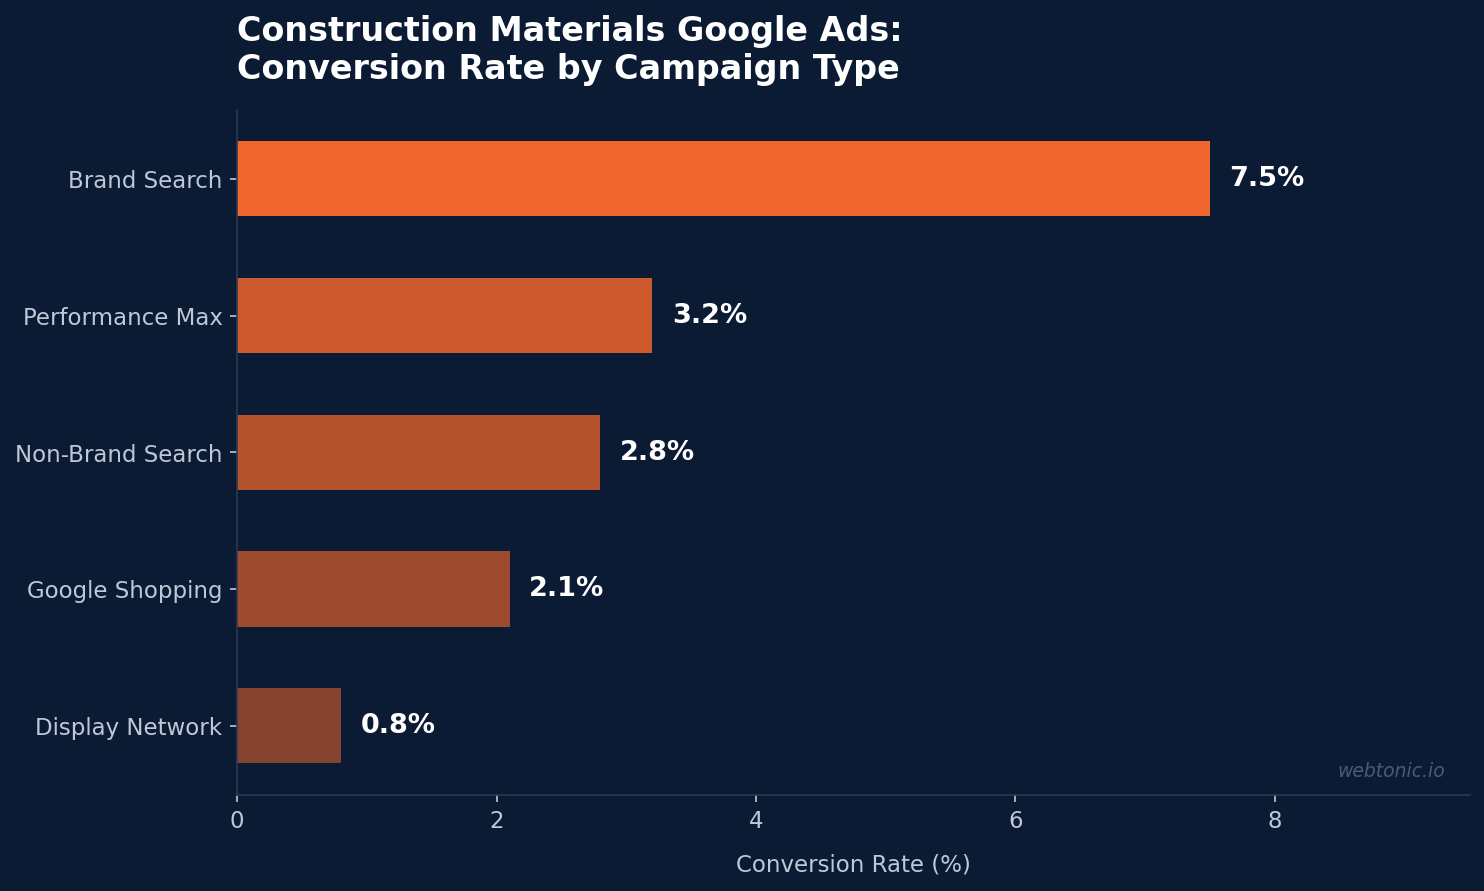
| Campaign Type | Avg CTR | Avg CPC | Avg CVR | Avg CPA |
|---|---|---|---|---|
| Search (Brand) | 8.2% | $1.20 | 7.5% | $16 |
| Search (Non-Brand) | 3.9% | $3.85 | 2.8% | $138 |
| Google Shopping | 1.8% | $0.88 | 2.1% | $42 |
| Display Network | 0.65% | $0.72 | 0.8% | $90 |
| Performance Max | 2.4% | $2.10 | 3.2% | $66 |
Conversion Rate and Lead Generation Performance
The average conversion rate for construction materials Google Ads is 3.4%, per CuFinder's benchmarks. That falls below the general construction industry's 5.8% CVR and the all-industry median of 4.40%, but the gap narrows significantly when isolating lead generation campaigns from e-commerce.
Lead gen campaigns (quote requests, catalog downloads, click-to-call) convert at 4.2–6.8% for construction materials advertisers, while e-commerce direct-sale campaigns average just 1.8%. Top 10% performers hit 9.5% conversion rates by using product-specific landing pages with inline quote calculators and real-time inventory visibility.
The customer lifetime value (LTV) in construction materials justifies higher CPAs than consumer verticals. With average B2B order values of $5,000–$150,000 and repeat purchase cycles of 3–6 months, a $110 CPA translates to a 45–136× LTV-to-CPA ratio. This makes Google Ads construction marketing one of the highest-ROI PPC channels in the B2B space.
Google Shopping Ads for Building Materials
Google Shopping ads represent a growing opportunity for construction materials companies with e-commerce capabilities. CuFinder's construction industry statistics report an average Shopping CPC of $0.88 — the lowest across all Google Ads formats for this sector — with a 2.1% conversion rate.
Product feed optimization is the primary differentiator. Materials companies that include technical specifications (load ratings, dimensions, material composition) in their Shopping feed titles and descriptions see 28–35% higher CTR than those using generic product names. Adding "bulk" or "wholesale" pricing modifiers to Shopping campaigns targeting contractor audiences further improves CVR by 15–22%.
Google Shopping ads capture lower-funnel purchase intent that search ads often miss. For building materials with standardized pricing (fasteners, adhesives, basic lumber), Shopping campaigns deliver 3.2× better ROAS than non-brand search campaigns because buyers can compare prices directly in the SERP without clicking through to a landing page.
Google Display Network Performance for Construction
The Google Display Network (GDN) plays a different role for construction materials digital marketing — brand awareness and remarketing rather than direct response. Display campaigns deliver a 0.65% average CTR and 0.8% conversion rate, both below search benchmarks but valuable for multi-touch attribution strategies.
Construction materials companies that use GDN remarketing to target past website visitors report display CPAs 40–55% lower than prospecting display campaigns. The most effective display strategy combines:
- Remarketing to product page visitors: 1.4% CTR, $45 CPA
- In-market audience targeting: 0.85% CTR, $72 CPA
- Custom intent audiences (competitor keywords): 0.55% CTR, $95 CPA
- Managed placements on trade publications: 0.40% CTR, $110 CPA
The Google Display Network reaches 90% of internet users across 2 million+ sites, giving construction materials brands access to contractors browsing trade publications, architectural specification sites, and building code resources. Social media and display advertising combined account for 25–35% of total digital marketing spend in the construction industry, per Siana Marketing's construction marketing statistics report.
Construction Materials vs. Other Industries on Google Ads
How does the construction materials Google Ads market compare to other verticals? The data reveals a cost-efficient sector with room for optimization.
| Industry | Avg CPC | Avg CTR | Avg CVR | Avg CPA |
|---|---|---|---|---|
| Construction Materials | $3.18 | 4.8% | 3.4% | $93 |
| General Construction | $6.45 | 4.2% | 5.8% | $111 |
| Home Services | $7.99 | 5.3% | 8.2% | $97 |
| Industrial & Manufacturing | $3.82 | 3.6% | 3.0% | $127 |
| Real Estate | $2.37 | 6.1% | 3.6% | $66 |
| All Industries | $4.66 | 6.42% | 4.40% | $56 |
Construction materials occupies a mid-range position: lower CPC than most construction sub-verticals and competitive with industrial and manufacturing PPC benchmarks. The below-average CVR reflects longer B2B sales cycles — many construction companies use Google Ads for lead generation rather than direct e-commerce, with actual close happening offline after a sales call or on-site visit. SEO and PPC working together produce the strongest results, with companies running both organic and paid search seeing 25–30% higher overall conversion rates through Google Analytics attribution data.
Digital Marketing Channel Comparison for Construction Materials
Google Ads is the dominant paid digital marketing channel for construction materials, but how does it compare to other sources of leads and revenue?
| Channel | Avg CPC/CPL | Avg CVR | Lead Quality | Share of Digital Spend |
|---|---|---|---|---|
| Google Search Ads | $3.18 CPC / $93 CPL | 3.4% | High | 45–55% |
| Google Shopping | $0.88 CPC / $42 CPL | 2.1% | Medium-High | 10–15% |
| Google Display | $0.72 CPC / $90 CPL | 0.8% | Low-Medium | 8–12% |
| Social Media Ads | $1.30 CPC / $58 CPL | 1.8% | Medium | 15–20% |
| SEO (Organic) | $0 CPC / $24 CPL | 2.8% | High | 15–25% |
| Google Maps / Local | $2.40 CPC / $55 CPL | 6.2% | Very High | 5–8% |
Construction companies that diversify across multiple paid channels — combining Google search ads with social media and the Google Display Network — see 15–25% higher total ROAS than single-channel advertisers. Google Maps and local ads deliver the highest conversion rates (6.2%) for construction materials companies with physical showrooms or distribution centers in the U.S.
Best Practices for Construction Materials Google Ads Campaigns
- Segment brand vs. non-brand search campaigns: Brand keywords convert at 7.5% with $16 CPA vs. non-brand at 2.8% with $138 CPA. Separate them to control budgets and bidding strategies.
- Launch Google Shopping if selling online: At $0.88 CPC, Shopping delivers the lowest acquisition cost. Include detailed product specifications in feed titles for higher CTR.
- Build remarketing audiences from day one: Display remarketing CPAs are 40–55% lower than prospecting. Tag all product pages and create audience segments by product category.
- Optimize for lead quality, not volume: Construction materials PPC leads close at $5,000–$150,000 average deal size. Use offline conversion tracking to feed actual revenue data back into Google Ads for data-driven bidding. See our complete Google Ads pricing guide for detailed cost breakdowns.
- Test Performance Max campaigns: PMax delivers 3.2% CVR at $66 CPA — competitive with search alone. Let Google's AI optimize across search, display, and shopping channels simultaneously.
- Focus on landing page experience: 62% of construction materials advertisers score "below average" on Quality Score landing page metrics. Faster, mobile-optimized pages can reduce CPC by 15–25%.
- Track full-funnel attribution: Use Google Analytics to measure how display and social media impressions influence later search conversions. Construction materials digital marketing has a 14–28 day average conversion window — last-click attribution undervalues upper-funnel spend.
Frequently Asked Questions
How much do Google Ads cost for construction materials companies?
The average CPC for construction materials Google search ads is $2.85–$3.50, below the $6.45 general construction average. Monthly spend ranges from $3,200–$8,500 for SMBs to $15,000–$45,000 for enterprise distributors. Cost-per-lead averages $65–$110 depending on product category and geographic scope. Google Shopping ads offer the lowest CPC at $0.88.
What is a good conversion rate for construction Google Ads?
The average conversion rate for construction materials Google Ads is 3.4%. Lead generation campaigns average 4.2–6.8%, while e-commerce campaigns average 1.8%. Top 10% performers achieve 9.5% CVR on product-specific landing pages. Brand search campaigns convert at 7.5%, making them the highest-converting campaign type.
Should construction materials companies use Google Shopping ads?
Yes, if they sell products online. Google Shopping ads deliver the lowest CPC ($0.88) and competitive conversion rates (2.1%) for construction materials. Companies that include technical specifications in Shopping feed titles see 28–35% higher CTR. Shopping campaigns are especially effective for standardized products like fasteners, adhesives, and basic building supplies.
How does Google Ads compare to social media for construction materials marketing?
Google Ads delivers higher conversion rates (3.4% vs. 1.8%) and higher lead quality than social media for construction materials. However, social media ads cost less ($1.30 CPC vs. $3.18) and are more effective for brand awareness and remarketing. The best construction marketing strategies combine both channels — companies using Google Ads and social media together see 15–25% higher overall ROAS.
What is the average ROAS for construction industry PPC?
Construction industry PPC generates an average 3.8× ROAS. Construction materials companies specifically see 3.2–5.5× ROAS depending on whether they sell direct to consumers (higher) or through B2B channels (lower absolute ROAS but higher margin per sale). Companies that spent on Google Ads across search, display, and shopping channels achieve 15–25% higher return than single-format advertisers.
Sources
CuFinder — Building & Construction Materials Marketing Benchmarks 2026
CuFinder — Construction Industry Marketing Benchmarks 2026
Elev8 Operations — Contractor CPL Benchmarks 2026
PipelineOn — Google Ads Costs for Contractors 2026
Databox — Google Ads Benchmarks by Industry
Siana Marketing — Construction Marketing ROI 2026 Report
Technavio — Construction Materials Market Analysis 2026–2030
BuilderMuse — Construction Technology Spending Analysis


