



Table of contents
The average franchised dealership spent USD 586,246 on advertising in 2025, and USD 123,698 of that went to search engine marketing alone. That single NADA figure sets the floor for any Google Ads conversation a dealer group has this year, and the category-level benchmarks below show where that budget performs and where it does not.
Key Takeaways
- Average dealership ad spend was USD 586,246 in 2025, up 7.8% year over year.
- Search engine marketing averaged USD 123,698 per dealership, the largest line item.
- Third-party listing sites took USD 117,249 and SEO took USD 114,318.
- Dealerships spent USD 739 per new vehicle sold on advertising in 2025.
- The 2025 ad-to-sales ratio was 0.77%, down from 1.00% in 2015.
- The all-industry average Google Ads CPC is USD 5.42 in 2026.
- Automotive-For-Sale CPC runs USD 2.27, below the all-industry average.
- Automotive-Repair, Service and Parts CPC runs USD 4.35.
- Automotive-For-Sale click-through rate is 8.28% against a 6.64% average.
- Automotive-Repair click-through rate is 5.56%, below average.
- Automotive-For-Sale cost per lead rose 13.90% in 2026, the largest jump tracked.
- Automotive-Repair cost per lead rose 5.12% over the same period.
- Powersports/marine dealer accounts average a USD 1.14 CPC per Dealer Spike's own book.
- Those same accounts convert at 8.5% on Google Search.
- 84% of AI-tool users rate their shopping experience highly versus 71% of non-users.
- Auto shoppers use 24 research touch points on average before buying (Google/Millward Brown).
- 72% of search sessions involve cross-shopping between models or brands.
- The powersports industry carries a USD 50.9 billion economic footprint (MIC).
What the average rooftop actually spends
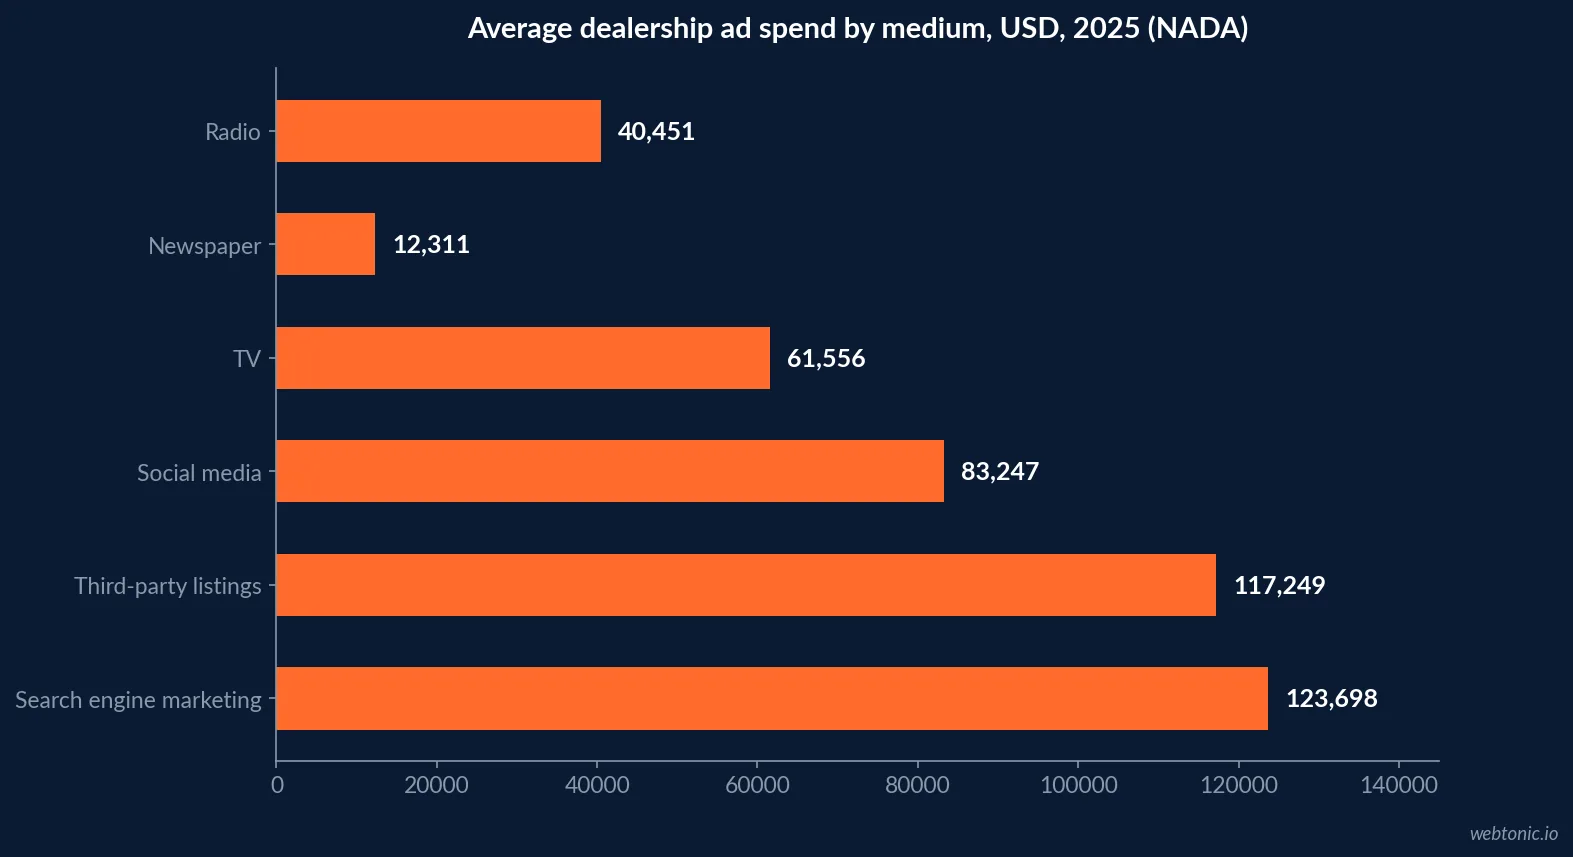
The NADA 2026 Annual Financial Profile of America's Franchised New-Car Dealerships puts total average dealership advertising spend at USD 586,246 in 2025, a 7.8% increase over 2024, spread across search engine marketing, SEO, social, third-party listings, TV, radio, newspaper and direct mail. Search engine marketing is not a side channel here - it is the largest single line item in the entire advertising budget.
Ten years earlier the average dealership spent USD 520,029, or USD 633 per vehicle sold. The dollar total climbed 12.7% over the decade and the per-vehicle figure climbed 16.2%, even as the share of revenue spent on advertising fell - a budget that is growing in absolute terms while shrinking as a percentage of a much larger revenue base.
| Ad medium (2025) | Average spend per dealership | Share of total budget | Source |
|---|---|---|---|
| Search engine marketing | USD 123,698 | 21.1% | NADA |
| Third-party listing sites | USD 117,249 | 20.0% | NADA |
| SEO website optimization | USD 114,318 | 19.5% | NADA |
| Social media advertising | USD 83,247 | 14.2% | NADA |
| Television | USD 61,556 | 10.5% | NADA |
| Radio | USD 40,451 | 6.9% | NADA |
Where the Google Ads dollar performs best
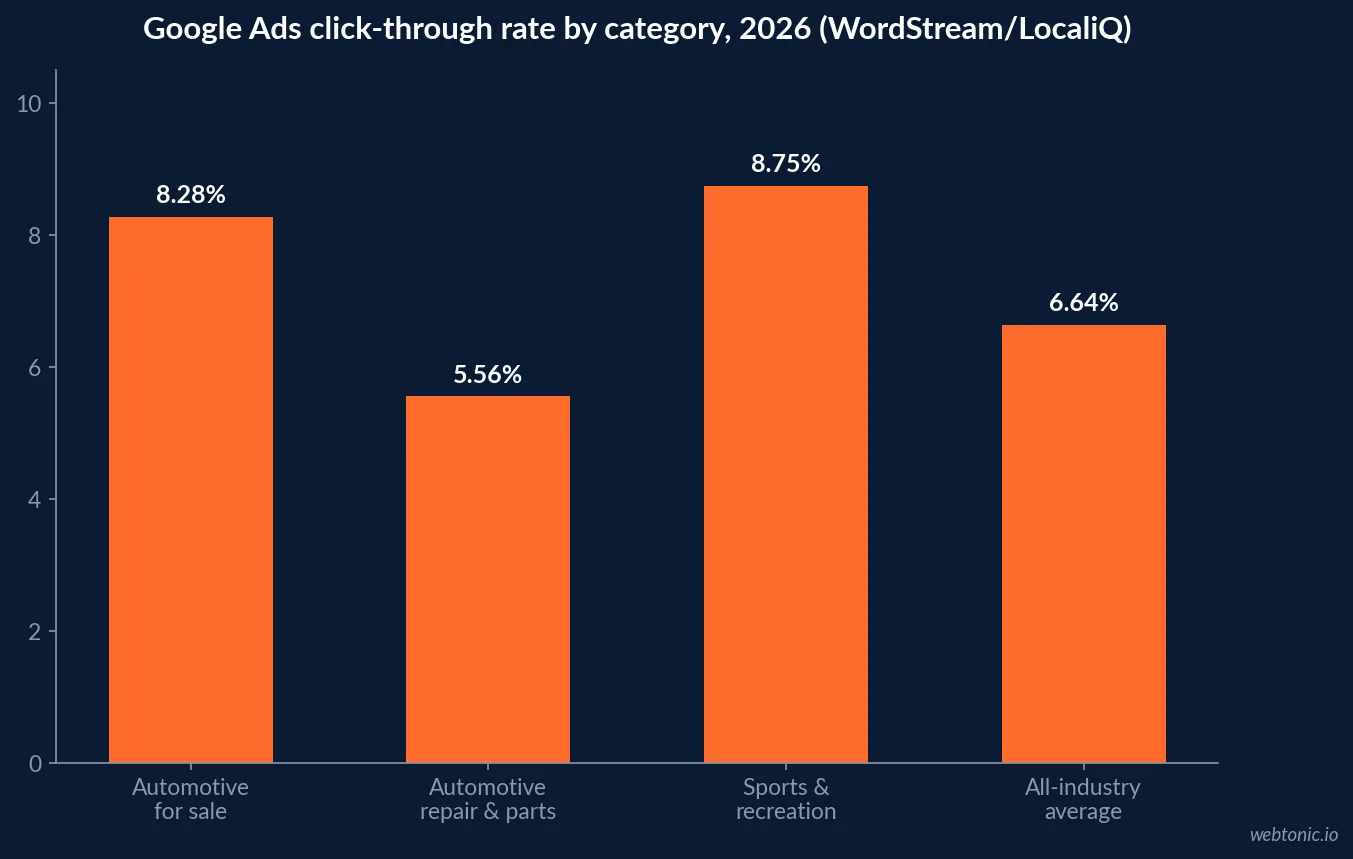
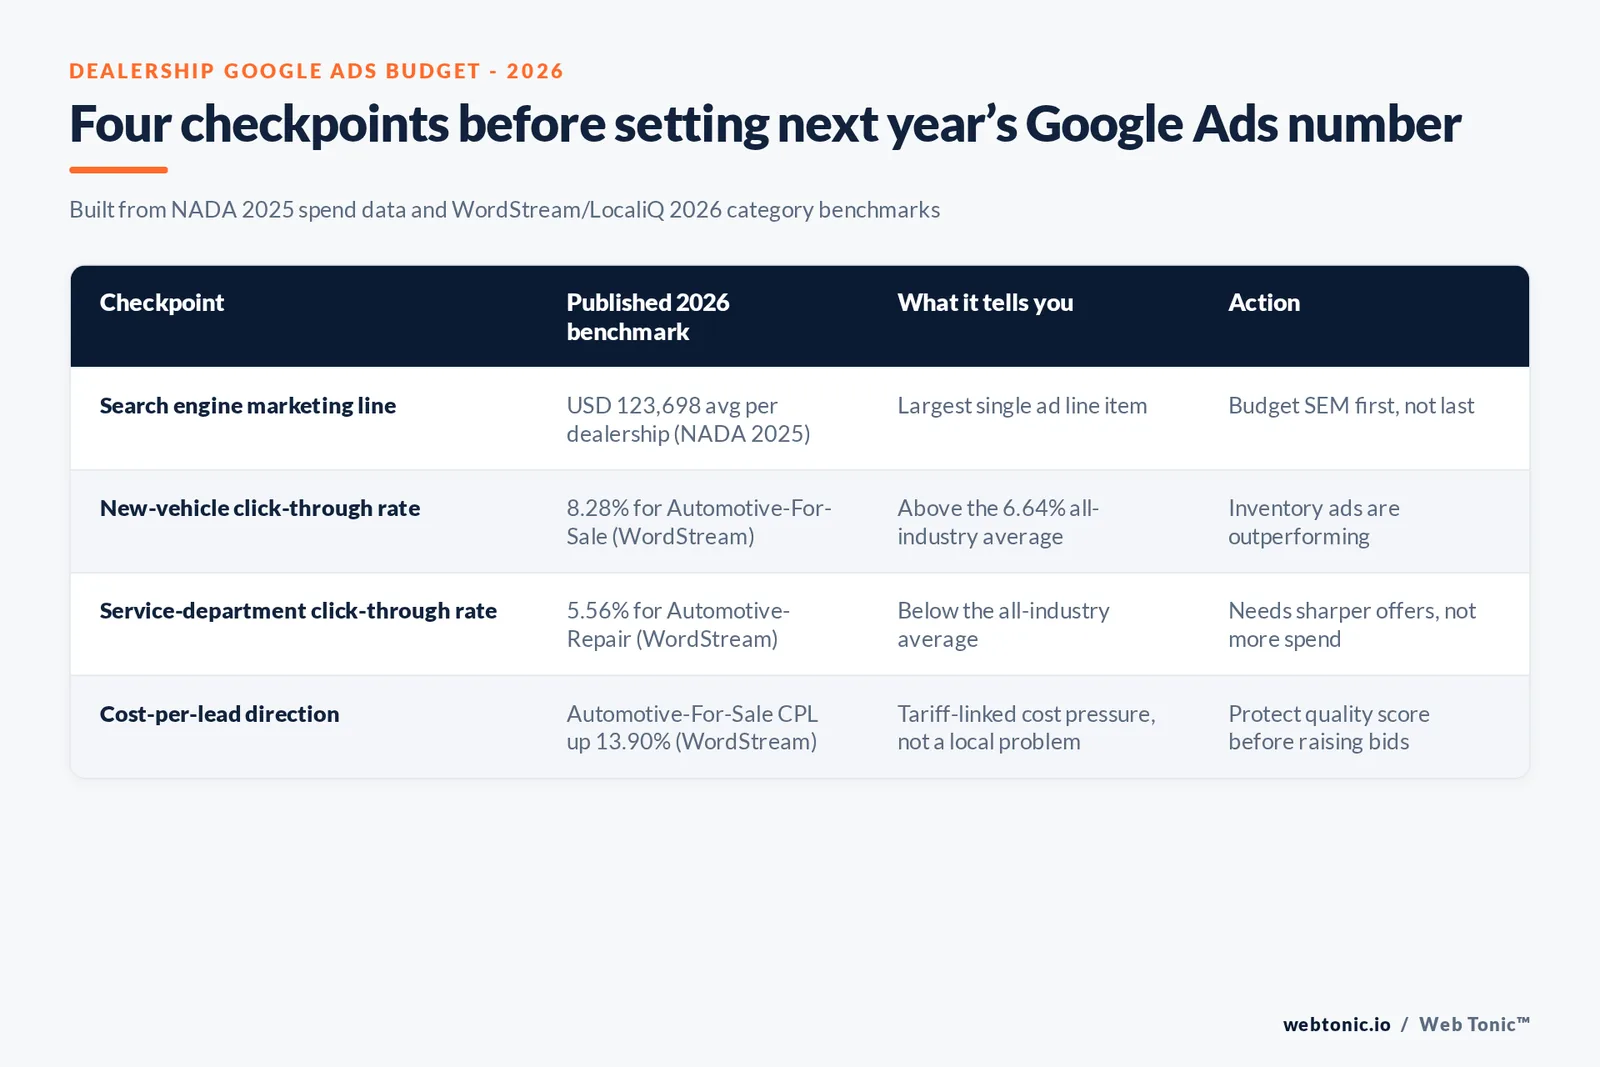
The WordStream 2026 Google Ads Benchmarks report, built from over 13,000 LocaliQ search campaigns running April 2025 through March 2026, splits automotive into two very different lines. Automotive-For-Sale clicks at 8.28%, comfortably above the 6.64% all-industry average CTR, and its CPC of USD 2.27 sits well under the USD 5.42 all-industry average. Automotive-Repair, Service and Parts clicks at 5.56% and costs USD 4.35 a click - a weaker click rate at a higher price, because service-bay searches carry less visual pull than a vehicle listing.
LocaliQ's automotive-specific search benchmarks confirm the pattern from the buyer side: cost per click rose for more than half of automotive advertisers even as overall CPC inflation ran hotter across the full benchmark set, meaning automotive is not the category driving the market-wide price increase.
| Category (2026) | Avg. CTR | Avg. CPC | YoY cost-per-lead change | Source |
|---|---|---|---|---|
| Automotive - For Sale | 8.28% | USD 2.27 | +13.90% | WordStream/LocaliQ |
| Automotive - Repair, Service & Parts | 5.56% | USD 4.35 | +5.12% | WordStream/LocaliQ |
| Sports & Recreation (proxy category) | 8.75% | USD 2.77 | Not broken out | WordStream/LocaliQ |
| All-industry average | 6.64% | USD 5.42 | First decline in 5 years | WordStream/LocaliQ |
Why cost per lead climbed while cost per click fell
WordStream's 2026 report calls out a specific and unusual pattern: 2026 marked the first year-over-year decline in average cost per lead across its full dataset since before 2020, yet Automotive-For-Sale posted the single largest cost-per-lead increase of any tracked category, up 13.90%, and Automotive-Repair, Service and Parts rose 5.12% - both inside the group of categories WordStream ties directly to tariff exposure, alongside Health and Fitness and Career and Employment.
That is a conversion-rate story, not a click-price story. Automotive-For-Sale CPC actually fell 5.81% year over year, the third-largest CPC decrease WordStream tracked, so clicks got cheaper while fewer of them turned into a qualified lead - the signature of tariff-driven hesitation showing up mid-funnel rather than at the auction.
The powersports and marine side of the ledger
No industry association currently publishes a Google Ads CPC and conversion-rate benchmark specifically for powersports or marine dealers, so treat the automotive figures above as a cross-industry proxy for that segment. The closest independent data point comes from Dealer Spike, a marketing vendor serving powersports, marine and outdoor power equipment dealers, which reports its own accounts averaging a Google Search CPC near USD 1.14 and an 8.5% conversion rate through November 2025 - cheaper clicks than either automotive category above, though this is vendor-reported book data rather than an independent industry census.
The Motorcycle Industry Council puts the powersports industry's US economic footprint at USD 50.9 billion with 11 million motorcycles in use nationwide, and MIC's 2026 Statistical Annual tracks dealer economics alongside unit sales, but neither publishes a Google Ads benchmark - the gap this page states plainly rather than papering over with an automotive number relabeled.
What buyers are doing before they click a search ad
The Think with Google / Millward Brown Digital auto shopper research found that today's in-market shoppers use 24 research touch points on average and that 72% of search sessions involve cross-shopping between models or brands, which is why a single-keyword, single-model campaign structure under-serves how buyers actually search. Cox Automotive's 2025 Car Buyer Journey Study adds a 2026-specific wrinkle: buyers who use AI-powered shopping tools report an 84% overall satisfaction rate versus 71% for non-users, and 63% versus 48% on how long the process felt, evidence that clean, structured inventory data feeding AI Overviews and AI Max is now part of the search budget conversation, not an add-on.
| Buyer behavior signal (2025-2026) | Figure | Source | What it means for Google Ads |
|---|---|---|---|
| Average research touch points | 24 | Think with Google | Broad match and RSAs need multi-keyword coverage |
| Search sessions involving cross-shopping | 72% | Think with Google | Competitor-model terms are worth bidding |
| AI-tool users' overall satisfaction | 84% vs. 71% non-users | Cox Automotive 2025 | Feed clean inventory data to AI Max |
| AI-tool users satisfied with process length | 63% vs. 48% non-users | Cox Automotive 2025 | Speed-to-answer now competes for budget |
Keyword themes worth budgeting for by category
The 24-touch-point research pattern above translates into three keyword themes that consistently pull qualified traffic for dealership accounts: model-versus-model comparison terms, trim and configuration terms, and local-inventory terms that name the dealership's city or region. Repair and service accounts see the opposite pattern - branded service-plan terms and named-repair terms out-convert generic "auto repair" queries by a wide margin, which is consistent with the category's lower 5.56% CTR on broad terms.
| Keyword theme | Best-fit campaign | Why it earns budget | Risk if ignored |
|---|---|---|---|
| Model-vs-model comparison | For-Sale, upper funnel | Matches the 72% cross-shopping rate | Competitor conquest traffic goes elsewhere |
| Trim/configuration terms | For-Sale, mid funnel | Matches high-intent, late-stage research | Generic terms cost more per qualified click |
| Local-inventory + city terms | For-Sale, lower funnel | Converts fastest against local competitors | Budget wasted on non-local clicks |
| Named-service terms | Repair/Service | Out-converts generic auto-repair terms | Broad terms drag down category CTR further |
| OEM warranty/recall terms | Repair/Service | Captures owners already in-brand | Cedes low-cost retention traffic to competitors |
Structuring the account around the two categories
Because Automotive-For-Sale and Automotive-Repair behave like two different industries inside one Google Ads account, the practical fix is separating them at the campaign level rather than blending inventory and service-bay keywords under one budget. A For-Sale campaign chasing the 8.28% category CTR wants broad-match inventory feeds and dynamic search ads that surface the actual vehicle; a Repair campaign fighting a 5.56% CTR and a USD 4.35 CPC needs tighter exact-match sets around named services (oil change, brake replacement, tire rotation) so budget is not spent on generic "car repair near me" queries that convert at a fraction of the rate.
Negative keyword lists earn their keep here: without them, a For-Sale campaign's inventory terms routinely leak spend into service-intent queries and vice versa, which is the fastest way to make a healthy 8.28% blended CTR look mediocre on both sides of the account.
| Account structure decision | For-Sale campaigns | Repair/Service campaigns | Why it matters |
|---|---|---|---|
| Match type mix | Broad + dynamic search ads | Exact + phrase, tightly grouped | Repair CPC is 92% higher than For-Sale |
| Primary asset | Live inventory feed | Named service pages | For-Sale CTR is 49% above Repair CTR |
| Bid strategy under CPL pressure | Maximize conversions with a cap | Target CPA, reviewed monthly | For-Sale CPL rose 13.90% on falling CPC |
| Negative keyword direction | Exclude service-intent terms | Exclude shopping-intent terms | Cross-leakage dilutes both categories' CTR |
Setting the 2026 number
A defensible 2026 Google Ads budget for a single-rooftop dealer starts from the NADA average of USD 123,698 in search engine marketing and adjusts for two things: which side of the business is being funded, since For-Sale and Repair campaigns behave like different categories with different CTRs and CPCs, and whether cost-per-lead is rising for tariff reasons that no bid strategy fixes. For a powersports or marine rooftop with no published channel benchmark, start from the automotive proxy figures, then replace them with the dealer's own trailing 90-day account data as fast as volume allows - which is exactly what Dealer Spike's own reported averages already do for its book.
For a group managing spend across several rooftops, our growth marketing team can build that reallocation model account by account, our breakdown of what Google Ads actually costs across industries is a useful gut-check before setting next year's number, and our roundup of Google Ads agencies is a starting point if the account needs a second pair of hands before Q1 budgets lock.
Frequently Asked Questions
How much do car dealerships spend on Google Ads?
NADA's 2026 Annual Financial Profile puts average total dealership advertising spend at USD 586,246 in 2025, up 7.8% over 2024, with search engine marketing alone averaging USD 123,698 per rooftop - the single largest line item ahead of third-party listing sites (USD 117,249) and SEO (USD 114,318). That works out to USD 739 in total advertising per new vehicle sold, an ad-to-sales ratio of 0.77%.
Is Google Ads more or less expensive for automotive than other industries?
It depends on which side of the rooftop is buying. WordStream's 2026 Google Ads benchmarks put Automotive-For-Sale CPC at USD 2.27, below the USD 5.42 all-industry average, while Automotive-Repair, Service and Parts runs USD 4.35. Click-through rate tells the same story in reverse: For-Sale campaigns click at 8.28% against a 6.64% all-industry average, while Repair and Parts clicks at 5.56%, below it.
Why did cost per lead rise for dealership Google Ads in 2026?
WordStream attributes it to tariffs. Automotive-For-Sale saw the largest cost-per-lead increase of any tracked category, up 13.90% year over year, alongside Automotive-Repair, Service and Parts, up 5.12%, in the same tariff-exposed group as Health and Fitness and Career and Employment. Average CPC for the For-Sale category actually fell 5.81% over the same period, so the increase is a conversion-rate story, not a click-price story.
Does Google Ads spend differ for powersports and marine dealers?
The published category-level benchmarks are automotive-specific, so treat the figures for motorcycle, ATV, boat and RV dealers as a cross-industry proxy unless a dealer's own account data says otherwise. Dealer Spike, an agency running search accounts for powersports, marine and outdoor power equipment dealers, reported average Google Search CPC near USD 1.14 and an 8.5% conversion rate across its own book through November 2025 - a useful independent data point until the industry associations publish channel-level PPC benchmarks of their own.
Should a dealer shift Google Ads budget toward AI-driven search features?
Cox Automotive's 2025 Car Buyer Journey Study found that mostly-digital buyers who use AI shopping tools report meaningfully higher satisfaction: 84% versus 71% for non-users on overall shopping experience, and 63% versus 48% on how long the process took. That satisfaction gap is an argument for feeding AI Overviews and AI Max campaigns clean inventory data, not for cutting traditional search spend outright.
Sources
NADA - 2026 Annual Financial Profile of America's Franchised New-Car Dealerships
WordStream/LocaliQ - 2026 Google Ads Benchmarks
LocaliQ - Automotive Search Advertising Benchmarks for 2026
Cox Automotive - 2025 Car Buyer Journey Study Summary
Think with Google / Millward Brown Digital - Digital Drives auto shopper research
Motorcycle Industry Council - Powersports industry statistics
Powersports Business - MIC releases 2026 Motorcycle Statistical Annual
Dealer Spike - High CPCs, low lead counts: what dealers need to know


