Table of contents
The median bounce rate across industries is 44.04%, but that single number hides a 20-point gap between mobile (roughly 58-62%) and desktop (roughly 41%), and an even bigger gap between a checkout page (32.7%) and a blog post (76.8%). This page breaks bounce rate down by device, industry and page type so you can benchmark against the number that actually applies to your page.
Key Takeaways
- Median bounce rate across all industries is 44.04% as of the latest Databox analysis.
- Mobile bounce rate averages 58.4% to 62.1% depending on the dataset.
- Desktop bounce rate averages around 41.2%, roughly 20 points lower than mobile.
- SaaS websites average a 48.27% median bounce rate under the GA4 definition.
- Apparel and footwear sites average the lowest median bounce rate, at 35.76%.
- Information technology and services sites run highest, at 48.38%.
- Blog post pages bounce at roughly 70% to 77% in most studies.
- Checkout pages bounce at just 32.7%, the lowest of any common page type.
- 404 error pages bounce at 98.7% by definition.
- Pages loading in under 3 seconds bounce at roughly 39.2% versus 70%-plus for slower pages.
- A 1-second increase in load time raises bounce probability as pages slow from 1 to 3 seconds.
- Sites with mobile speeds under 3 seconds see 15.4% more conversions.
- Global bounce rate fell 2.3% year over year in the last broad trend study.
- A 100% bounce rate means every single visitor left without engaging - the absolute ceiling of the metric.
Bounce Rate at a Glance (2026)
Before the device, industry and page-type breakdowns, here is the definition and the top-line number GA4 gives every site owner in 2026.
| Metric | 2026 figure | What it tells you |
|---|---|---|
| GA4 bounce rate formula | Unengaged sessions / total sessions × 100 | Inverse of engagement rate |
| Engaged session minimum | 10 seconds, 2+ pageviews, or a conversion event | Not the old single-pageview rule |
| Median bounce rate, all industries | 44.04% | Your baseline comparison point |
| Mobile bounce rate | 58.4%-62.1% | The device gap you cannot ignore |
| Desktop bounce rate | ~41.2% | Roughly 20 points lower than mobile |
| Bounce rate on sub-3-second pages | ~39.2% | Speed is the highest-leverage lever |
Bounce Rate Means Something Different Since GA4
Per Semrush's 2026 guide, GA4 defines bounce rate as the inverse of engagement rate: a session is "engaged" if it lasts at least 10 seconds, includes at least two pageviews or screenviews, or triggers a conversion event. That is a materially looser definition than Universal Analytics' single-pageview standard, which is why a site's reported bounce rate often looks better after a GA4 migration even with no design changes.
Ahrefs adds an important caution: bounce rate is also skewed by ad blockers (which prevent tracking codes from firing at all), slow-loading pages (users bounce before the tracking code even loads), and session timeout edge cases - so a raw bounce rate number should never be read without checking whether tracking itself is complete.
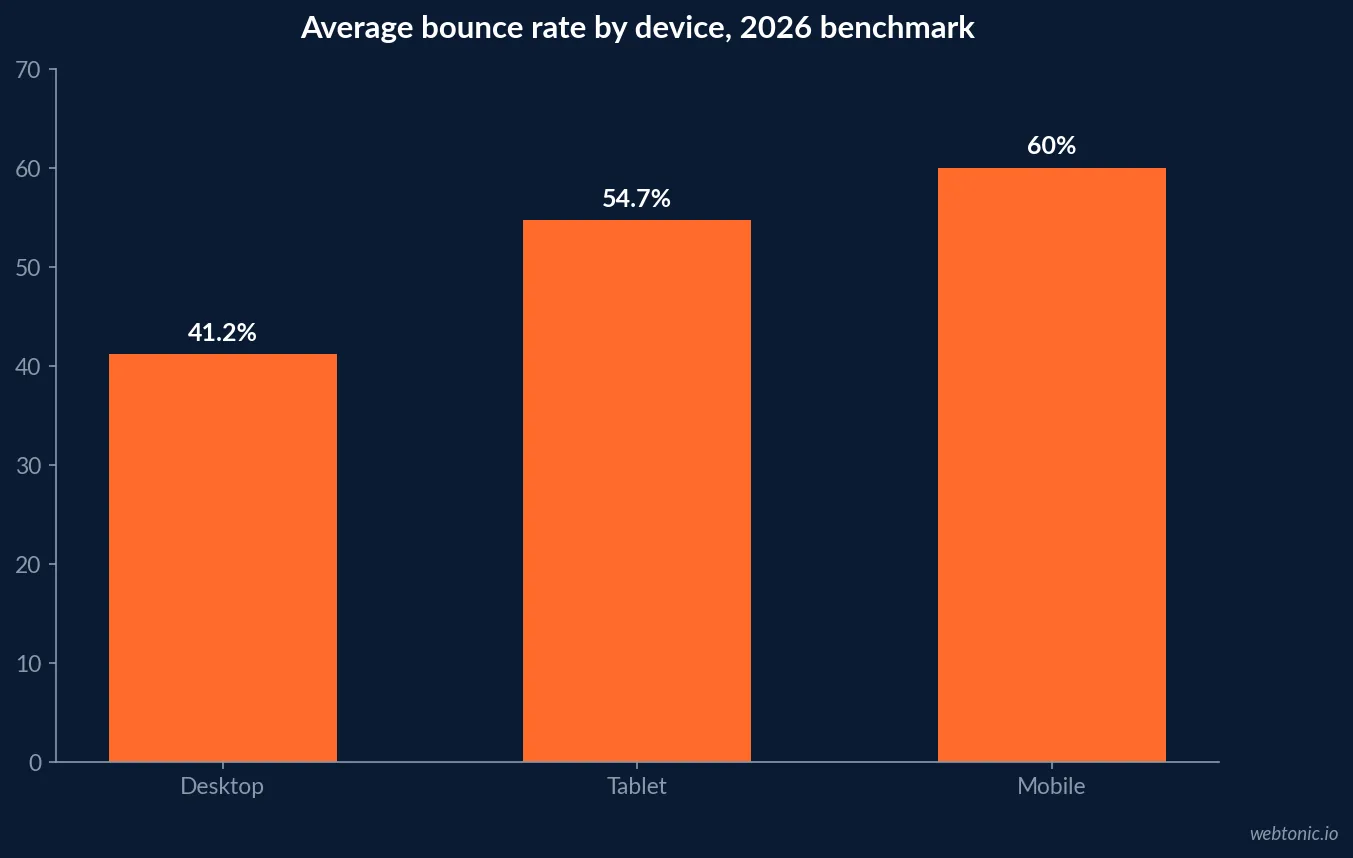
| Device | Average bounce rate | Why it differs |
|---|---|---|
| Mobile (all sites) | 58.4%-62.1% | Smaller screens, slower connections, quick-intent visits |
| Tablet | ~54.7% | Between mobile and desktop behavior patterns |
| Desktop | ~41.2% | Larger screens, faster connections, more deliberate sessions |
| Pages under 3s load time (any device) | ~39.2% | Speed narrows the device gap significantly |
| Pages over 3s load time | 70%+ | Users abandon before content ever renders |
Bounce Rate by Industry: The Median Is 44.04%, But Nobody Is Actually Average
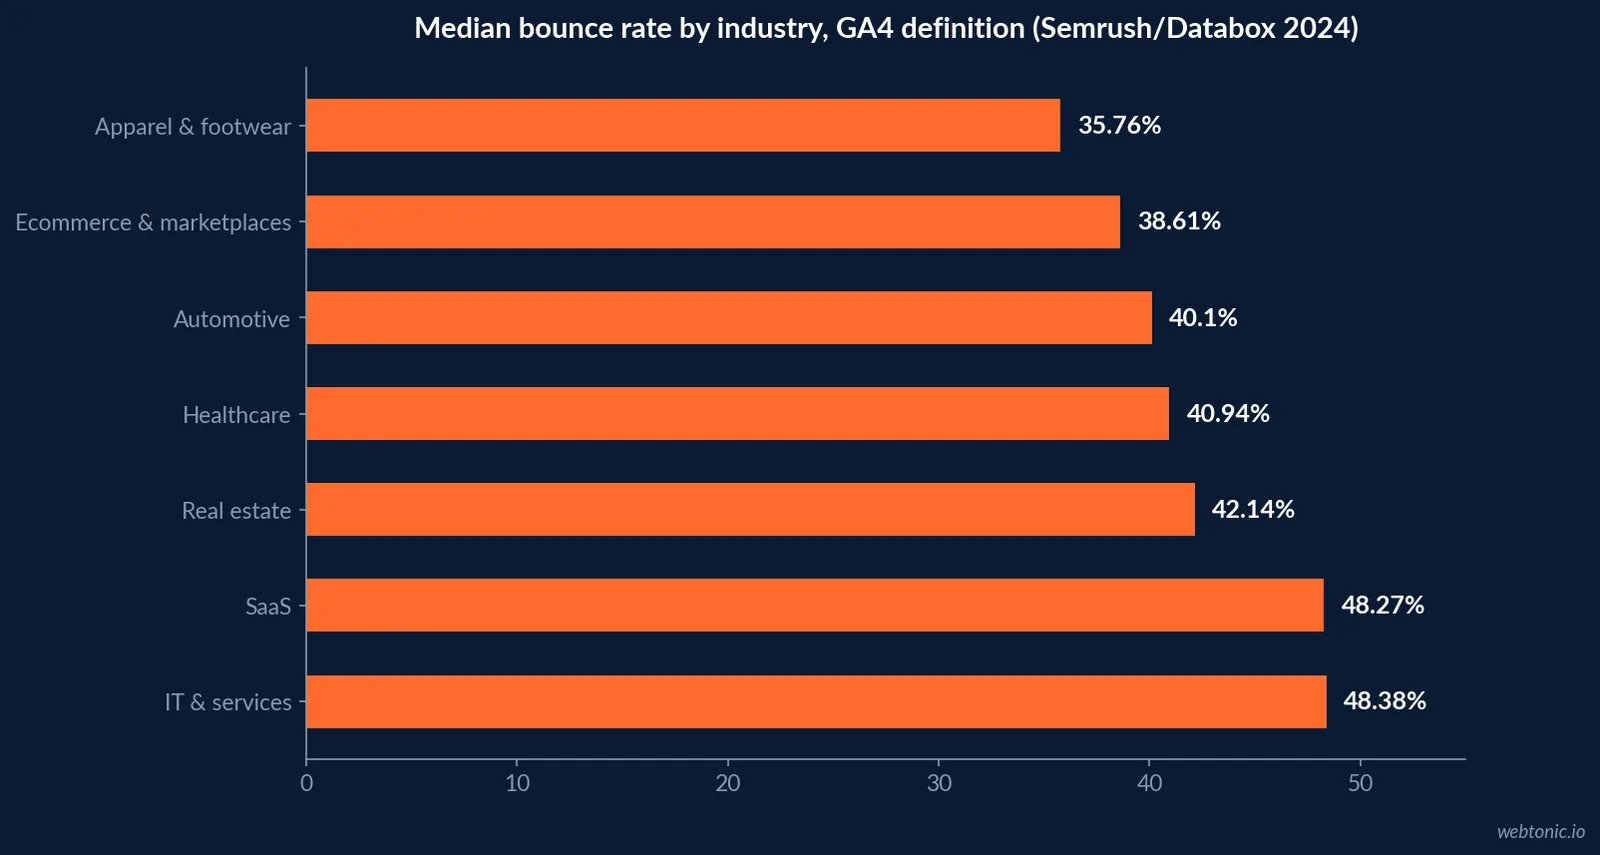
Semrush's 2026 guide reports the median bounce rate across all industries at 44.04%, based on Databox data from September 2024, with a meaningful spread beneath that headline. Apparel and footwear sites run lowest at 35.76%, while information technology and services sites run highest among the tracked verticals at 48.38%. SaaS sites sit close behind at 48.27%.
| Industry | Median bounce rate (GA4) |
|---|---|
| Apparel and footwear | 35.76% |
| Ecommerce and marketplaces | 38.61% |
| Food | 38.93% |
| Automotive | 40.1% |
| Healthcare | 40.94% |
| Real estate | 42.14% |
| Education | 46.28% |
| SaaS | 48.27% |
| Information technology and services | 48.38% |
Source: Semrush (Databox data, September 2024), GA4 engaged-session definition.
Bounce Rate by Page Type: Where a High Number Is a Feature, Not a Bug
Compiled figures from Gitnux's bounce rate report show the widest spread of all when you segment by page type rather than site or device. Checkout pages bounce at just 32.7% because visitors who reach checkout are already committed, while blog post pages bounce at 76.8% because most single-article readers get their answer and leave - and 404 error pages bounce at 98.7% by definition, since there is nowhere else on the page to go.
The practical lesson: never benchmark a blog post against a product page's bounce rate, or a FAQ page against a checkout flow. Match the comparison to the job the page is doing.
| Page type | Typical bounce rate | Is a high number a problem here? |
|---|---|---|
| Checkout page | 32.7% | Yes - low bounce is the entire point of the funnel |
| Product page (ecommerce) | 44.7% | Moderate concern if paired with low add-to-cart rate |
| Homepage | 52.3% | Depends on whether homepage is a landing destination |
| Pricing page (SaaS) | 47.2% | Watch closely - high-intent page, should convert or link onward |
| FAQ page | 54.6% | Usually fine - visitors often want one answer |
| Blog post | 76.8% | Normal - single-article intent is usually satisfied fast |
| 404 error page | 98.7% | Expected by definition, not a design failure |
Speed Is the Highest-Leverage Bounce Rate Fix
Across multiple studies compiled by Gitnux, pages loading under 3 seconds bounce at roughly 39.2% versus 70% or higher for pages that take longer, and sites with mobile load speeds under 3 seconds see 15.4% more conversions. Core Web Vitals improvements are associated with a further bounce reduction of roughly 3.7% on top of that baseline speed effect.
This is the fix within full control of most site owners, unlike industry median or device mix, which is why any bounce-rate improvement plan should audit load time before touching copy, layout, or calls to action.
| Speed factor | Bounce rate impact | Source |
|---|---|---|
| Load time under 3 seconds | ~39.2% bounce | Gitnux compilation |
| Load time over 3 seconds | 70%+ bounce | Gitnux compilation |
| Mobile speed under 3 seconds | +15.4% conversions | Gitnux compilation |
| Core Web Vitals pass | -3.7% bounce (2022-2023) | Gitnux compilation |
| AMP pages (mobile) | ~39.4% bounce | Gitnux compilation |
Bounce Rate vs. Exit Rate: Two Metrics, Two Different Fixes
Per Crazy Egg, bounce rate and exit rate answer different questions and need different fixes. Bounce rate is a first-impression metric measuring visitors who leave after viewing only one page - driven by content-intent mismatch, slow load, poor first impressions, or the wrong traffic source. Exit rate measures visitors leaving from a specific page regardless of how many pages they viewed first, and is more useful on checkout pages, funnel steps, and thank-you pages, where the fix is usually conversion friction rather than a first-impression problem. Every bounce is an exit, but not every exit is a bounce - conflating the two sends teams fixing the wrong page.
Contentsquare frames a favorable bounce rate range at roughly 40% to 50% in general terms, and cites a retail site that cut bounce rate by 60% purely through design and navigation fixes, plus a tech site that gained a 35% increase in time-on-site by adding multimedia and internal links - both without touching load speed at all.
How Bounce Rate Has Trended Since 2020
Per Gitnux's compilation, global bounce rate fell 2.3% in the most recent year-over-year comparison, settling near 51.7% under an older, stricter definition than GA4 now uses, after stabilizing around 49.8% post-pandemic versus 54.1% in 2020. Mobile bounce moved the opposite direction, rising roughly 5.1% year over year even as overall averages improved - a sign that desktop and speed-optimized pages are driving the overall improvement while unoptimized mobile experiences lag further behind.
Seasonal patterns are consistent too: e-commerce bounce rate typically drops sharply during Q4 holiday shopping (high purchase intent traffic) and rises in January (browsing, not buying), which is a useful sanity check before reading a single month's number as a trend.
A Bounce Rate Diagnosis Checklist for 2026
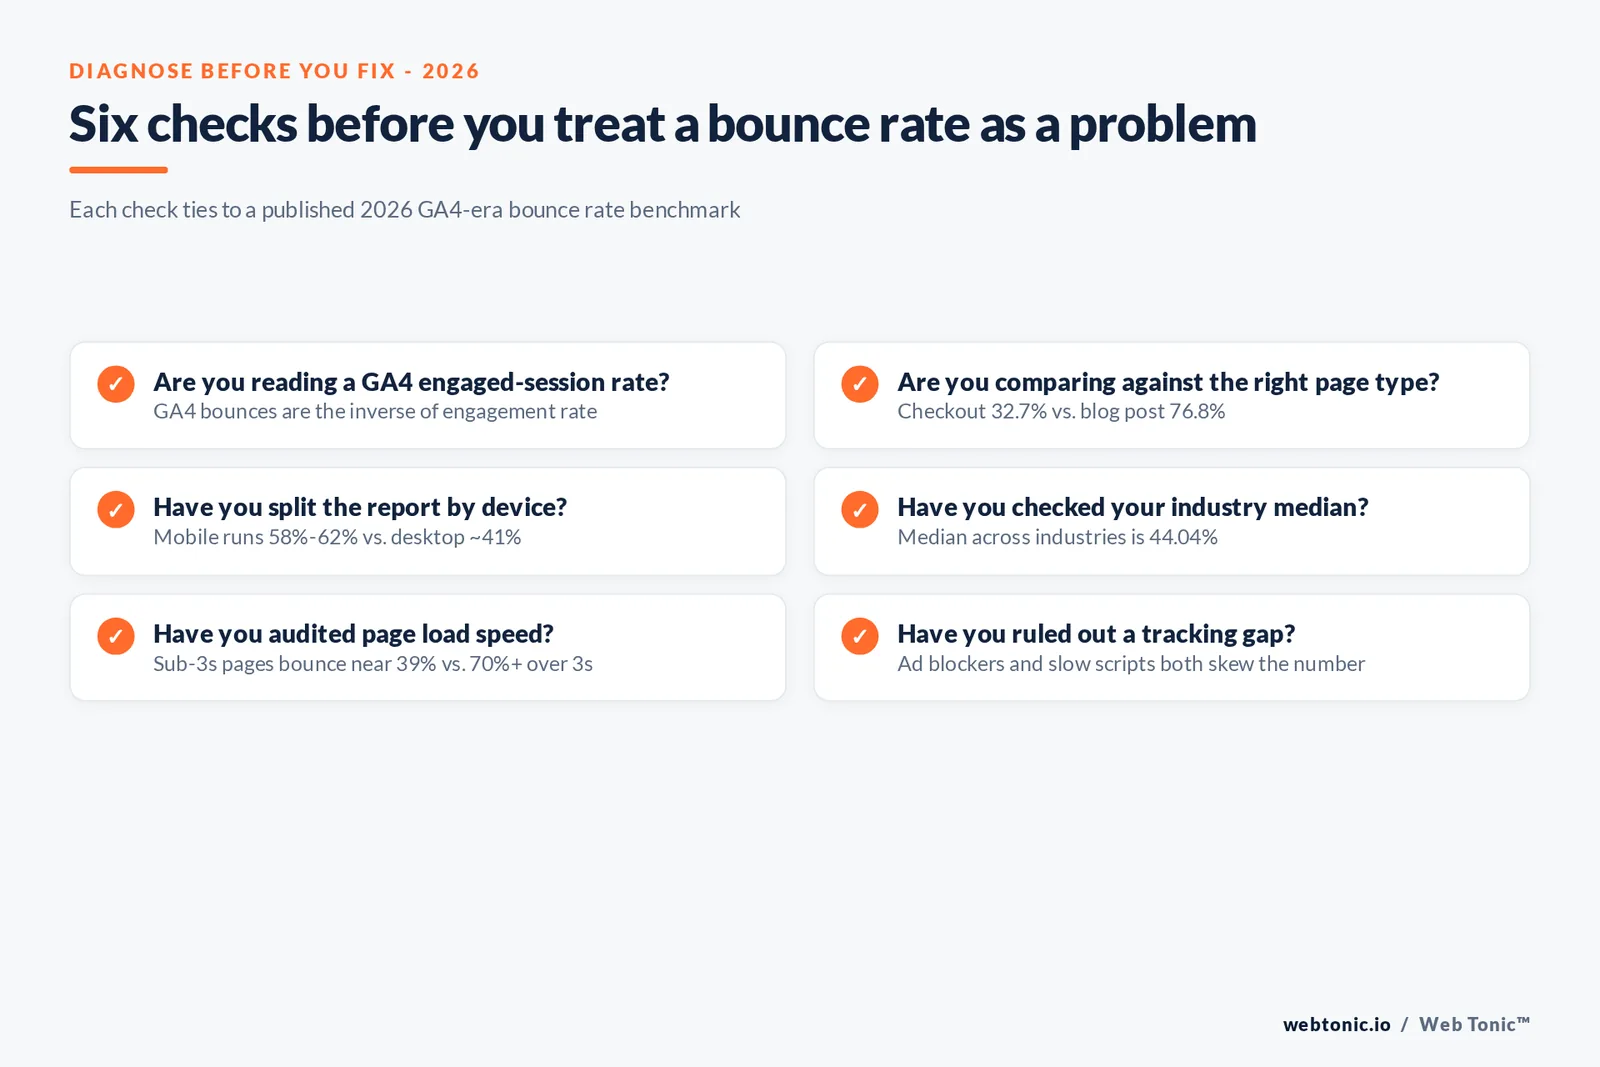
- Confirm you are reading a GA4 engaged-session-based bounce rate, not a legacy Universal Analytics number - they are not directly comparable.
- Compare each page against its own type's benchmark (checkout vs. blog vs. homepage), not a single site-wide average.
- Split every report by device before drawing conclusions; a 20-point mobile-desktop gap is normal, not a red flag on its own.
- Audit page speed first when bounce rate is genuinely high on a page that needs a second action - the swing from under 3 seconds to over 3 seconds is close to a 2x bounce-rate difference.
- Treat a high bounce rate on an FAQ, glossary, or single-answer page as a signal of success, not failure, unless time-on-page data says otherwise.
- Re-check ad blocker and tracking coverage before trusting a sudden bounce rate change - measurement gaps produce the same signature as a real behavioral shift.
Where Bounce Rate Fits Into a Broader CRO Plan
Bounce rate is a diagnostic, not a KPI to optimize in isolation - the goal is always the action the page is supposed to drive. If your product or landing pages run above the benchmarks in this guide, our performance creative team can rebuild the page experience, and our data and analytics practice can confirm your GA4 setup is measuring engaged sessions correctly before you act on any number. If paid traffic is landing on the pages in question, our Google Ads cost guide is a useful companion for making sure the spend and the landing page are aligned.
Frequently Asked Questions
What counts as a bounce rate in 2026, now that GA4 has replaced Universal Analytics?
GA4 defines bounce rate as the inverse of engagement rate, where an engaged session must last at least 10 seconds, include at least two pageviews or screenviews, or trigger a conversion event. That is a meaningfully different definition than the old Universal Analytics standard of a single-pageview session, so any bounce rate benchmark from before the GA4 transition is not directly comparable to a 2026 number - always check which definition a given statistic uses before comparing your own site against it.
What is a good bounce rate to aim for in 2026?
It depends heavily on page type and industry, but Semrush reports the median bounce rate across all industries at 44.04% as of a September 2024 Databox analysis, with a practical rule of thumb that many sites aim for around 40% or lower and rates of 60% or higher often signal a page not meeting user expectations. Industry benchmarks range from 35.76% for apparel and footwear up to 48.38% for information technology and services, so the honest target is your own industry median, not a single universal number.
Why is mobile bounce rate so much higher than desktop?
Device-level data shows a persistent and large gap: mobile bounce rate averaged 58.4% to 62.1% depending on the study, against roughly 41.2% on desktop. Slower connections, smaller screens, impatience with load time, and a higher share of quick-intent searches (checking a phone number or address) all push mobile bounce higher structurally, not just because of worse mobile design - though poor mobile design widens the gap further.
Is a high bounce rate always a bad sign?
No. A page built to answer one question fast - a glossary entry, a store hours page, a single FAQ answer - can have a high bounce rate while fully satisfying the visitor's intent, because the visitor got what they came for and left. Blog posts average roughly 70-77% bounce rate across multiple studies precisely because most single-article readers do not need a second page. The metric only signals a problem when it is high on a page that needs a second action, like a product or checkout page.
Does page speed actually move bounce rate as much as people say?
Yes, and the effect size is large. Ahrefs and industry benchmark data consistently show pages loading under 3 seconds bouncing at roughly half the rate of pages taking over 3 seconds - one widely cited figure puts sub-3-second bounce at 39.2% versus 70% or higher for slower pages. Since page speed is also one of the few bounce-rate drivers a site fully controls, it is usually the highest-leverage fix before touching copy or design.
Sources
Semrush - What Is Bounce Rate? And How to Reduce It
Ahrefs - What Is Bounce Rate? How to Interpret and Work with It
Gitnux - Bounce Rate Statistics
Contentsquare - How to Improve Your Average Bounce Rate
Crazy Egg - Bounce Rate vs Exit Rate