Table of contents

How we vet every listicle
Every agency featured on Web Tonic passes our 84-point editorial review before a single listicle goes live. This is how we vet each pick:
Verified client outcomes: We require real case studies with measurable KPIs — revenue, ROAS, CPA, retention — tied to the exact category being ranked. No cherry-picked wins, no unverifiable numbers.
Independent reputation: We cross-check Clutch, Google, G2, and Trustpilot ratings, and screen for review-bombing or suspicious patterns. Only operators with a consistent, verifiable track record make the cut.
Beyond that, every listing goes through a quarterly re-audit. We check 84 criteria across 6 pillars to make sure it still holds up — here are some of the checks we run:
There is no single best ecommerce marketing company, because ecommerce marketing agencies split into five groups that solve different problems at very different price points. This guide maps the groups, the services that move revenue, and the numbers to hold any agency to before you sign.
Key Takeaways
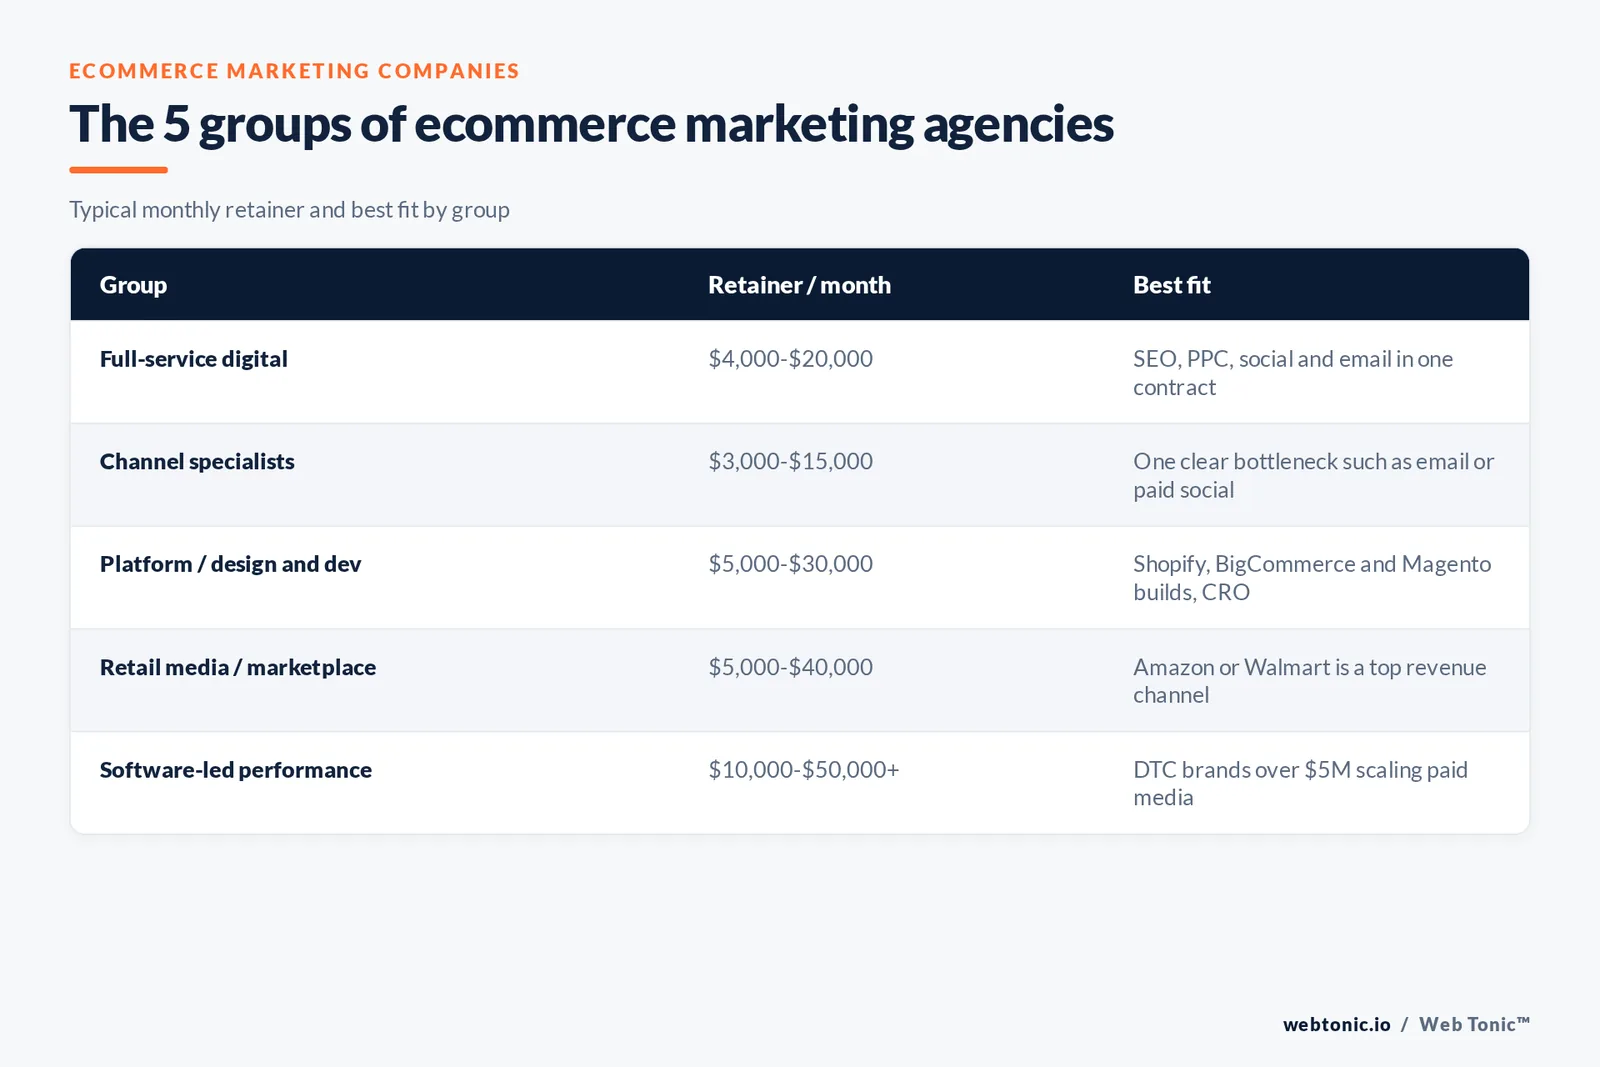
- Ecommerce marketing companies fall into 5 groups: full-service digital agencies, channel specialists, platform and web design shops, retail media and marketplace agencies, and software-led performance partners.
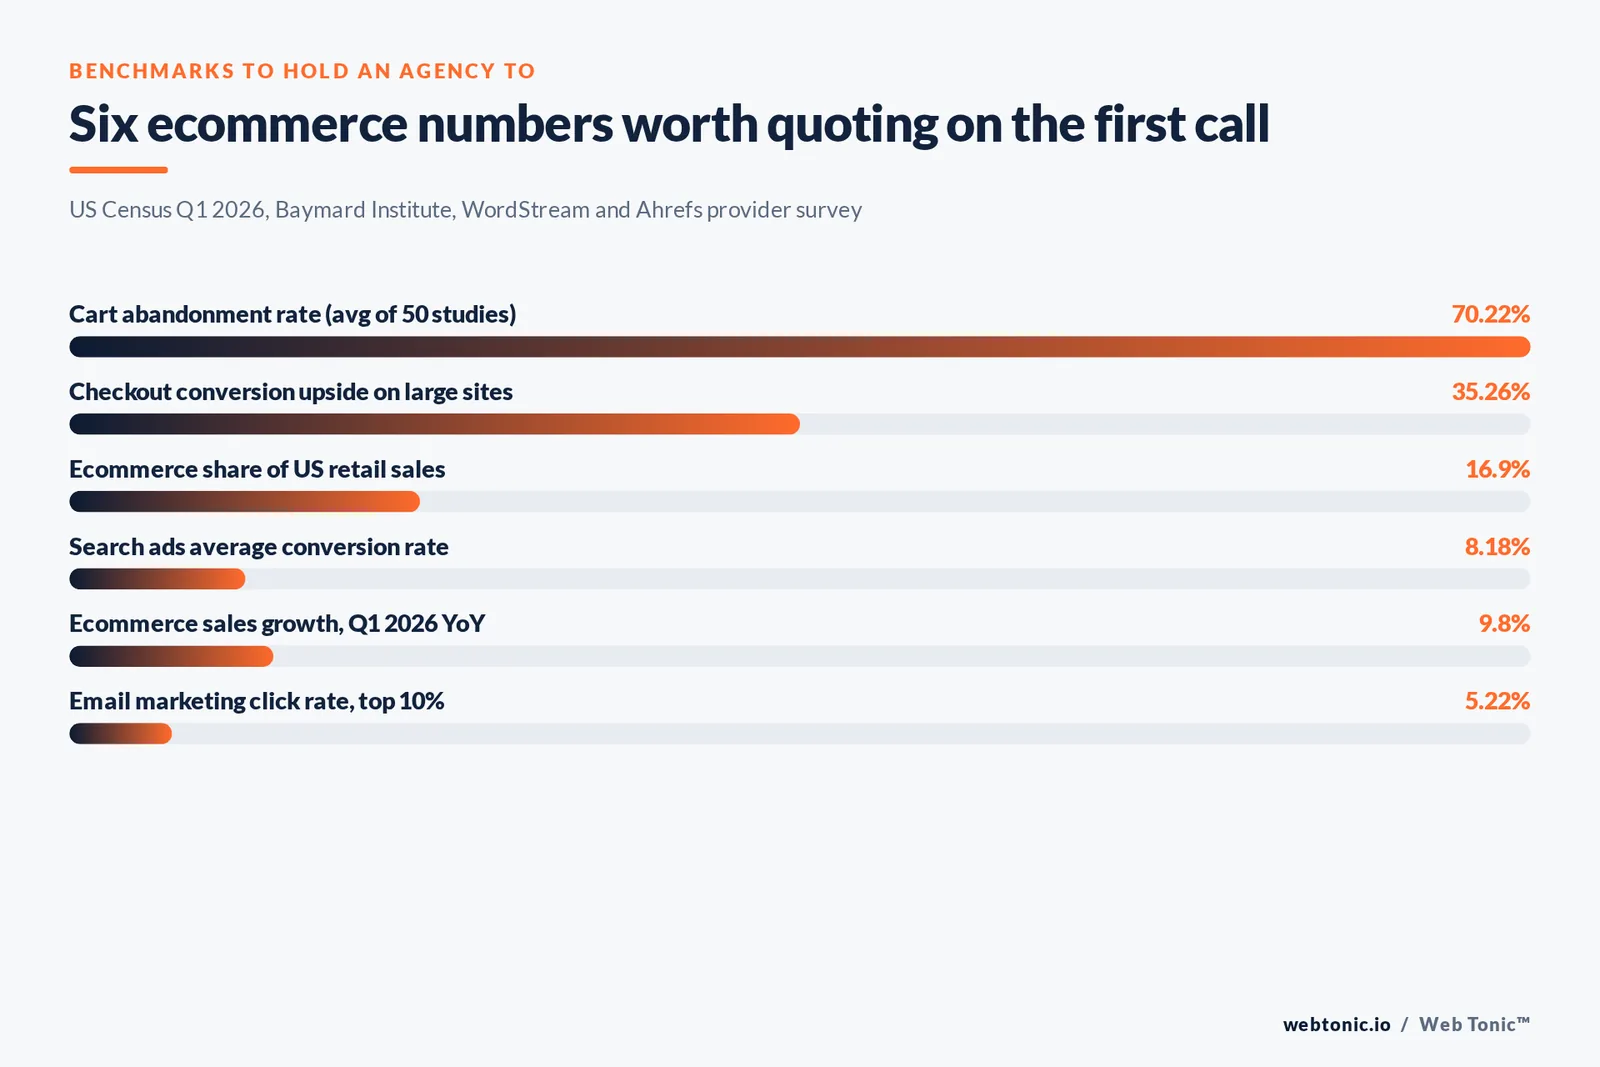
- US retail ecommerce sales reached $326.7 billion in Q1 2026, up 9.8% year over year and 16.9% of all retail sales, so agency competence now decides a large share of total revenue.
- The average documented cart abandonment rate is 70.22%, and better checkout design alone can lift conversion rate by 35.26% on large sites, which is why conversion work often beats more traffic.
- Agency retainers average $3,209 a month against $1,348 for freelancers, and 78.2% of providers bill a monthly retainer rather than per project.
- Ask for platform-level proof: Shopify, BigCommerce, Magento and headless builds each demand different technical skills, and 4 in every 5 case studies omit the baseline you need to judge the result.
The 5 groups of ecommerce marketing companies
Ranked lists of the top ecommerce marketing agencies are usually paid placements. The useful question is which group of ecommerce agencies fits your revenue, your platform and how much of the work you want to keep in house. Every group below contains competent firms and expensive mistakes.
| Group | Named examples | Best fit | Typical monthly retainer | Main risk |
|---|---|---|---|---|
| Full-service digital agencies | Thrive Internet Marketing Agency, Coalition Technologies, Web Tonic | Brands that want SEO, PPC, social media and email under one contract | $4,000 to $20,000 | Depth varies by channel behind one pitch |
| Channel specialists | Inflow (ecommerce SEO), Nogood (growth), Fuel Made (email) | Teams with one clear bottleneck such as paid social or email marketing | $3,000 to $15,000 | No one owns the whole funnel |
| Platform and design and development shops | Blend Commerce, Electric Eye, Swanky | Replatforming, Shopify theme work, web design and CRO | $5,000 to $30,000 or project fees | Marketing services bolted on as an afterthought |
| Retail media and marketplace agencies | Tinuiti, Ad Advance, Canopy Management | Brands where Amazon or Walmart is a top revenue channel | $5,000 to $40,000 | Own-site demand gets neglected |
| Software-led performance partners | Common Thread Collective, Power Digital | DTC brands over $5M scaling paid media on their own data | $10,000 to $50,000+ | Proprietary dashboards create lock-in |
What ecommerce marketing services actually include
Most ecommerce marketing agencies sell the same service list. What separates them is which two or three services they are genuinely good at. Score every proposal service by service rather than as one bundle, and confirm who does the work: strategy, content writing, design and development are often three different teams.
| Service | What it delivers | Typical share of an ecommerce marketing budget | How to verify the agency can do it |
|---|---|---|---|
| Ecommerce SEO | Category and product page rankings, technical fixes, product structured data | 15% to 25% | Ask for a crawl of your own site before the pitch |
| Google Ads and Shopping | Search, Shopping and Performance Max campaigns fed by a clean Merchant Center feed | 25% to 40% | Request a live account walkthrough, not screenshots |
| Paid social media | Meta, TikTok and Pinterest prospecting and retargeting creative | 20% to 35% | Count how many creative variants they ship per month |
| Email marketing and SMS | Welcome, browse and cart flows plus campaign calendar | 5% to 15% | Ask for flow revenue as a share of total revenue |
| Content writing and content marketing | Buying guides, comparison content, brand editorial | 5% to 15% | Read three published pieces they wrote, not samples |
| Web design and development | Theme work, speed, checkout and conversion rate optimisation | 10% to 25% or project based | Confirm in-house developers for your platform |
| Influencer marketing and UGC | Creator sourcing, briefs, usage rights, FTC disclosure compliance | 5% to 20% | Check they handle contracts and disclosure themselves |
| Marketplace management | Amazon and Walmart listings, retail media, inventory hygiene | 10% to 30% | Ask for advertising cost of sale by ASIN group |
What ecommerce marketing agencies cost in 2026
Pricing is the clearest signal of what you will actually receive. The largest public survey of provider rates, an Ahrefs poll of 439 providers, puts the average monthly retainer at $2,917, with agencies at $3,209 and freelancers at $1,348 for comparable scopes. Semrush data puts worldwide agency rates near $134 an hour and $148 in the United States.
| Budget tier | Monthly spend on the agency | What that realistically buys | Who it fits |
|---|---|---|---|
| Entry | $1,000 to $2,500 | One channel executed part time, light reporting | Stores under $50K a month in revenue |
| Core | $2,500 to $6,000 | Two channels plus analytics and a monthly content cadence | Growing Shopify and BigCommerce brands |
| Growth | $6,000 to $15,000 | Full funnel across SEO, paid, email and creative production | $500K to $3M annual online revenue |
| Enterprise | $15,000 to $50,000+ | Dedicated pod, in-house creative studio, incrementality testing | Multi-market DTC and Magento or headless builds |
Pricing models matter as much as the number. Retainers dominate because ecommerce marketing compounds, but project fees suit a replatform or a one-off design and development sprint.
| Pricing model | Share of providers using it | Best used for | Watch out for |
|---|---|---|---|
| Monthly retainer | 78.2% | Ongoing SEO, paid media and email marketing | Scope creep in both directions |
| Per project | 48.9% | Web design, migrations, audits | No accountability after launch |
| Hourly | 34.8% | Advisory and overflow work at around $111 an hour | Unpredictable invoices |
| Percentage of ad spend | Common at 10% to 20% | Large paid media accounts | Incentive to raise spend, not profit |
| Performance or revenue share | Rare below $1M revenue | Mature brands with clean attribution | Disputes over what the agency caused |
Platform expertise: Shopify, BigCommerce, Magento and headless
Ask which platforms the agency ships on weekly. An ecommerce agency that lives in Shopify will lose weeks on an Adobe Commerce build, and the reverse is equally true. Platform depth is the single most testable claim in any pitch.
| Platform | Where agency skill matters most | Question to ask | Red flag answer |
|---|---|---|---|
| Shopify and Shopify Plus | Theme performance, app sprawl, checkout extensibility | How many apps would you remove from our stack | We add apps, we never remove them |
| BigCommerce | Faceted navigation, multi-storefront, feed control | Show a BigCommerce store you took past $1M | We can learn it during onboarding |
| Magento and Adobe Commerce | Backend developers, caching, indexer health | Who on your team writes PHP | Our partner agency handles that |
| Headless and custom builds | Rendering for search, Largest Contentful Paint under 2.5s | How do you keep server-side rendering crawlable | Google handles JavaScript fine now |
| Amazon and marketplaces | Listing quality, retail media, buy box economics | What is your advertising cost of sale target | We optimise for revenue only |
Channel mix by store stage
The right channel mix is a function of stage, not fashion. A good ecommerce marketing agency will tell you which channels to switch off. Use this as the sanity check on any proposal that puts equal weight on eight channels for a small store.
| Store stage | Monthly online revenue | Priority channels | Deprioritise for now | Reasonable first-quarter goal |
|---|---|---|---|---|
| Launch | Under $25K | Paid social prospecting, email flows, product page basics | Broad content marketing, influencer marketing at scale | Prove one profitable acquisition channel |
| Traction | $25K to $100K | Google Ads and Shopping, email marketing, CRO | Marketplace expansion | Cut blended acquisition cost by 15% |
| Scale | $100K to $500K | Paid social plus search, ecommerce SEO, creative volume | New platforms and new geographies | Grow contribution profit, not just revenue |
| Established | $500K+ | Retail media, brand campaigns, retention, incrementality tests | Channels with no measurable lift | Defend margin while growing 20%+ |
How to read agency case studies
Every agency site invites you to view case studies, and almost every case study omits the context that makes the number meaningful. Treat each claim as a hypothesis and ask the follow-up in the right column.
| Claim on the case studies page | What is usually missing | The follow-up question | Good answer looks like |
|---|---|---|---|
| Revenue up 300% | Starting revenue and timeframe | What was the monthly baseline in dollars | From $40K to $160K over 11 months |
| ROAS of 8x | Whether it is platform-reported or blended | What was the marketing efficiency ratio | Platform 8x, blended MER 3.1x |
| Traffic up 250% | Whether the traffic converted | What happened to revenue per session | Sessions +250%, revenue per session flat |
| First page for 400 keywords | Search volume and commercial intent | How many of those keywords have buyers | 62 keywords drove 80% of new orders |
| Award-winning campaign | Business outcome | What did the client renew at | Renewed and doubled scope after 6 months |
The 12-point ecommerce agency scorecard
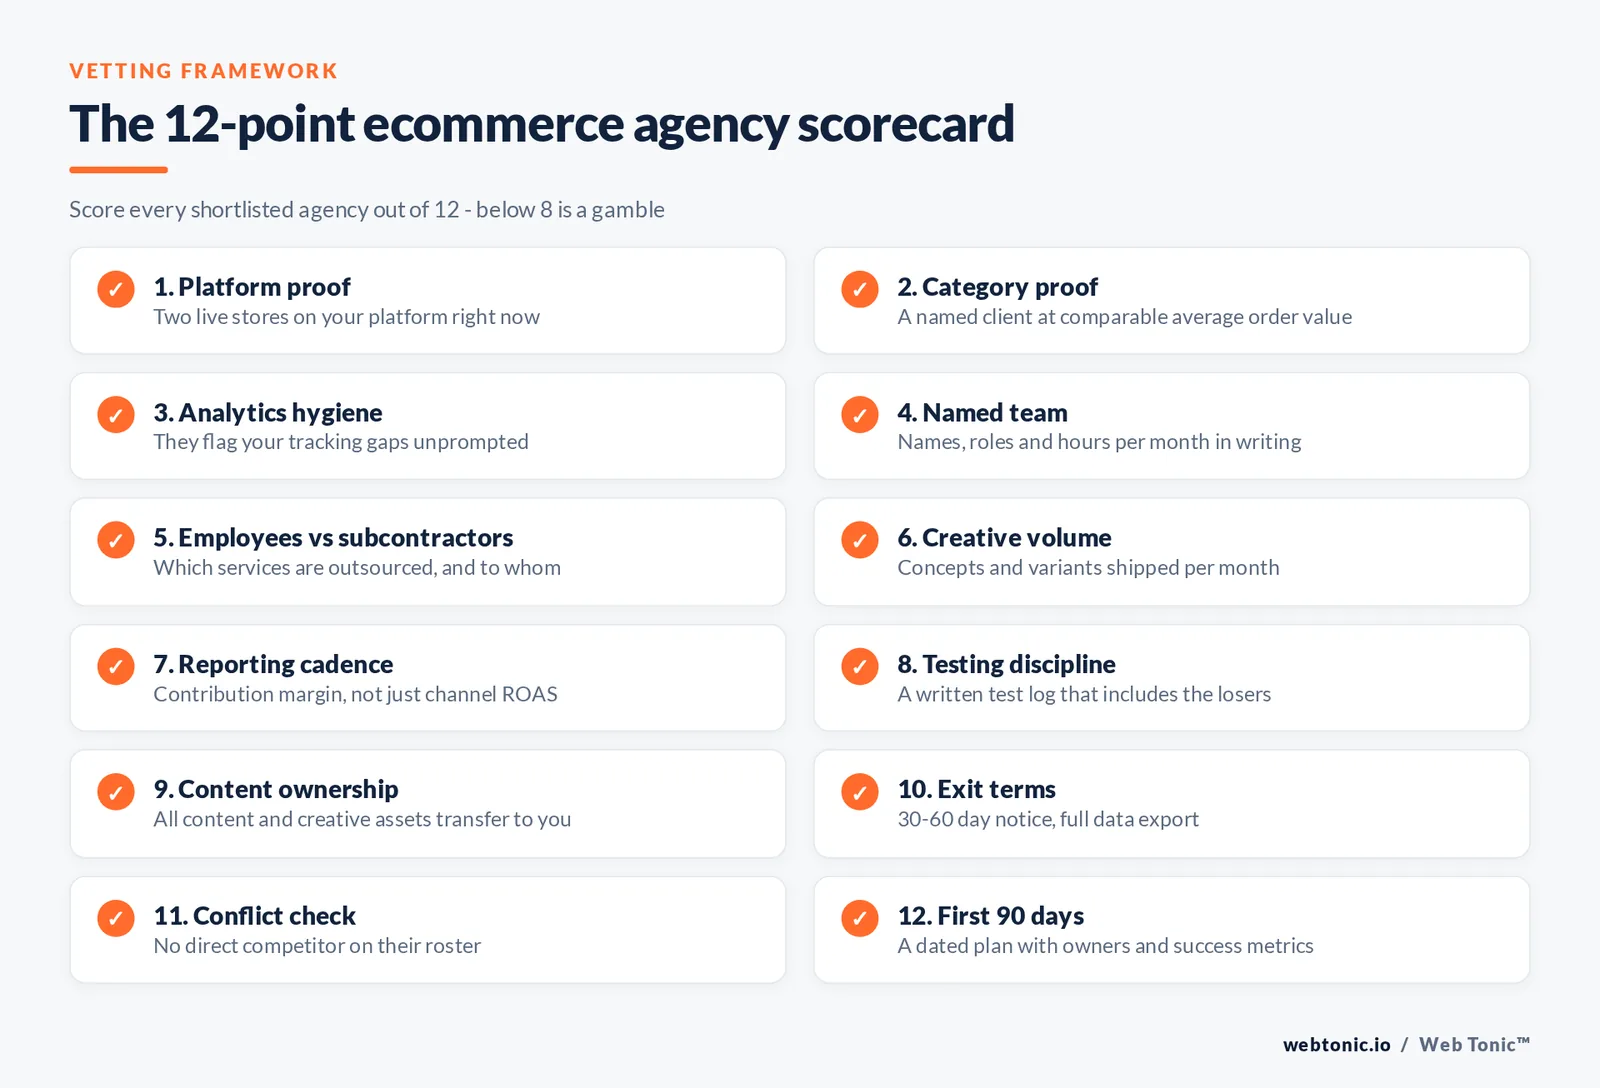
Score every shortlisted agency out of 12. Anything below 8 is a gamble, and any zero in the first four rows should end the conversation regardless of the total.
| Point | What you are testing | Pass condition |
|---|---|---|
| 1. Platform proof | They ship on your platform now | Two live stores on the same platform |
| 2. Category proof | They understand your margins and buying cycle | A named client with comparable average order value |
| 3. Analytics hygiene | They can find your tracking gaps | They flag broken events before you mention them |
| 4. Named team | You know who does the work | Names, roles and hours per month in writing |
| 5. Employees versus subcontractors | Where the work happens | Which services are outsourced and to whom |
| 6. Creative volume | They can feed paid social | A number of concepts and variants per month |
| 7. Reporting cadence | You see profit, not vanity metrics | A dashboard that includes contribution margin |
| 8. Testing discipline | They run a real experiment queue | A written test log with losers included |
| 9. Content ownership | You keep what you pay for | All content writing and creative assets transfer to you |
| 10. Exit terms | You can leave | 30 to 60 day notice, no data hostage |
| 11. Conflict check | They do not run a direct competitor | Written confirmation or a category exclusivity clause |
| 12. First 90 days | They have a plan before the contract | A dated plan with owners and success metrics |
Red flags in ecommerce marketing pitches
These patterns show up in a large share of losing engagements. None of them are proof of bad faith on their own, but two or more together predict a wasted year.
| Red flag | Why it matters | What to do instead |
|---|---|---|
| Guaranteed rankings or guaranteed ROAS | No agency controls the auction or the algorithm | Ask for a forecast with stated assumptions |
| A single flat fee for eight services | Something is being done at token depth | Buy two channels done properly |
| Ads run inside the agency ad account | You lose history and audiences when you leave | Insist on your own ad account and pixel ownership |
| No mention of margin or returns | Revenue growth can destroy profit | Share your unit economics and ask for a profit target |
| Reporting that starts at month three | Setup problems get buried | Require a week-two tracking audit |
| Junior account manager, senior pitch team | The people who sold it will not run it | Meet the delivery lead before you sign |
In-house, freelancer or ecommerce agency
Hiring an agency is one of three options and often the second best. Compare total cost against speed and range of skills before you shortlist any ecommerce marketing companies.
| Option | Realistic monthly cost | Strengths | Weaknesses | Best fit |
|---|---|---|---|---|
| In-house generalist | $5,000 to $9,000 loaded | Full context, always available | One skill set, no creative volume | Brands with a clear repeatable playbook |
| Freelancers | $1,348 average per specialist | Cheap senior expertise per channel | Coordination falls on you | One or two channels, hands-on founder |
| Ecommerce marketing agency | $3,209 average, $6,000+ for full funnel | Range of services and shared learning | Attention split across clients | Multi-channel growth without hiring |
| Hybrid in-house lead plus agency | $8,000 to $15,000 | Strategy stays in house, execution scales | Highest total cost | $3M+ brands professionalising growth |
How ecommerce marketing agencies should measure success
Agree the metric set before the first invoice. Platform-reported numbers and business numbers diverge, and the gap is where most agency relationships break down.
| Metric | Definition | Why it matters | Healthy direction |
|---|---|---|---|
| Conversion rate | Orders divided by sessions | Cheapest growth lever on most stores | Up, tested against a control |
| Average order value | Revenue divided by orders | Sets how much you can pay for a click | Up through bundles and thresholds |
| Customer acquisition cost | Marketing spend divided by new customers | The number that decides scale | Stable while volume grows |
| MER or blended ROAS | Total revenue divided by total ad spend | Immune to platform over-attribution | Above your contribution break-even |
| Contribution margin | Revenue minus product, shipping and ad cost | Tells you if growth is real | Positive and growing in dollars |
| Repeat purchase rate | Share of customers ordering twice | Drives lifetime value and email value | Up over rolling 90-day cohorts |
| Cart abandonment rate | Sessions with a cart but no order | Benchmark average sits at 70.22% | Down after checkout fixes |

A credible first 90 days
Ask any shortlisted agency to map their onboarding against this timeline. Vagueness here reliably predicts a slow, expensive start.
| Window | What should happen | Deliverable | Failure signal |
|---|---|---|---|
| Days 1 to 14 | Tracking audit, analytics and feed check, access transfer | Written audit with severity ratings | Nothing but a kickoff call |
| Days 15 to 30 | Quick wins shipped: product page fixes, cart flows, feed errors | Change log with dates | Strategy deck, no changes live |
| Days 31 to 60 | New creative and campaign structure live, test queue open | Test log with hypotheses | Same ads, new report design |
| Days 61 to 90 | First read on acquisition cost and contribution margin | Quarterly plan with a profit target | Reporting still on platform ROAS only |
Ecommerce marketing benchmarks to hold an agency to
Bring numbers to the first call. These are current public benchmarks, not targets, but any ecommerce marketing agency that cannot say where your store sits against them is guessing.
| Benchmark | Current figure | Source | How to use it |
|---|---|---|---|
| US ecommerce sales, Q1 2026 | $326.7 billion, up 9.8% year over year | US Census Bureau | Separate market growth from agency contribution |
| Ecommerce share of US retail | 16.9% of total retail sales | US Census Bureau | Sanity check omnichannel forecasts |
| Cart abandonment rate | 70.22% average across 50 studies | Baymard Institute | Judge whether checkout work is overdue |
| Checkout conversion upside | 35.26% lift available on large sites | Baymard Institute | Compare against a traffic-only proposal |
| Search ads cost per click | $5.42 average across industries | WordStream | Pressure-test paid search forecasts |
| Search ads conversion rate | 8.18% average | WordStream | Set a floor for landing page quality |
| Meta cheapest traffic vertical | $0.34 cost per click for shopping and gifts | WordStream | Challenge inflated paid social CPC estimates |
| Email marketing click rate | 2.27% average, 5.22% for the top 10% | Brevo | Grade the retention part of the scope |
| Largest Contentful Paint target | 2.5 seconds or faster | web.dev | Hold design and development to a speed budget |
| Pages with no Google traffic | 96.55% of all pages | Ahrefs | Discount content volume promises |
Where the agency sits and why it matters less than you think
Location drives price more than quality. New York and London ecommerce agencies carry higher rates for the same services, while distributed teams compete on output. Time zone overlap, not postcode, is the variable that affects delivery.
| Market | Typical retainer premium | What you actually get | When it is worth paying |
|---|---|---|---|
| New York and San Francisco | 30% to 60% above average | Senior brand and retail media experience | Enterprise DTC and retail partnerships |
| London and Western Europe | 10% to 30% above average | Strong Shopify Plus and multi-market VAT know-how | EU and UK expansion |
| US secondary cities | At or near the average | Balanced full-service digital marketing teams | Most $1M to $10M brands |
| Distributed and offshore teams | 20% to 50% below average | High output on execution-heavy tasks | Content writing, feed and production work |
| Local boutique near you | Varies widely | In-person workshops and fast trust | Founder-led brands that need close contact |
Questions to ask on the first call
Twelve minutes of specific questions will separate the top ecommerce marketing agencies from a polished sales team. Write the answers down; you will compare them later.
| Question | What a strong answer contains | What a weak answer sounds like |
|---|---|---|
| Which of our channels would you switch off first? | A named channel and the evidence they would check | Everything has a role in the funnel |
| Who are your 3 most similar clients by average order value? | Real names or anonymised revenue bands | Confidentiality prevents us from saying |
| How many employees would touch our account each week? | Roles, names and hours | A dedicated team of specialists |
| What did you get wrong on your last ecommerce account? | A specific mistake and the fix | Nothing comes to mind |
| How do you handle returns and margin in reporting? | Contribution margin in the dashboard | We report on revenue and ROAS |
| What happens in week 1? | A tracking audit and access checklist | Discovery and strategy alignment |
| What is your notice period? | 30 to 60 days, data exportable | A 12-month minimum term |
FAQ
What do ecommerce marketing agencies typically offer?
Most offer ecommerce SEO, Google Ads and Shopping, paid social media, email marketing and SMS, content writing, influencer marketing, web design and development, conversion rate optimisation, and marketplace management for Amazon and Walmart. Assume genuine depth in two or three of those and verify the rest with live account walkthroughs.
How much should I budget for an ecommerce marketing agency?
Provider survey data puts the average agency retainer at $3,209 a month and the average hourly rate at $111. Full-funnel work across SEO, paid media and email realistically starts around $6,000 a month, while a single channel executed well can start near $2,500.
How do I choose the best ecommerce marketing company for my brand?
Shortlist three agencies with live proof on your platform and in your price range, score them against the 12-point scorecard above, and buy a paid audit or a 30-day pilot before signing a 12-month retainer. Platform proof, named delivery team and analytics hygiene predict outcomes better than any award.
Should I hire a specialist or a full-service digital agency?
Hire a specialist when you have one clear bottleneck, such as paid social creative or email flows. Hire a full-service digital marketing agency when several channels are underbuilt at once and you have nobody in house to coordinate them.
How do ecommerce marketing agencies measure success?
Good ones report blended marketing efficiency ratio, customer acquisition cost and contribution margin alongside channel ROAS, and they hold a written test log. If reporting stops at platform-reported ROAS, you cannot tell growth from over-attribution.
Sources
US Census Bureau quarterly retail ecommerce report, Q1 2026 · Baymard Institute cart abandonment statistics (50 studies) · Ahrefs SEO pricing survey of 439 providers · Semrush agency rate data · WordStream search advertising benchmarks · Shopify commerce guides · Google Search Central product structured data documentation · Google Merchant Center Help · web.dev Core Web Vitals guidance · FTC endorsement guides.
Web Tonic builds and runs ecommerce growth programmes across SEO, paid media, creative and web development. See our services, our growth marketing and performance creative teams, our data intelligence work, more analysis on the blog, or get in touch for a straight assessment of your current agency setup.