Table of contents
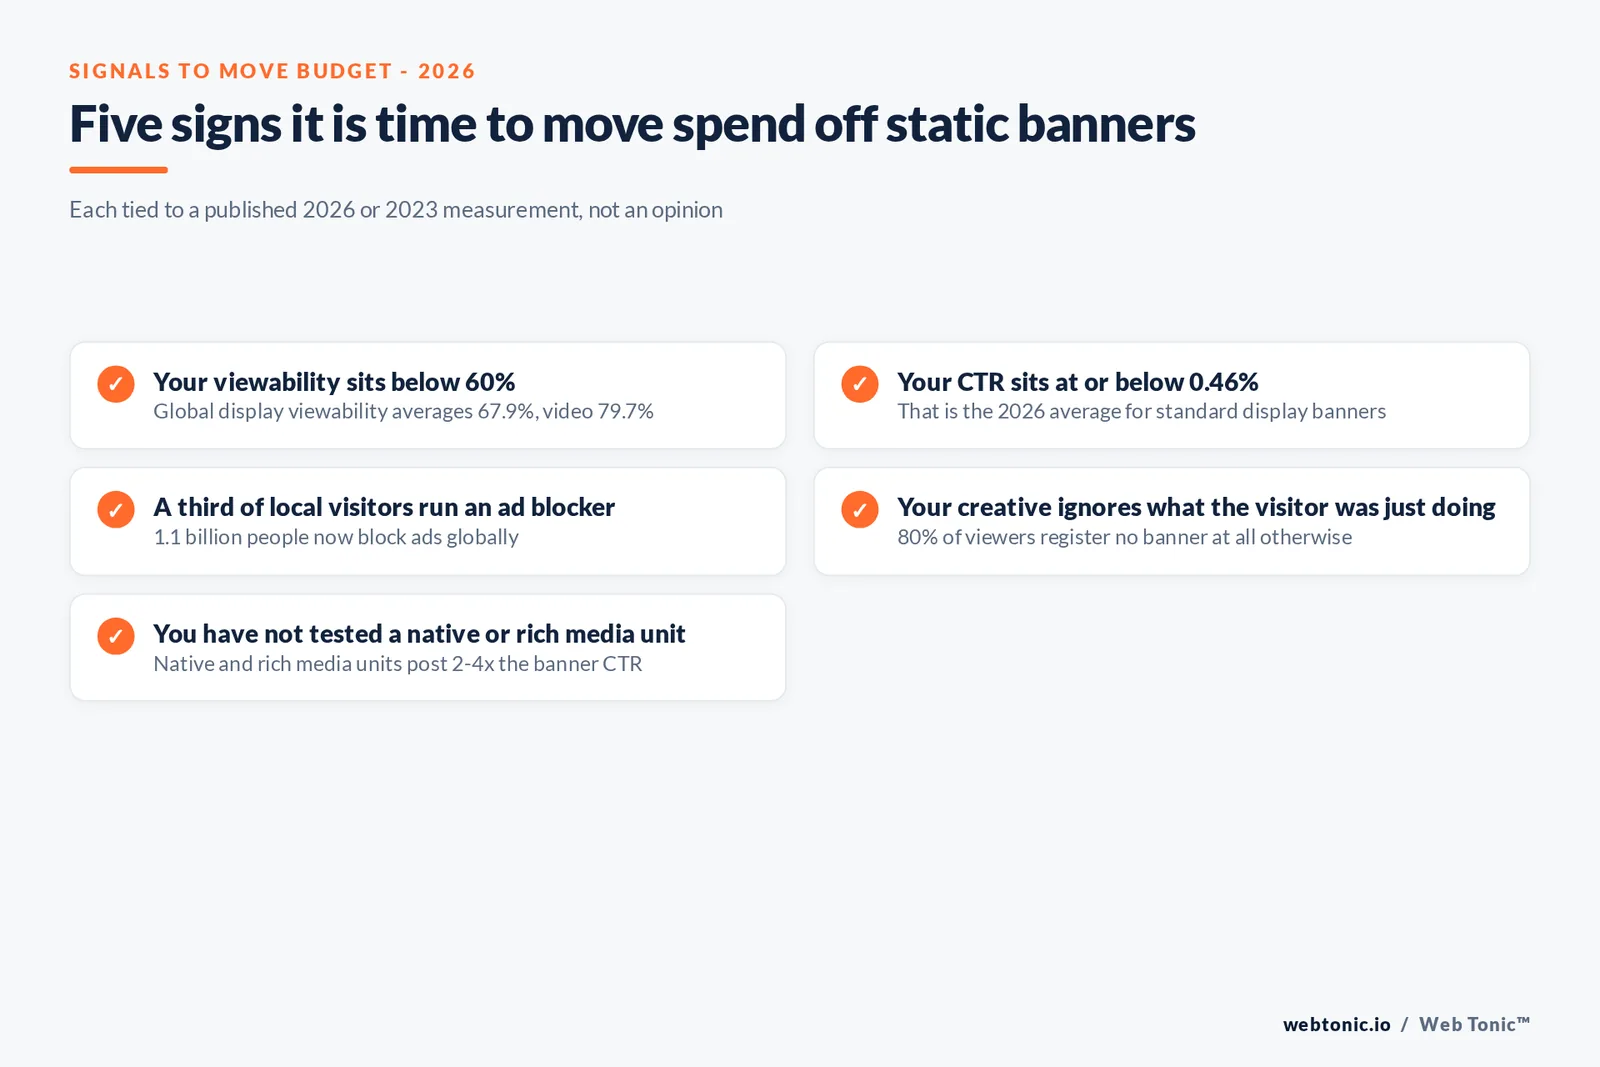
A 2023 eye-tracking and survey study found that 80% of internet users register no recollection of any banner ad after a full browsing session, while only 5% notice more than one. Pair that prevalence data with 2026 performance benchmarks - a 0.46% average display CTR and 1.1 billion global ad-blocker users - and the case for treating banners as a volume play gets much weaker.
Key Takeaways
- 80% of visitors report no recollection of any banner ad at all.
- Only 15% notice exactly one banner during a browsing session.
- Just 5% notice multiple banners in the same session.
- Neither color nor text had a statistically significant effect on attention.
- Relevance to current needs did have a significant effect (p < 0.05).
- Standard display banners average a 0.46% click-through rate in 2026.
- Native ad units average 1.16% CTR, roughly 2.5x the banner rate.
- Rich media units average 1.84% CTR, roughly 4x the banner rate.
- Global display viewability averages 67.9% against 79.7% for video.
- Desktop banner viewability lags at 64% while native clears 81%.
- 1.1 billion people now use an ad blocker globally.
- That is roughly 30% of the total internet population.
- Mobile ad blocking grew 27% since 2023 to about 629 million users.
- US ad-blocking rate sits at 33%, among the highest measured.
- Mobile web display carries 4x the "made-for-advertising" risk of desktop.
- Education & Instruction is the top CTR industry at just 0.40%.
- Programmatic now captures 91% of US display ad spend.
What the research actually measured
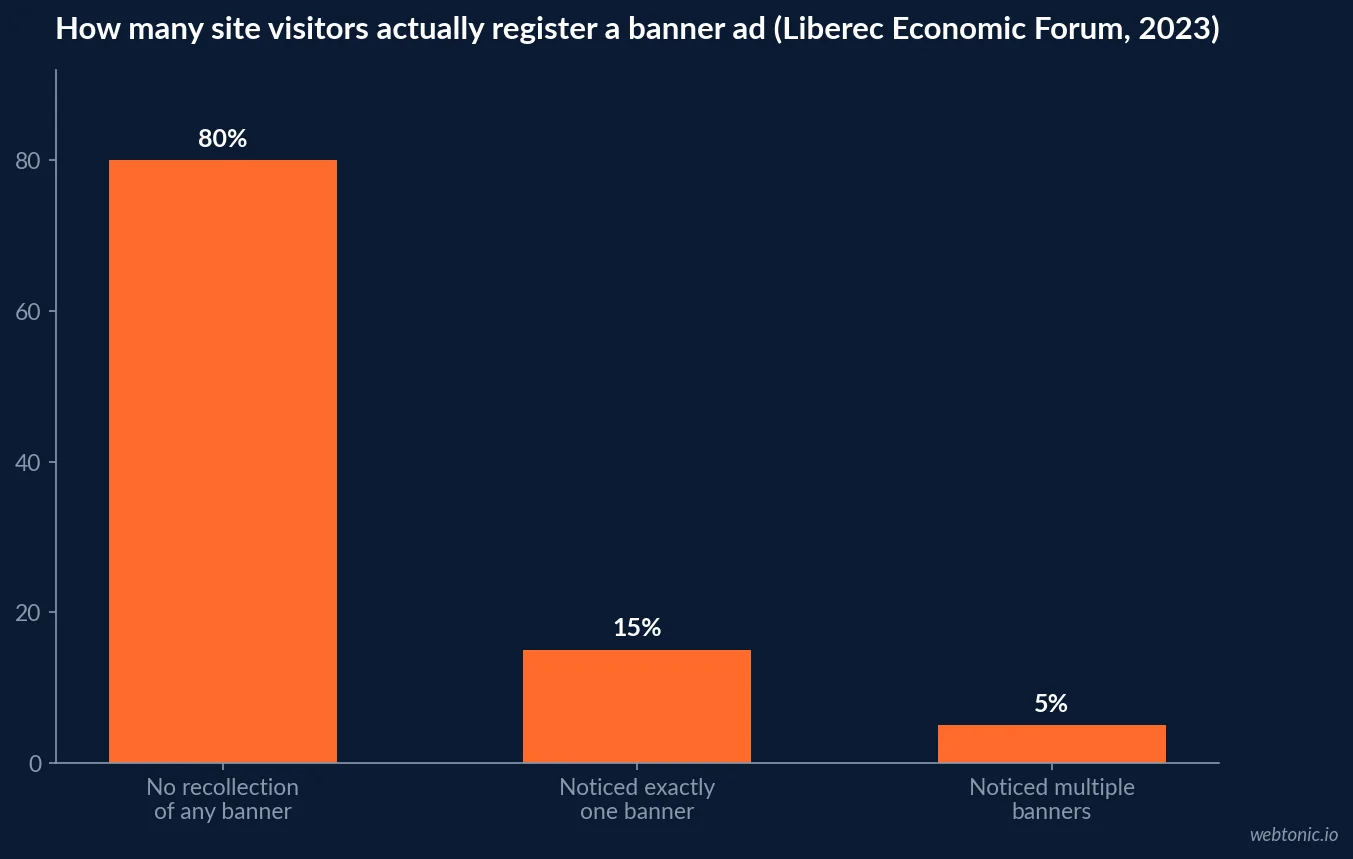
A 2023 study presented at the Liberec Economic Forum, Effective Creativity Against Banner Blindness, tracked 69 internet users over roughly one month of natural browsing behavior, then surveyed them on what they remembered noticing. The result: a striking 80% reported no recollection or awareness of any banner ad during the entire observation period. A modest 15% recalled seeing exactly one ad, and a mere 5% recalled multiple ads - a minority subgroup with meaningfully higher attentiveness than the rest of the sample.
The researchers then tested what actually predicted the exception. Regression analysis found that neither color nor text had a statistically significant effect (p > 0.05) on whether a banner was noticed, while the visitor's current needs or interests had a significant effect (p < 0.05). Roughly 80% of participants said ads aligned with their immediate needs captured attention, and about 50% credited emotionally resonant creative - but contextual relevance was the one factor the data actually supported. A separate 160-participant eye-tracking study on banner placement found left-side and top-side banners collected more fixations than other positions, and that free-surfing visitors noticed and recalled more ads than visitors pursuing a specific task - placement and browsing mode shift the odds, even though most viewers still fixate on page content instead.
| Banner recall outcome | Share of participants | Source |
|---|---|---|
| No recollection of any banner ad | 80% | Liberec Economic Forum, 2023 |
| Noticed exactly one banner ad | 15% | Liberec Economic Forum, 2023 |
| Noticed multiple banner ads | 5% | Liberec Economic Forum, 2023 |
| Attention driven by ad relevance to current needs | ~80% cited this as decisive | Liberec Economic Forum, 2023 |
| Attention driven by color or text design alone | Not statistically significant (p > 0.05) | Liberec Economic Forum, 2023 |
Click-through rate has not recovered
WordStream's 2026 analysis of over 60,000 LocaliQ display campaigns puts the highest-performing industry - Education & Instruction - at just 0.40% CTR, with most verticals clustering between 0.12% and 0.27%. Restaurants & Food sits lowest at 0.12%. These are medians across hundreds of exchanges, networks and publishers, not a niche worst-case sample.
| Industry vertical | Average display CTR, 2026 |
|---|---|
| Education & Instruction | 0.40% |
| Arts & Entertainment | 0.27% |
| Apparel / Fashion & Jewelry | 0.25% |
| Business Services | 0.25% |
| Finance & Insurance | 0.25% |
| Physicians & Surgeons | 0.22% |
| Dentists & Dental Services | 0.18% |
| Restaurants & Food | 0.12% |
Ad blocking keeps growing on mobile
eyeo's 2026 Ad-Blocking Report puts the global ad-blocking population at roughly 1.1 billion users in Q4 2025 - about 30% of the total internet population, up 13% since eyeo's 2023 report. The growth is not uniform: desktop ad blocking has actually declined 4% since 2023 to about 448 million users, while mobile ad blocking has grown 27% to roughly 629 million users, with much of that growth concentrated in lower- and middle-income countries where blocking saves on data costs. Country-level rates in the report range from single digits up to 41% in Indonesia and 33% in the US and Canada.
| Ad-blocking metric, Q4 2025 | Figure | Trend since 2023 |
|---|---|---|
| Global ad-blocking users | 1.1 billion | +13% |
| Share of total internet population | 30% | Roughly stable |
| Desktop ad-blocking users | 448 million | -4% |
| Mobile ad-blocking users | 629 million | +27% |
| US ad-block rate | 33% | Among the highest measured |
| Indonesia ad-block rate | 41% | Highest measured country |
Viewability tells a more honest story than CTR
IAS's 21st Media Quality Report, built on more than 300 billion daily measured interactions, puts global display viewability at 67.9% against 79.7% for video - an 11.8-point gap the report says keeps widening. Mobile web display specifically carries a made-for-advertising rate 4x higher than desktop (2.0% versus 0.5%), and mobile web accounts for 45.1% of impressions but 71.9% of all MFA impressions measured. Separately, Digital Applied's 150-point 2026 benchmark set puts desktop banner viewability at just 64%, against 81% for native inventory and 96% for CTV display.
| Format / environment | Viewability, 2026 | Source |
|---|---|---|
| Global display (all formats) | 67.9% | IAS 21st Media Quality Report |
| Global video | 79.7% | IAS 21st Media Quality Report |
| Desktop standard banner | 64% | Digital Applied 2026 benchmark set |
| Native inventory | 81% | Digital Applied 2026 benchmark set |
| Connected TV display | 96% | Digital Applied 2026 benchmark set |
| Mobile web MFA rate vs desktop | 4x higher (2.0% vs 0.5%) | IAS 21st Media Quality Report |
Format beats industry for engagement in 2026
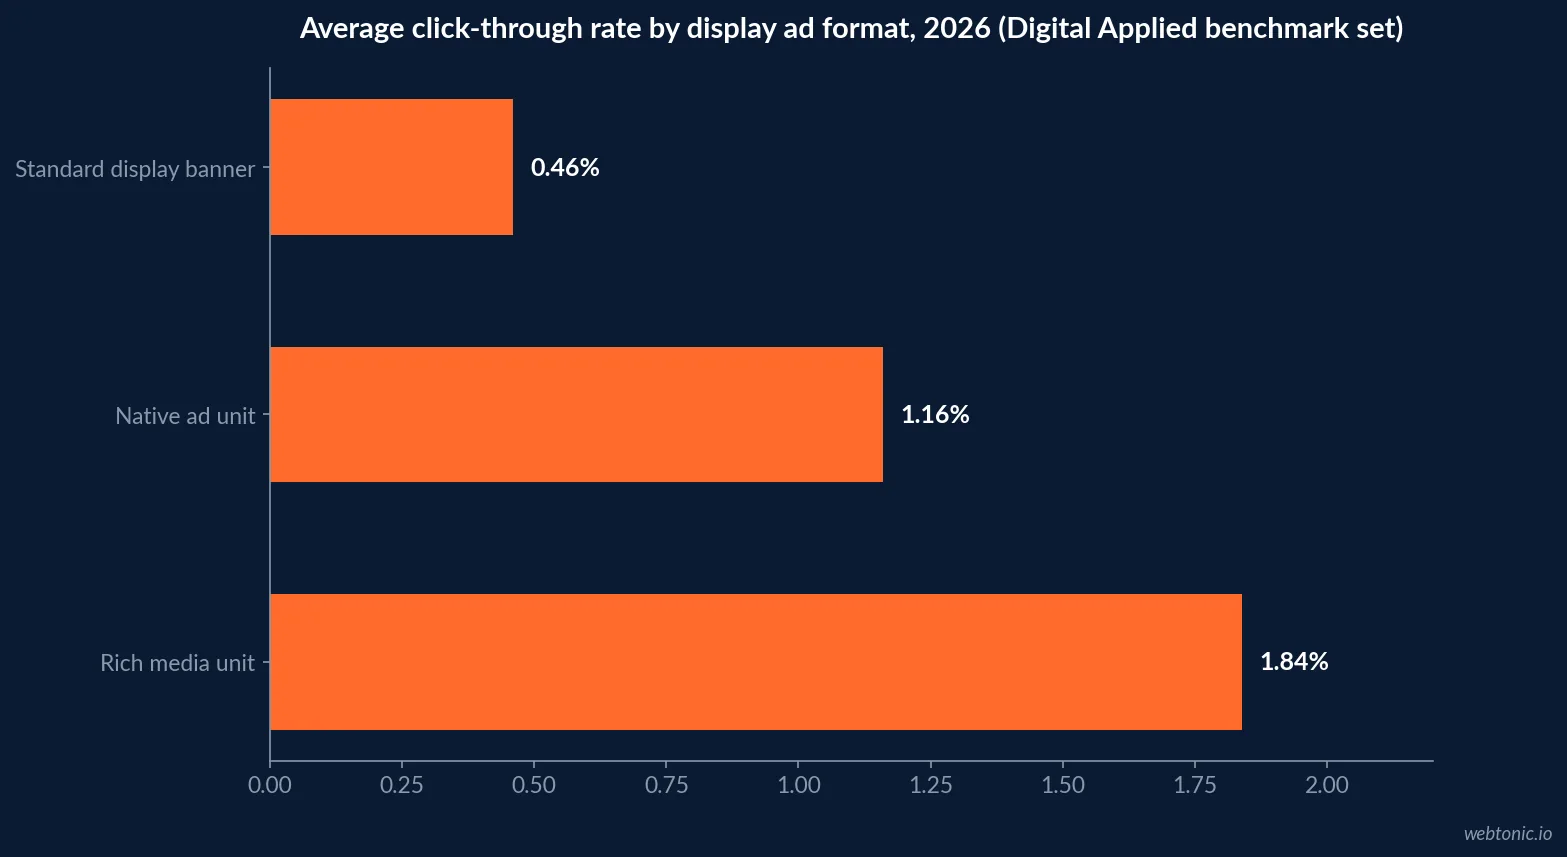
Digital Applied's benchmark set frames the practical implication clearly: rich media and video display formats earn roughly 4x the CTR of static banners. Standard display banners average 0.46% CTR, native units 1.16%, and rich media units 1.84% - a gap larger than the spread between the best- and worst-performing industry verticals in WordStream's dataset. Programmatic buying now captures 91% of US display ad spend, which means format selection inside that programmatic buy, not audience targeting alone, is where most of the available performance gain sits.
Treat the native-versus-display comparison with one caveat, though: ContentMation's 2026 review of the same category notes that native ads are viewed 53% more than display ads (Sharethrough) and post a 0.33% CTR against 0.05% for display in a separate eMarketer comparison - but that most of these lifts are measured against a display baseline already degraded by blindness and blocking, and native's own spend figures are dominated by in-feed social advertising rather than sponsored articles on publisher sites. A format beating a broken baseline is still worth adopting; it is just not proof the format is intrinsically strong.
| Ad format | Average CTR, 2026 | Source |
|---|---|---|
| Standard display banner | 0.46% | Digital Applied 2026 benchmark set |
| Native ad unit | 1.16% | Digital Applied 2026 benchmark set |
| Rich media unit | 1.84% | Digital Applied 2026 benchmark set |
| Native ad unit (alt. measurement) | 0.33% vs 0.05% for display | ContentMation via eMarketer 2025 |
| Video display | +73% higher than static banners | Digital Applied 2026 benchmark set |
The market context behind these numbers
US display ad spend is projected to reach USD 217 billion in 2026, up from roughly USD 193 billion in 2025, with 91% of it running programmatically in the US (76% globally). Connected TV display is the fastest-growing surface, up 28% year over year, while mobile now drives 63% of display impressions against 28% for desktop and 9% for CTV. That spend is not being pulled away from display entirely - it is being redistributed toward formats and environments the same benchmark data shows perform better against the blindness and blocking problem this page opened with.
| Display market metric, 2026 | Figure |
|---|---|
| US display ad spend | USD 217 billion |
| Share running programmatically (US) | 91% |
| Share running programmatically (global) | 76% |
| CTV display impression growth, YoY | +28% |
| Mobile share of display impressions | 63% |
What the evidence says to actually do
Three findings should change how a display budget gets spent in 2026. First, do not expect a creative refresh alone to fix banner blindness - the 2023 research found color and text changes statistically insignificant, while contextual relevance to the visitor's current task was the one factor that mattered. Second, judge static banners on viewability and brand recall rather than CTR, since even the original 2000s-era banner-blindness research found measurable brand-recall impact despite near-zero clicks. Third, shift incremental budget toward native and rich media formats where the 2026 data shows a 2.5x to 4x CTR advantage over standard banners, particularly on mobile web where made-for-advertising risk is highest.
Our performance creative team treats relevance- matching, not visual polish, as the primary lever for any display or paid social creative test, which is consistent with what the banner-blindness literature has found for over two decades. If display is a smaller piece of a broader paid media mix, our Google Ads strategy guide covers how to sequence budget across formats rather than defaulting to banners because they are the easiest unit to buy.
If you want a second opinion on whether your own display spend is chasing a format the data says underperforms, talk to us.
Frequently Asked Questions
What is banner blindness?
Banner blindness is the tendency of internet users to consciously or unconsciously ignore content that looks like an advertisement, even when it sits directly in their field of view. A 2023 Liberec Economic Forum eye-tracking and survey study found that 80% of participants reported no recollection or awareness of any banner ad during a full observation period, with only 15% noticing exactly one ad and 5% noticing multiple ads. The phenomenon was first documented by researchers Benway and Lane in 1998 and has only intensified as ad density on the web has grown.
What causes banner blindness?
The 2023 Liberec study tested color, text and layout as candidate causes and found none of them had a statistically significant effect (p > 0.05) on whether a visitor noticed a banner. What did have a significant effect (p < 0.05) was whether the ad matched the visitor's current needs or interests. In plain terms: making a banner more visually striking does not reliably fix blindness, because the brain has already learned to filter out anything shaped like an ad. Relevance to the visitor's immediate task is the one lever the research found that actually works.
What is a good click-through rate for a display banner in 2026?
Standard display banners average about 0.46% CTR across industries in 2026, according to Digital Applied's aggregated benchmark set, with the highest-performing industry vertical (Education & Instruction) reaching just 0.40% in WordStream's separate 60,000-campaign dataset. Rich media units average 1.84% and native ad units 1.16% - both several times the standard banner rate - which is why format choice is treated as a bigger lever than industry vertical for top-line display engagement in 2026.
How many people use an ad blocker in 2026?
Roughly 1.1 billion people globally, per eyeo's 2026 Ad-Blocking Report - about 30% of the total internet population, and a 13% increase since eyeo's 2023 report. Desktop ad blocking has declined 4% since 2023 to about 448 million users, but mobile ad blocking has grown 27% to roughly 629 million users, driven largely by lower- and middle-income countries where blocking saves on data costs and page-load speed.
Should marketers stop buying banner ads entirely?
Not necessarily, but the evidence argues for narrower use rather than volume buying. Banners still carry brand-recall value even when clicks are rare - the original banner-blindness research from the early 2000s found ads have measurable impact on aided recall and brand recognition even when click-through is near zero. The 2026 data argues for shifting incremental budget toward native and rich media formats, targeting relevance over repetition, and judging static banners on viewability and recall rather than CTR alone.
Sources
Postranecka & Dvoracek - Effective Creativity Against Banner Blindness, Liberec Economic Forum 2023
WordStream - Display & Video Ads Benchmarks 2026
eyeo - 2026 Ad-Blocking Report
Digital Applied - IAS Media Quality Report 2026: MFA and Viewability Data
Digital Applied - Display Advertising Benchmarks 2026: 150+ Data Points
ContentMation - Native Advertising Performance: Key Marketing Statistics 2026
Discovering banner blindness for different banner formats: An eye-tracking study