



Table of contents
No published benchmark prices Google Ads for the label "B2B SaaS," so this page builds the budget from the closest verified 2026 data: cross-industry search-ads benchmarks, then SaaS-specific spend and efficiency ratios layered on top. Every figure below states its source and whether it is SaaS-specific or a cross-industry proxy - treat the difference as load-bearing.
Key Takeaways
- Average cost per lead across all industries is $66.69 in 2026 (WordStream).
- Average cost per click sits at $5.42, more than double the 2016 figure of $2.32.
- Average click-through rate is 6.64% and average conversion rate is 8.18%.
- 87% of tracked industries saw conversion rate improve year over year.
- Business Services conversion rate fell 5.65%, the software/services proxy category.
- Marketing budgets average 9.0% of company revenue in 2026 (The CMO Survey).
- Marketing spend growth is just 1.7% year over year.
- Marketing headcount growth is down 50% year over year.
- Technology and B2B product firms outsource 28% of digital marketing activity.
- 35% of B2B companies run a hybrid in-house/outside marketing structure (Sagefrog).
- Bandwidth (22%) and speed (18%) beat cost efficiency (13%) as reasons to outsource.
- Median CAC payback for B2B SaaS is 16 months (Benchmarkit CY-2025).
- Median blended customer acquisition cost ratio is $1.30.
- Companies growing 31-50% spend a median 44% of revenue on sales and marketing.
- ARR per employee sits at a median $175,000, 75th percentile $253,000.
- Attorneys and Legal Services pay the highest cost per lead of any tracked vertical.
- Arts and Entertainment pays the lowest cost per click, at $1.63.
- Cost per lead fell industry-wide for the first time in five years in 2026.
Why there is no B2B SaaS line in the benchmark reports
WordStream's 2026 Search Advertising Benchmarks report, co-published with LocaliQ and built from over 13,000 US search campaigns running between April 2025 and March 2026, tracks 23 verticals - and none of them is called Technology, Software or B2B. The closest proxy is Business Services, which captures some but not all B2B software spend. So the honest move is to start from the cross-industry average and adjust for what SaaS-specific data says about spend and efficiency, rather than pretending a precise industry number exists.
That is also why this page prices the budget as a range built from two data types: the cross-industry search-ads averages (labeled as such throughout) and the SaaS-specific revenue and CAC ratios from Benchmarkit's CY-2025 report.
The cross-industry baseline (label it as such)
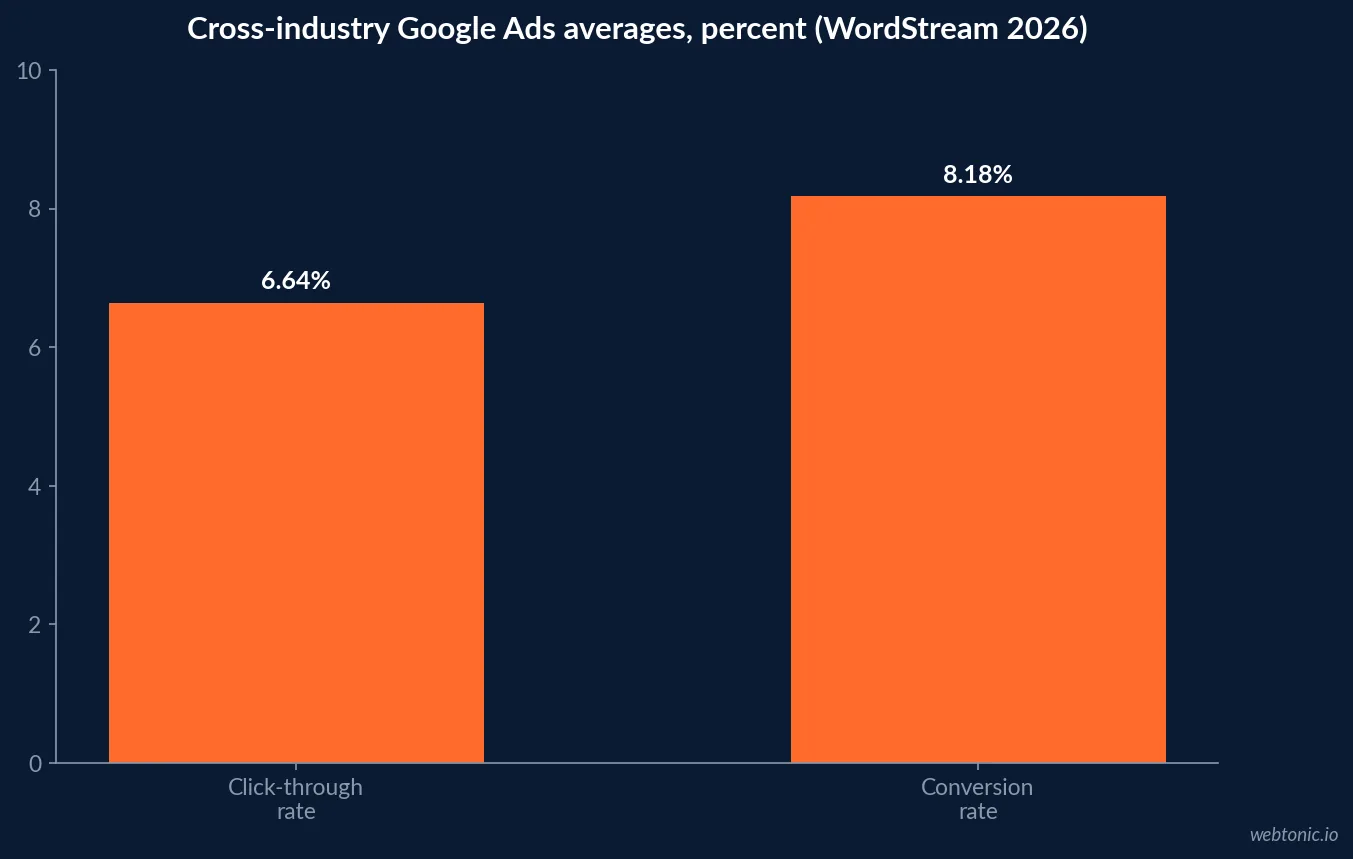
WordStream's 2026 report puts the average click-through rate at 6.64%, average cost per click at $5.42, average conversion rate at 8.18%, and average cost per lead at $66.69 - the first year-over-year decline in cost per lead the report has recorded in five years. These are all-industry medians, not a B2B software number, and they move the most for verticals unrelated to software: Automotive and Health and Fitness saw the steepest cost per lead increases, while Travel and Beauty and Personal Care saw the steepest decreases.
Use this baseline as the floor a B2B tech account should expect to beat, not the number to plan around. Long sales cycles and multi-stakeholder buying groups push real software cost per lead well above the cross-industry median once a lead is qualified past a form fill - the same dynamic that shows up in G2's 2026 Buyer Behavior Report, where evaluation, not initial research, is now the longest stage of a B2B software purchase for 40% of buyers.
| Cross-industry metric (2026) | Value | YoY move | Source |
|---|---|---|---|
| Average click-through rate | 6.64% | Stable | WordStream 2026 |
| Average cost per click | $5.42 | +~stable vs 2025 | WordStream 2026 |
| Average conversion rate | 8.18% | Up in 87% of industries | WordStream 2026 |
| Average cost per lead | $66.69 | First decline in 5 years | WordStream 2026 |
| Business Services conversion rate | Down 5.65% YoY | Software/services proxy | WordStream 2026 |
Where the budget sits inside total marketing spend
The CMO Survey 2026 reports marketing budgets at 9.0% of company revenue and 9.6% of total firm budgets, with spend growth of only 1.7% and marketing headcount down 50% year over year. That flat-to-shrinking envelope is the real constraint on any Google Ads increase: the money for a bigger search budget usually has to be moved from somewhere else in the plan, not added on top.
The same survey finds that technology and B2B product companies deliver 28% of digital marketing activity through outside partners, close to B2B services at 25% and well below B2C product companies at 48%. In practice, that 28% is the share of the Google Ads function most B2B tech teams route to an agency, freelancer or fractional buyer rather than an in-house hire.
| Budget fact (2026) | Figure | Source | What it constrains |
|---|---|---|---|
| Marketing budget, % of revenue | 9.0% | The CMO Survey | Sets the total pool the PPC line competes in |
| Marketing spend growth YoY | 1.7% | The CMO Survey | New budget is scarce; reallocation, not addition |
| Marketing headcount growth YoY | Down 50% | The CMO Survey | Fewer in-house hands to run the account |
| Tech/B2B product outsourced share | 28% | The CMO Survey | Typical share routed to outside PPC help |
| B2B services outsourced share | 25% | The CMO Survey | Comparable non-tech B2B benchmark |
Build, hybrid or buy the Google Ads function
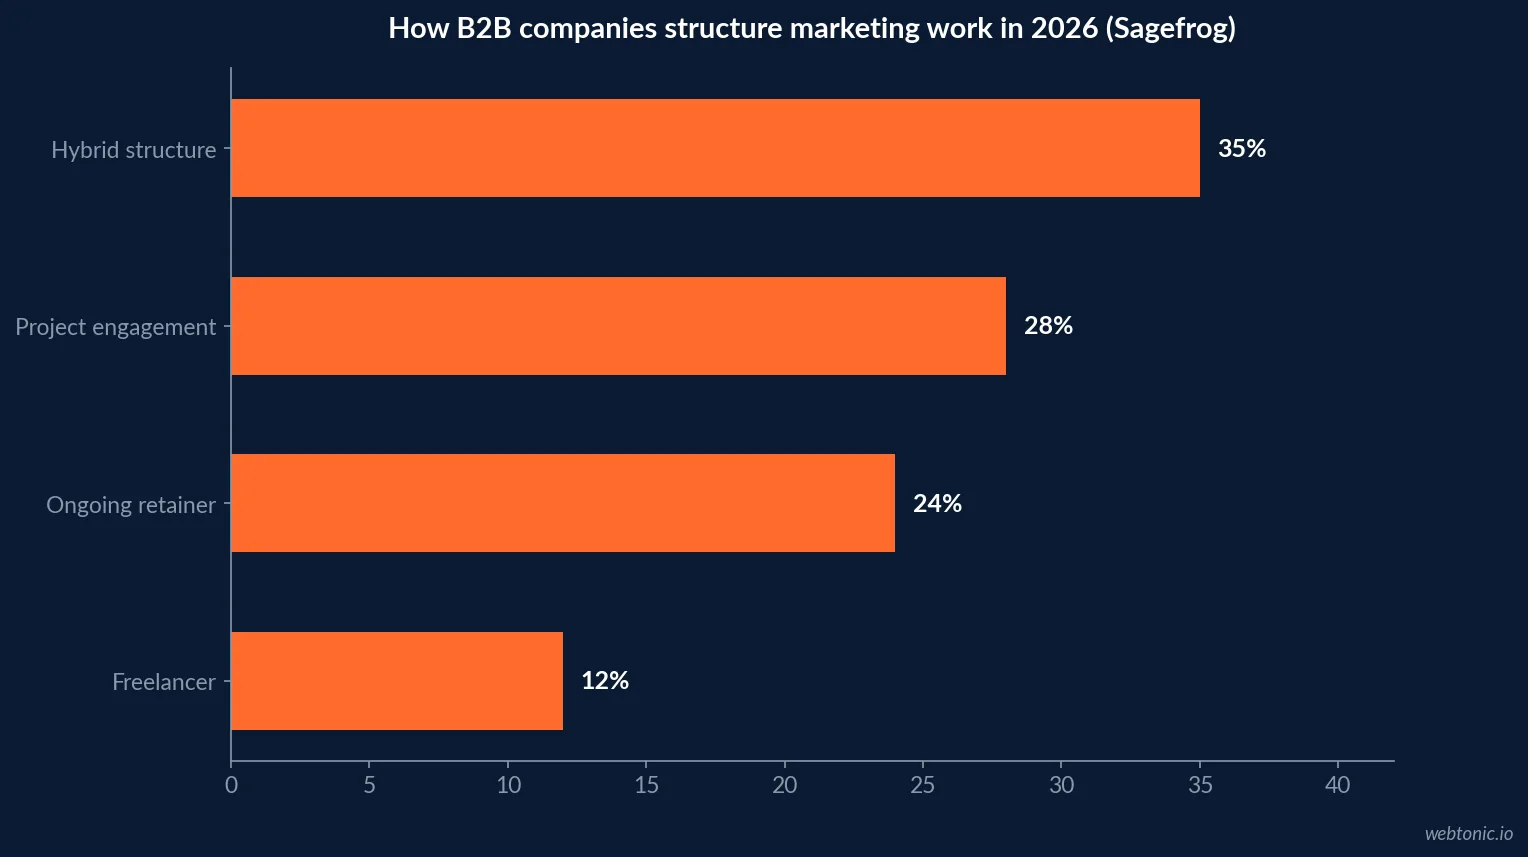
Sagefrog's 2026 B2B Marketing Mix report found hybrid structures at 35% of B2B companies, pure project engagements at 28%, ongoing retainers at 24%, and freelancers at 12%. The top reasons cited for reaching outside were bandwidth (22%) and speed (18%), ahead of raw cost efficiency (13%), rebrand support (11%), and fresh ideas (11%).
That ranking matters for a Google Ads budget specifically: PPC account changes typically take about 30 days to show in performance data, which makes bandwidth and speed-to-launch the practical bottleneck, not the headline day rate of whoever runs the account.
| Marketing structure (2026) | Share of B2B companies | Best fit for a PPC budget | Source |
|---|---|---|---|
| Hybrid (in-house + outside) | 35% | Most B2B SaaS accounts above $10k/mo spend | Sagefrog 2026 |
| Project engagement | 28% | A one-time account rebuild or migration | Sagefrog 2026 |
| Ongoing retainer | 24% | Steady monthly optimization at scale | Sagefrog 2026 |
| Freelancer | 12% | Early-stage accounts under $5k/mo spend | Sagefrog 2026 |
Pricing the budget against payback, not against CPC
Benchmarkit's CY-2025 report, built from B2B SaaS operator data, puts median customer acquisition cost payback at 16 months (18 months in CY-24, 14 months in CY-23), the median blended CAC ratio at $1.30, and median ARR per employee at $175,000 (75th percentile $253,000). Companies in the 31-50% growth cohort spend a median 44% of revenue on sales and marketing combined.
Run the math backward from payback, not forward from cost per click: take your target CAC payback window, divide by your average contract value and lead-to-customer conversion rate, and that number - not the $66.69 cross-industry cost per lead - is the ceiling your Google Ads cost per lead has to clear. Our growth marketing practice and Google Ads team build that model before setting a monthly search budget.
| SaaS efficiency benchmark (CY-2025) | Median | 75th / strong percentile | Source |
|---|---|---|---|
| CAC payback period | 16 months | 10 months (top quartile) | Benchmarkit |
| Blended CAC ratio (USD per USD ARR) | $1.30 | n/a | Benchmarkit |
| ARR per employee | $175,000 | $253,000 | Benchmarkit |
| Sales & marketing spend, 31-50% growth cohort | 44% of revenue | n/a | Benchmarkit |
| Net revenue retention, seat-based | 95% | 108% usage-based | Benchmarkit |
What moves the number up from the cross-industry average
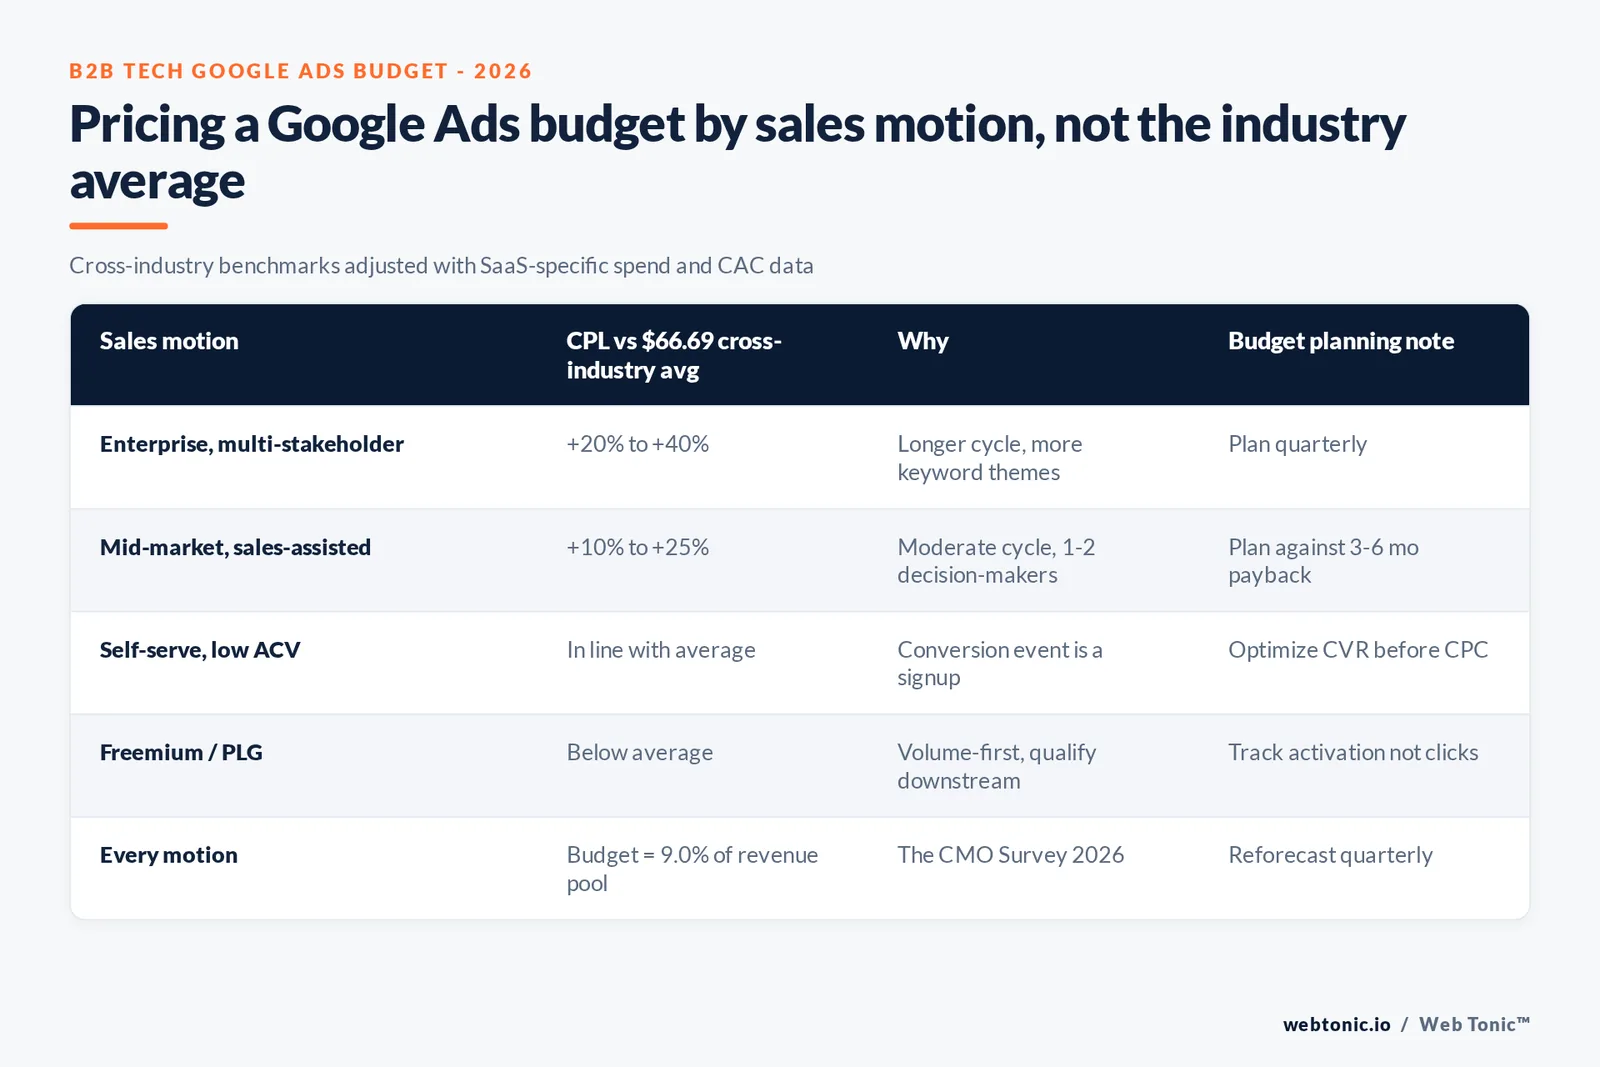
Three factors push a real B2B tech account's cost per lead above the $66.69 all-industry figure: longer sales cycles that require nurture spend beyond the first form fill, multi-stakeholder buying groups that need more than one keyword theme to reach (finance, security and end-user searches are different intents), and a Business Services conversion rate that fell 5.65% year over year even while the broader market improved. Budget a 20-40% premium over the cross-industry cost per lead for a software account with a sales-assisted motion, and closer to the average for a self-serve, low-ACV product.
The reverse also holds: accounts with a fast free-trial or freemium signup flow, where the target conversion event sits earlier in the funnel, should land closer to or below the cross-industry average because the tracked action requires less commitment from the visitor. That funding gap is real: Hinge's 2026 High Growth Study found high-growth professional services and software firms spend a median 12.0% of revenue on marketing against just 5.0% for no-growth firms, which is often the actual reason a "low-performing" B2B account cannot beat the cross-industry average - it is underfunded relative to its sales cycle, not poorly run.
| Sales motion | Cost-per-lead adjustment vs $66.69 average | Why | Budget planning note |
|---|---|---|---|
| Enterprise, multi-stakeholder | +20% to +40% | Longer cycle, more keyword themes to cover | Plan quarterly, not monthly |
| Mid-market, sales-assisted | +10% to +25% | One or two decision-makers, moderate cycle | Plan against a 3-6 month payback |
| Self-serve, low ACV | In line with or below average | Conversion event is a signup, not a demo | Optimize CVR before CPC |
| Freemium / PLG | Below average, watch lead quality | Volume-first funnel, qualify downstream | Track activation, not just clicks |
A simple budget model for 2026
Start from your target number of sales-qualified opportunities per month. Multiply by your expected cost per lead (use the sales-motion table above, not the raw $66.69 average), then divide the total by your marketing budget's 9.0%-of-revenue envelope to see what share of the plan Google Ads would consume. If it exceeds roughly a third of the paid budget, that is the point to check whether a different paid channel would reach the same buyers more efficiently for part of the funnel.
Reforecast quarterly, not annually - the CMO Survey's 1.7% spend growth number means most B2B tech teams are working with a fixed pool, so a Google Ads increase this quarter is a decrease somewhere else this quarter, and that trade needs to be named up front rather than discovered mid-cycle. See our guide to what paid search costs across industries for the non-B2B comparison, or talk to us about modeling your own account.
Frequently Asked Questions
How much should a B2B SaaS company budget for Google Ads in 2026?
There is no published Google Ads benchmark broken out for the label B2B SaaS, so the honest starting point is the cross-industry average: WordStream's 2026 Search Advertising Benchmarks, built from over 13,000 campaigns, puts average cost per lead at $66.69 and average cost per click at $5.42. Layer that onto Benchmarkit's CY-2025 finding that companies in the 31-50% growth cohort spend a median 44% of revenue on sales and marketing combined, and a seed-to-Series-B SaaS team can reasonably plan Google Ads as one line inside that S&M budget rather than pricing it as a standalone number.
Is $66.69 cost per lead realistic for B2B software keywords?
It is a floor, not a ceiling. WordStream's report has no Technology or B2B Software line, but the closest tracked category, Business Services, saw its conversion rate fall 5.65% year over year even as the all-industry average rose for 87% of tracked verticals - a sign that software and services keywords are getting more competitive faster than the market as a whole. Budget above the $66.69 average, not at it.
Where does the Google Ads line sit inside a broader marketing budget?
The CMO Survey 2026 reports marketing budgets averaging 9.0% of company revenue and 9.6% of total firm budgets, with spend growth of only 1.7% and marketing headcount down 50% year over year. In the same report, technology and B2B product companies deliver 28% of their digital marketing activity through outside partners - roughly in line with B2B services at 25% - which is the share of that flat budget typically routed to an agency or freelancer running the paid search account.
Does it make sense to build the Google Ads function in-house or outsource it?
Sagefrog's 2026 B2B Marketing Mix survey found hybrid structures (in-house plus outside help) at 35% of B2B companies, pure project engagements at 28%, ongoing retainers at 24%, and freelancers at 12%. The top reasons B2B teams reach outside for marketing work are bandwidth (22%) and speed (18%), ahead of raw cost efficiency (13%) - which tracks with paid search, where account changes typically need 30 days to show in performance and a gap in coverage is expensive.
What is the one number that should gate a bigger Google Ads budget?
Cost per lead against your own sales-qualified conversion rate, not the industry average CTR or CPC. Benchmarkit's CY-2025 B2B SaaS data puts the median blended customer acquisition cost ratio at $1.30 and median CAC payback at 16 months; if your Google Ads cost per lead times your lead-to-customer rate does not clear that payback window, the budget increase should go into landing page and offer testing before it goes into more spend.
Sources
WordStream - 2026 Search Advertising Benchmarks by Industry
LocaliQ - 2026 Google Ads Benchmarks report
PPC Land - Google Ads CPL drops for first time since 2020
The CMO Survey - Highlights and Insights Report 2026
Benchmarkit - CY-2025 B2B SaaS Performance Metrics Benchmarks
Sagefrog - 2026 B2B Marketing Mix Report
Hinge Marketing - 2026 High Growth Study
G2 - 2026 Buyer Behavior Report


