Table of contents

The B2B SaaS buyer decides on a vendor before that vendor's sales team is ever contacted, and the budget question is whether spend is built for that reality. 6sense's 2025 research puts the average buying cycle at 10.1 months with first contact at roughly 61% of the way through it - and the winning vendor is already the pre-contact favorite 95% of the time. This page prices what a demand generation budget should look like across that journey, not inside a single ad channel.
Key Takeaways
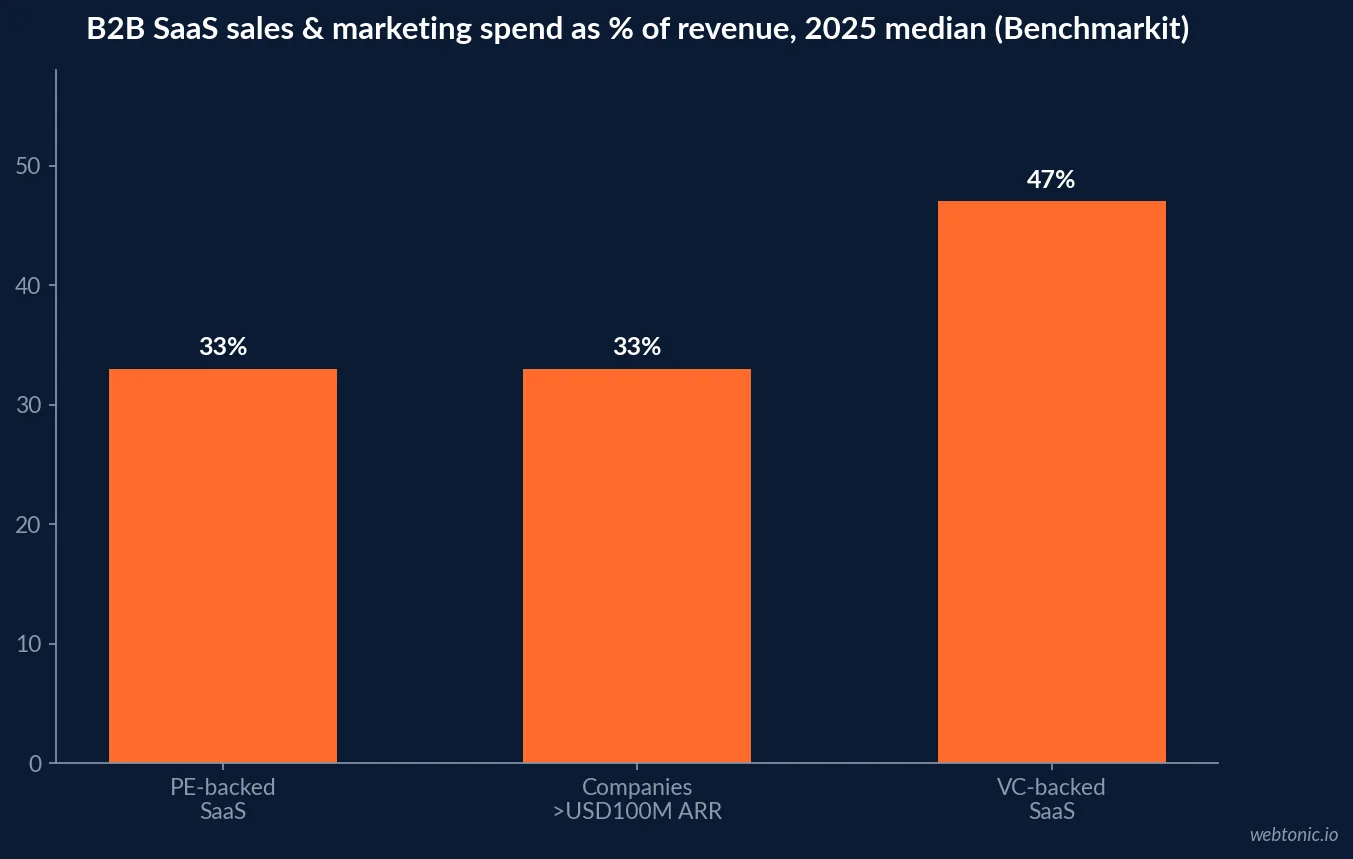
- Sales and marketing spend runs 47% of revenue at VC-backed SaaS companies (2025 median).
- PE-backed SaaS companies run a lower 33% of revenue on the same combined line.
- Companies above USD 100M ARR converge near 33% regardless of ownership structure.
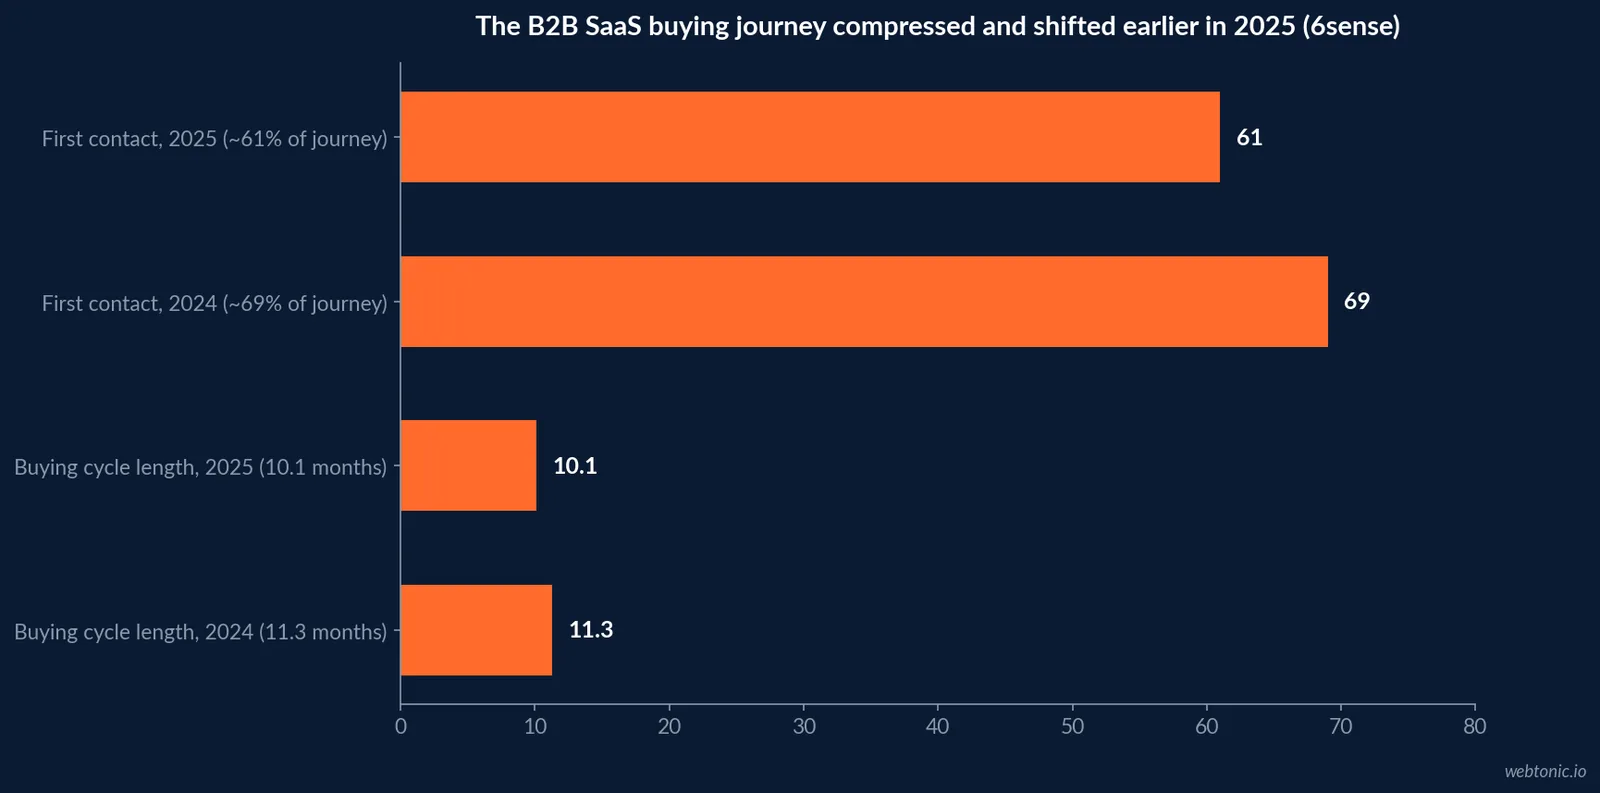
- The average B2B buying cycle is 10.1 months in 2025, down from 11.3 in 2024.
- First seller contact now happens at 61% of the journey, versus 69% a year earlier.
- 95% of the time, the winning vendor was already on the Day-One shortlist.
- Four out of five deals go to the buyer's pre-contact favorite vendor.
- 95% of any B2B category is not in-market on a given day, per the 95-5 rule.
- B2B purchases now involve six to ten decision-makers across departments.
- 26% of buying committees grew larger year over year.
- Buyers consume 15 pieces of content on average before deciding.
- Buyers visit six vendor websites and shortlist about 3.8 vendors.
- Only 24% of buyers' starting vendors match their eventual shortlist.
- Content marketing is the top 2026 budget-increase priority at 30% of surveyed marketers.
- Median ARR per employee is USD 175,000, the productivity line demand gen has to support.
How much of revenue actually funds this
Benchmarkit's 2025 SaaS Performance Metrics report puts combined sales and marketing expense at a median of 47% of revenue for VC-backed companies against 33% for PE-backed companies - a 14-point gap that reflects growth mandate more than category. The same data shows private companies above USD 100 million ARR converging on 33%, identical to public SaaS companies, meaning the outsized spend is concentrated in earlier, faster-growing companies still buying growth rather than defending margin.
Marketing's own slice of that combined line runs to a median near 37% of the sales-and-marketing total in the same benchmark set - the rest is sales headcount, commission, and tooling. A demand gen budget request should be argued against that split, not against the full 33-47% figure, which overstates what marketing alone controls.
| Benchmarkit 2025 metric | Figure | What it means for the demand gen budget |
|---|---|---|
| S&M as % of revenue, VC-backed | 47% (median) | Higher spend funds faster, earlier-stage growth |
| S&M as % of revenue, PE-backed | 33% (median) | Lower spend reflects margin discipline |
| S&M as % of revenue, >USD 100M ARR | 33% (median) | Scale compresses the ratio regardless of owner |
| Marketing share of combined S&M | ~37% (median) | The realistic ceiling for a demand gen ask |
| Median ARR per employee | USD 175,000 | The productivity bar demand gen has to help clear |
| Blended CAC ratio | USD 1.30 | What is spent to add USD 1 of new-plus-expansion ARR |
The buying journey a budget has to match
6sense's 2025 B2B Buyer Experience Report, surveying nearly 4,000 buyers, found the average buying cycle compressed to 10.1 months from 11.3 months in 2024, even as buyers evaluated slightly more vendors than before. The point of first contact with a seller shifted from about 69% of the journey to 61% - roughly six to seven weeks earlier - driven partly by AI feature validation (nearly 90% of buyers report AI capability is now part of what they are buying) and partly by economic pressure, which 62% of buyers said pushed them to engage sellers sooner.
The number that should reset most demand gen budgets is this one: 95% of the time, the vendor that wins was already on the buyer's Day-One shortlist, and four out of five deals go to that pre-contact favorite. A budget weighted entirely toward bottom-of-funnel spend is optimizing for a contest that, most of the time, is already decided.
| 6sense 2025 buyer-journey metric | 2024 | 2025 | Direction |
|---|---|---|---|
| Average buying cycle length | 11.3 months | 10.1 months | Compressing |
| Point of first seller contact | ~69% of journey | ~61% of journey | Earlier |
| Winning vendor was Day-One shortlist favorite | ~80% of deals | 95% of the time | Locked in earlier |
| Deals won by the pre-contact favorite | ~80% | ~80% | Stable |
| Buyers reporting AI features drove earlier contact | n/a | ~90% | New pressure in 2025 |
Why brand spend still earns a line in the budget
LinkedIn's B2B Institute, drawing on research with the Ehrenberg-Bass Institute, frames the allocation question as the 95-5 rule: at any moment, roughly 95% of a category is "out-market" - not buying today, but a future in-market buyer. Their own research found 96% of B2B marketers expected to see the main effect of an ad campaign within two weeks, a mismatch with how long-cycle buying actually works. The practical implication for a demand gen budget is to size lead-generation spend to the 5% actually in-market, and to fund brand-building work that reaches the other 95% before they ever open a research tab.
This is not an argument against lead generation - it is an argument against expecting lead generation alone to cover a category where most of the addressable buyers will not transact for months.
| Budget allocation lens | Share of the category it targets | What it should fund |
|---|---|---|
| Brand / category-level demand creation | ~95% (out-market) | Awareness, thought leadership, presence |
| Demand capture / lead generation | ~5% (in-market) | Search, retargeting, high-intent content offers |
| Content consumed pre-contact | All buyers, avg 15 pieces | Comparison pages, buyer guides, proof |
| Vendor websites visited pre-shortlist | Avg 6 per buyer | SEO, site speed, self-serve comparison tools |
Who has to say yes, and how many of them there are
Demand Gen Report's B2B buyer research describes purchases now routinely involving six to ten decision-makers spread across departments, each weighing different criteria, and found 26% of buying committees grew larger year over year while 20% of buyers reported spending more time researching. Informa TechTarget's 2025 Media Consumption Study, surveying 1,744 technology buyers, adds texture on what that research looks like in practice: an average of 15 pieces of content consumed, six vendor websites visited, and a shortlist that settles at roughly 3.8 vendors. Only 24% of buyers say the vendors they started researching are the same ones that made their final shortlist - meaning demand gen's real job is staying visible through a churn of vendor names, not just capturing a first click.
Where 2026 budgets are actually moving
Sagefrog's 2026 B2B Marketing Mix Report, its 19th edition surveying nearly 500 B2B marketers, found content marketing is the single largest area of planned budget increase for 2026 at 30% of respondents, ahead of AI tools and applications at 28% and customer experience/journey optimization at 26%. Search engine marketing and public relations each sit at 20%, with SEO at 16% and paid social also at 16%.
Read this as where peers are adding money, not as a prescription - a company whose gap is early-stage awareness needs a different mix than one whose gap is bottom-of-funnel conversion. The CMO Survey's 2026 data, cited alongside Sagefrog's in prior Web Tonic research, shows overall marketing budgets flat at about 9.0% of revenue with headcount growth down, meaning most of this reallocation is happening inside an unchanged total, not a growing one.
| Sagefrog 2026 budget-increase priority | Share of B2B marketers increasing spend |
|---|---|
| Content marketing | 30% |
| AI tools and applications | 28% |
| Customer experience / journey optimization | 26% |
| Public relations / media outreach | 20% |
| Search engine marketing (SEM) | 20% |
| Social media management and tools | 18% |
| Search engine optimization (SEO) | 16% |
| Paid social media campaigns | 16% |
Where the budget actually sits today, per The CMO Survey
The CMO Survey's 2026 edition puts overall marketing budgets at 9.0% of revenue and 9.6% of firm budgets, with spend growth of only 1.7% and marketing headcount growth down 50% year on year. The same survey reports that 59.5% of marketing activity is still built in-house against 38.5% delivered by outside partners, and that AI's share of marketing activities has grown from 13.1% to 24.2%, with generative AI specifically more than tripling from 7.0% to 22.4%.
Read against the Benchmarkit figures above, this is the flatter, company-wide number underneath the 33-47% SaaS-specific one - it says total marketing investment is not growing quickly, which makes the 95-5 brand-versus-capture allocation below a reallocation decision inside a fixed budget, not a case for asking for new money.
| The CMO Survey 2026 metric | Figure | What it implies for a demand gen budget |
|---|---|---|
| Marketing budget as % of revenue | 9.0% | The company-wide ceiling demand gen competes inside |
| Marketing spend growth | 1.7% | Little new money; budgets are being reallocated, not grown |
| Marketing headcount growth | Down 50% YoY | Agencies and tooling absorb work headcount used to do |
| Activity built in-house | 59.5% | Most demand gen execution still happens internally |
| Activity delivered by outside partners | 38.5% | The realistic ceiling for outsourced demand gen |
| AI share of marketing activities | 13.1% -> 24.2% | Budget is shifting toward AI-assisted execution |
Measuring pipeline, not just form fills
Google's own Demand Gen campaign documentation frames the format around consideration and conversion goals - sales, leads, website traffic - rather than raw impressions, which matches the buyer-journey data above: a channel optimized for last-click leads will systematically undercount its own influence on a 10.1-month cycle where the winning vendor is usually decided before first contact. The practical fix is measuring demand gen against pipeline created and influenced, not just cost per lead, and weighting attribution models toward first-touch and multi-touch views rather than last-touch alone.
For a category where 95% of the time the winner was already the Day-One favorite, a report that only credits the channel that captured the final form fill is structurally blind to most of what demand gen actually did.
| Measurement approach | What it captures well | What it misses |
|---|---|---|
| Last-touch / cost per lead | Bottom-of-funnel channel efficiency | Brand and early-research influence |
| First-touch attribution | Which channel opened the buying journey | Mid-journey nurture contribution |
| Multi-touch / pipeline-influenced | Full-journey channel contribution | Requires more mature CRM tracking |
| Self-reported attribution surveys | Buyer-stated influence, useful for brand | Recall bias, smaller sample sizes |
How B2B teams structure demand gen delivery
Sagefrog's 2026 B2B Marketing Mix Report also breaks down how B2B teams staff this work: a hybrid model (in-house plus outside help) is the most common structure at 35%, followed by project-based outside work at 28%, a fully retained agency at 24%, and freelancers at 12%. The top reasons teams reach outside are bandwidth at 22% and speed at 18%, ahead of expertise at 15% and cost efficiency at 13% - a signal that most outsourcing decisions are capacity decisions first, not skill-gap decisions.
| Delivery structure (Sagefrog 2026) | Share of B2B teams |
|---|---|
| Hybrid (in-house + outside help) | 35% |
| Project-based outside work | 28% |
| Fully retained agency | 24% |
| Freelancers only | 12% |
Turning this into a budget line, not a benchmark chart
The honest way to use every figure above is as a range-check, not a formula. Start from the 33-47% of revenue Benchmarkit reports for sales and marketing combined, isolate marketing's roughly 37% share of that line, then split the result across the 95-5 brand-versus-capture lens rather than funding only the channels that show up in a last-touch attribution report. A demand gen program built to influence a 10-month, six-to-ten-person buying committee looks different from one built to win a single search click - and the budget has to acknowledge which one it is actually paying for.
For the channel-level detail behind the capture side of this budget, see our Google Ads cost guide and our growth marketing practice page; for the brand side, our performance creative practice covers the assets that carry a category message to the 95% who are not ready to buy yet. If the gap is a measurement one rather than a channel one, talk to our team about instrumenting pipeline-influenced reporting before reallocating spend.
Frequently Asked Questions
What percent of revenue should a B2B SaaS company budget for demand gen?
Benchmarkit's CY-2025 SaaS performance data puts total sales and marketing expense at a median of 47% of revenue for VC-backed companies and 33% for PE-backed companies, with private companies above USD 100 million ARR converging on the same 33% level as public SaaS companies. Marketing alone (not blended with sales) runs closer to a median of 37% of that combined sales-and-marketing line. There is no single correct number - the right budget depends on growth stage, ownership structure, and how much of the number is still sales headcount.
How long is the B2B buying journey before a vendor hears from anyone?
6sense's 2025 B2B Buyer Experience report, based on nearly 4,000 buyers, found the average cycle compressed to 10.1 months in 2025 from 11.3 months in 2024, and that the point of first contact shifted earlier - to about 61% of the journey, versus 69% the year before. Even so, 95% of the time the eventual winning vendor was already on the buyer's Day-One shortlist, and four out of five deals go to that pre-contact favorite. Demand gen's job is winning the shortlist, not winning the sales call.
Does brand advertising or lead generation deserve more budget?
LinkedIn's B2B Institute, working from the Ehrenberg-Bass Institute's research, frames this as the 95-5 rule: roughly 95% of the buying category is not in-market on any given day. Their guidance is to weight spend toward reaching that 95% with brand advertising that earns future consideration, while running a smaller, more targeted lead-generation motion at the 5% who are in-market now. Spending everything against today's in-market buyers ignores the 10-month runway the rest of the category is on.
How many people are actually involved in a B2B SaaS purchase decision?
Demand Gen Report's B2B buyer research describes purchases now routinely involving six to ten decision-makers across departments, each with distinct evaluation criteria, and found 26% of buying committees including more people than they did the year before. Informa TechTarget's 2025 Media Consumption Study, surveying 1,744 technology buyers, adds that those buyers consume an average of 15 pieces of content and visit six vendor websites before a shortlist of roughly 3.8 vendors forms.
Should the budget follow the 2026 content-marketing trend or last year's channel mix?
Sagefrog's 2026 B2B Marketing Mix Report, surveying nearly 500 B2B marketers, found content marketing as the single largest area of planned budget increase at 30%, ahead of AI tools at 28% and customer experience work at 26%. That is directional, not a mandate - it says where peers are adding money, not where a specific company's pipeline gap actually sits. Match the channel to the stage of the 10-month journey the company is weakest in, then use the survey to sanity-check the budget request.
Sources
Benchmarkit - 2025 SaaS Performance Metrics
6sense - The B2B Buyer Experience Report for 2025
LinkedIn B2B Institute - Why you should follow the 95-5 rule
Demand Gen Report - Rethinking Buyer Engagement in Modern B2B Marketing
Informa TechTarget - 2025 Media Consumption & Vendor Engagement Study
Sagefrog - 2026 B2B Marketing Mix Report
The CMO Survey - Highlights and Insights Report 2026
Google Ads Help - Create a Demand Gen campaign