Table of contents
Total US manufacturing and wholesale sales grew just 0.4% in 2025, yet US B2B ecommerce site sales reached USD 2.297 trillion in 2024, up 10.5% year over year. That gap is the story of B2B ecommerce in 2026: flat overall demand with digital channels compounding inside it, absorbing transactions that used to run through sales reps and phone orders.
Key Takeaways
- US B2B ecommerce site sales hit USD 2.297 trillion in 2024, up 10.5%.
- Total US manufacturing and wholesale sales grew only 0.4% in 2025.
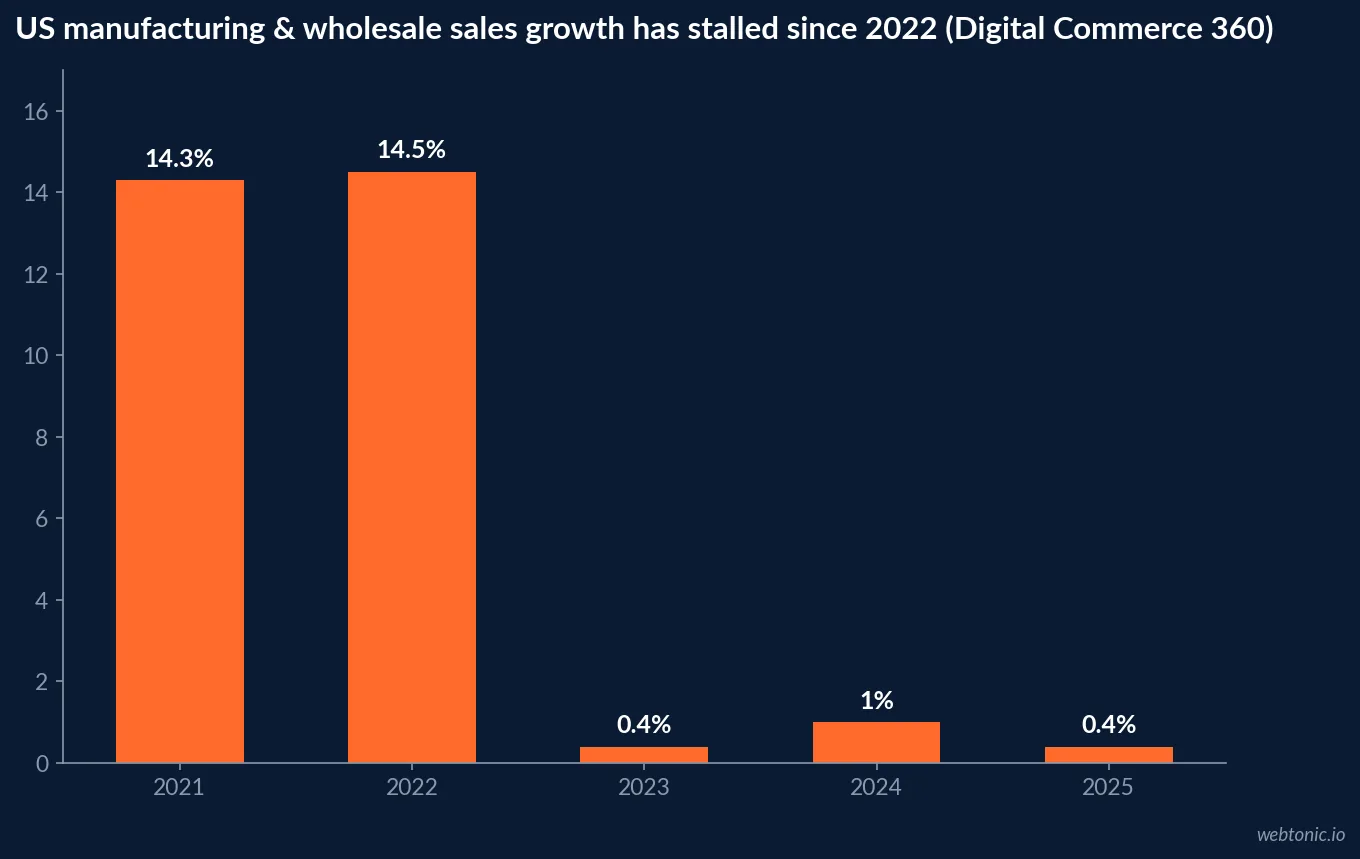
- That follows 1.0% growth in 2024 and 0.4% in 2023 - a multi-year stall.
- 2021-2022 growth was 14.3% and 14.5% by comparison.
- US B2B ecommerce site sales are projected to reach USD 3.027 trillion by 2028.
- 71% of B2B buyers are now Millennials or Gen Z.
- 61% of B2B buyers prefer a rep-free buying experience.
- 83% define purchase requirements before ever talking to a rep.
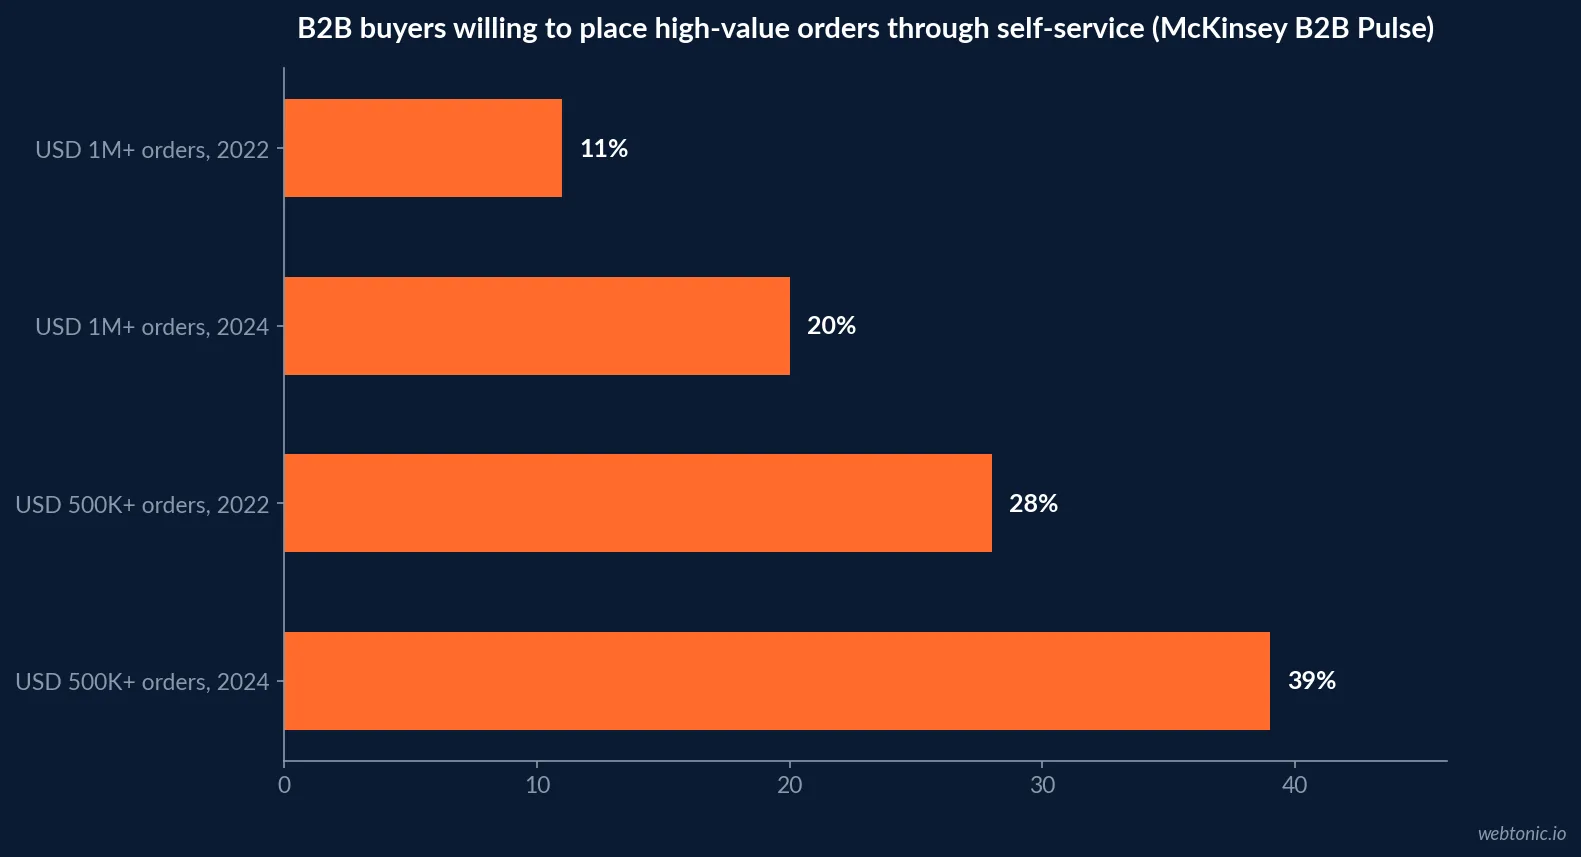
- 39% of B2B buyers will place a self-service order above USD 500,000.
- That is up from just 28% two years earlier.
- 20% would place a USD 1M+ order digitally, up from 11%.
- 85% of B2B organizations offered a self-service portal in 2025.
- 33% of B2B online orders contain errors.
- 83% of companies report incomplete or inaccurate product data.
- B2B ecommerce investment shows 211-391% three-year ROI.
- Order-processing cost drops from USD 50-150 to about USD 25 per order.
- 45% of B2B buyers already used AI during a recent purchase.
How big is B2B ecommerce, really?
Published market-size figures for B2B ecommerce disagree by roughly an order of magnitude, because each measures a different transaction universe. Mordor Intelligence estimates global B2B ecommerce gross merchandise value at USD 36.86 trillion in 2026, growing to USD 61.66 trillion by 2031. A separately reported estimate puts the figure at roughly USD 28.0 trillion for 2026. Neither is the same measurement as Digital Commerce 360's narrower US-only figure: total US manufacturing and wholesale distribution sales of USD 15.12 trillion in 2025, which is total commerce, not ecommerce specifically.
The most directly comparable, narrowly scoped figure - US B2B ecommerce site sales - reached USD 2.297 trillion in 2024, up 10.5% year over year, and is projected to reach USD 3.027 trillion by 2028 per Elogic Commerce's 2026 research. Quote market size only alongside its scope.
| Estimate | Scope | 2025/2026 figure | Source |
|---|---|---|---|
| Global B2B ecommerce GMV | All B2B transactions, global | USD 36.86T (2026) | Mordor Intelligence |
| Global B2B ecommerce (alt. estimate) | All B2B transactions, global | ~USD 28.0T (2026) | Industry estimate |
| Total US manufacturing & wholesale sales | All commerce, not ecommerce-only, US | USD 15.12T (2025) | Digital Commerce 360 / US Dept. of Commerce |
| US B2B ecommerce site sales | Digital-channel sales specifically, US | USD 2.297T (2024) | Elogic Commerce 2026 |
| US B2B ecommerce site sales, projected | Digital-channel sales specifically, US | USD 3.027T (2028) | Elogic Commerce 2026 |
A two-speed economy
Total sales increased just 0.4% in 2025, following 1.0% in 2024 and 0.4% in 2023, according to Digital Commerce 360's analysis of US Department of Commerce data - a sharp contrast with the post-pandemic surge of 14.3% and 14.5% in 2021 and 2022. Quarterly 2025 data shows the slowdown clearly: Q1 rose 2.1%, Q2 declined 0.9%, and Q3 and Q4 were flat at 0.1% and 0.3%.
Beneath that stall, digital commerce, online marketplaces and e-procurement systems continue absorbing transactions from sales reps, phone orders and faxed purchase orders at double-digit rates. That is the structural shift, not the headline growth number: overall demand roughly flat, channel mix moving fast underneath it.
| Year | US manufacturing & wholesale sales | YoY growth |
|---|---|---|
| 2020 | USD 11.36 trillion | -2.6% (COVID-19 disruption) |
| 2021 | USD 12.98 trillion | +14.3% (post-pandemic rebound) |
| 2022 | USD 14.86 trillion | +14.5% (rebound continues) |
| 2023 | n/a | +0.4% |
| 2024 | n/a | +1.0% |
| 2025 | USD 15.12 trillion | +0.4% |
The buyer behind the shift
71% of B2B buyers are now Millennials or Gen Z, per Elogic Commerce's 2026 research, raising the baseline expectation for digital-first procurement and clean self-service experiences. Scube Marketing's compiled 2026 figures add that 61% of B2B buyers now prefer a rep-free buying experience and 83% have already defined their purchase requirements before ever engaging a sales rep - by first contact, buyers have typically completed 61% of their buying journey on their own.
High-value digital orders are also becoming normal rather than exceptional: 39% of B2B buyers are willing to place a self-service or remote order above USD 500,000, up from just 28% two years earlier, and 20% would place a USD 1M+ order digitally, up from 11%.
| Buyer behavior metric, 2026 | Figure | Trend |
|---|---|---|
| B2B buyers who are Millennials or Gen Z | 71% | Structural shift in buyer demographics |
| Buyers preferring a rep-free experience | 61% | Up from historical norms |
| Buyers defining requirements before rep contact | 83% | Buying journey ~61% complete at first contact |
| Buyers willing to spend USD 500K+ online | 39% | Up from 28% in 2022 |
| Buyers willing to spend USD 1M+ online | 20% | Up from 11% in 2022 |
| Orgs offering a storefront/self-service portal | 85% | Up from 68% in 2024 |
Self-service has not replaced the sales rep
The narrative that self-service has simply "won" overstates the evidence. McKinsey's "rule of thirds," tracked across nine years and roughly 30,000 respondents in 13 countries, finds that at any given buying stage, demand for in-person, remote-human and digital self-service remains roughly balanced regardless of geography or deal size. Gartner separately finds buyers are 1.8x more likely to complete a high-quality deal when digital self-service tools are combined with a sales rep, rather than relying on either channel alone.
The practical implication for 2026 roadmaps: build self-service for routine, well-defined purchases, but keep a rep in the loop for complex or high-stakes deals rather than treating self-service as a full replacement for the sales function.
Conversion is not one number
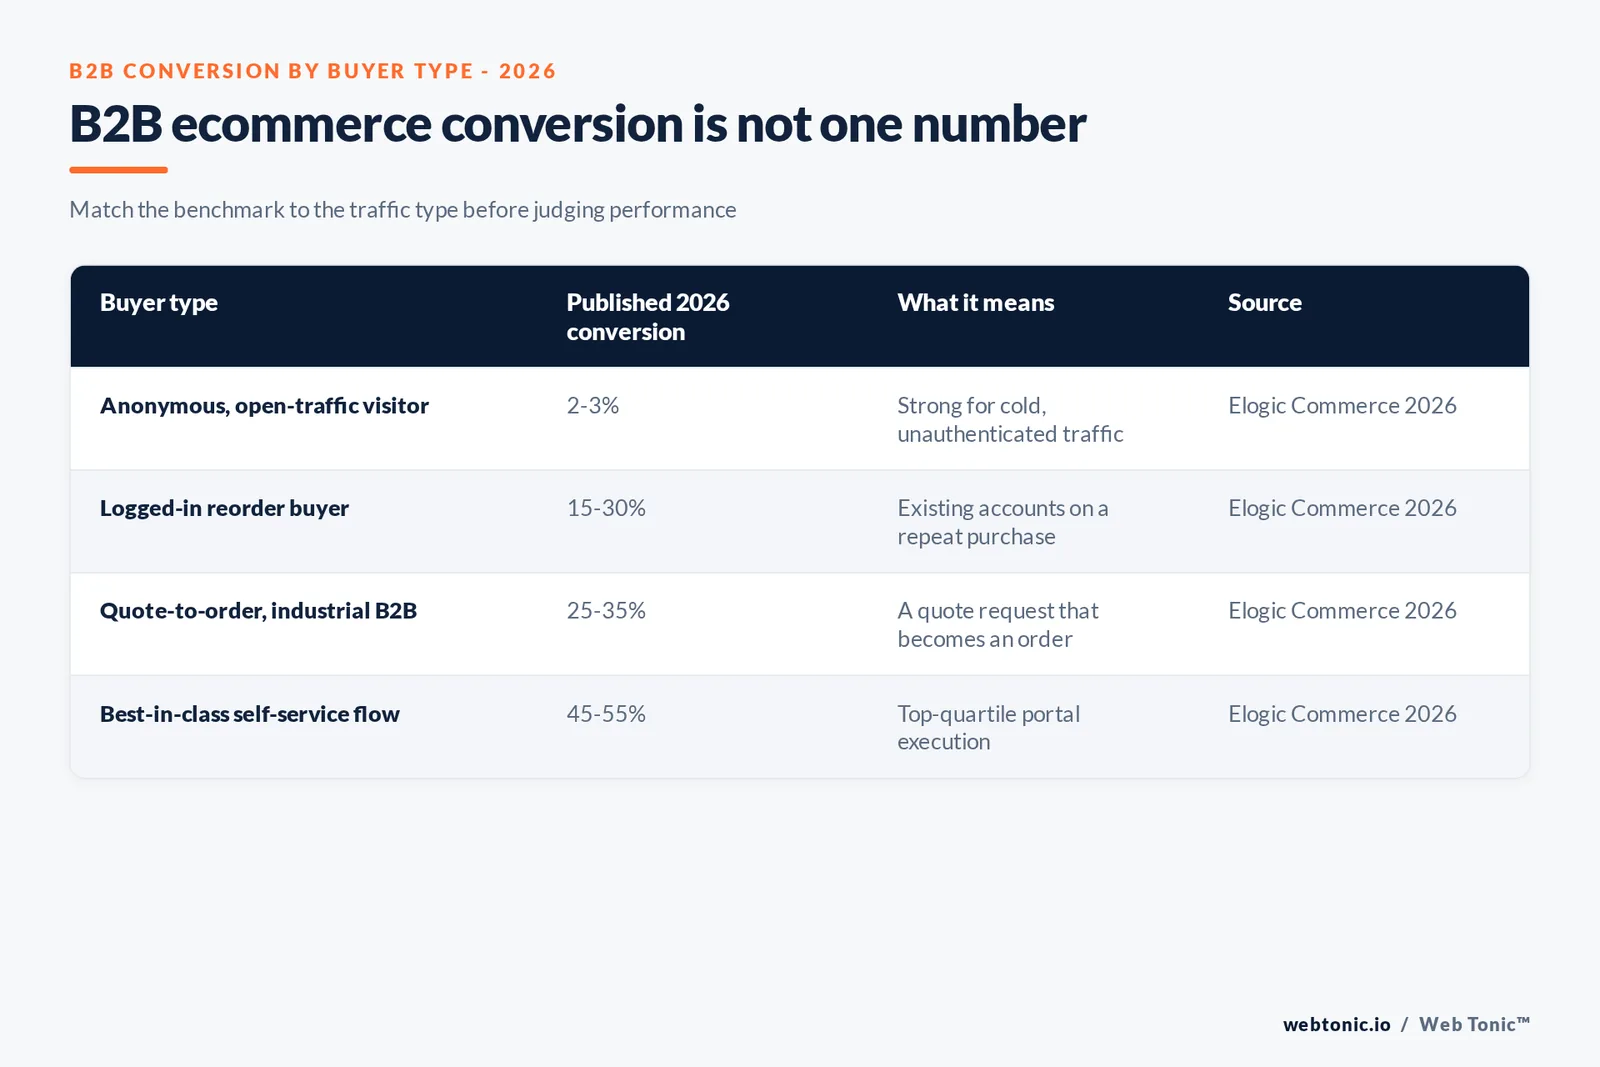
B2B conversion rate benchmarks vary by more than 20x depending on traffic type, which makes a single blended average close to useless for planning. Elogic Commerce's 2026 benchmarks separate 2-3% visitor-to-purchase conversion for anonymous, open traffic (considered strong), 15-30% for logged-in reorder buyers, 25-35% quote-to-order conversion in industrial B2B, and 45-55% as best-in-class execution.
| Traffic / buyer type | Conversion benchmark, 2026 | What it represents |
|---|---|---|
| Anonymous, open-traffic visitor | 2-3% | Strong for cold, unauthenticated traffic |
| Logged-in reorder buyer | 15-30% | Existing accounts placing a repeat order |
| Quote-to-order, industrial B2B | 25-35% | A submitted quote that becomes an order |
| Best-in-class self-service flow | 45-55% | Top-quartile portal execution |
Where the ROI comes from, and where it breaks
B2B ecommerce investment shows 211-391% returns over a three-year period, and order-processing costs drop from roughly USD 50-150 per order under manual handling to about USD 25 per order once self-service is in place. But the same research flags the core blocker: 33% of B2B online orders contain errors, and 83% of companies report incomplete or inaccurate product data feeding their digital channels. Forrester's State of Business Buying, 2024 finds 86% of B2B purchases stall somewhere in the buying process, and 81% of buyers report dissatisfaction with the provider they ultimately chose.
ERP and PIM connectivity, not storefront design, is what typically separates a self-service channel that hits these ROI figures from one that underperforms its own traffic. Our data and analytics practice treats product-data cleanup as the prerequisite step before any B2B storefront redesign, for exactly this reason.
| Cost / quality metric, 2026 | Figure | Implication |
|---|---|---|
| Three-year ROI on B2B ecommerce investment | 211-391% | Real and compounding, per Elogic Commerce |
| Order-processing cost, manual handling | USD 50-150 | Baseline before self-service |
| Order-processing cost, self-service | ~USD 25 | Roughly 2-6x cheaper per order |
| B2B online orders containing errors | 33% | Direct hit to trust and repeat purchase |
| Companies reporting incomplete/inaccurate product data | 83% | Root cause of order errors |
| B2B purchases that stall mid-process | 86% | Friction, not lack of demand |
AI is already inside the B2B purchase
45% of B2B buyers report using AI during a recent purchase, weighing an average of seven information sources before deciding, per Gartner's 2026 data. Gartner also projects that AI agents will manage a growing share of B2B procurement over the next two years, with more than USD 15 trillion in spend potentially flowing through AI-mediated exchanges by 2028 - treat that longer-horizon figure as a forecast, not a 2026 baseline, and revisit it as actual adoption data replaces the projection.
| AI in B2B procurement, 2026 | Figure | Time horizon | Nature of figure |
|---|---|---|---|
| Buyers who used AI in a recent purchase | 45% | 2026, current | Measured, Gartner |
| Average information sources weighed per purchase | 7 | 2026, current | Measured, Gartner |
| B2B transactions AI-influenced or automated | 75% | By 2028 | Forecast, Gartner |
| B2B procurement managed by AI agents | 90% | By 2028 | Forecast, Gartner |
| B2B spend through AI agent exchanges | USD 15 trillion+ | By 2028 | Forecast, Gartner |
What this means for a 2026 B2B ecommerce roadmap
Do not confuse flat total-market growth with a flat opportunity: the channel migration inside that flat top line is where budget should follow. Build self-service for well-defined, repeat purchases first, keep reps engaged for complex deals, and fix product-data quality before redesigning the storefront around it - a 45-55% best-in-class conversion rate is unreachable on top of 33% order-error rates. Our growth marketing practice approaches B2B ecommerce the same way it approaches any other channel: instrument the funnel by traffic type before setting a single blended conversion target, and talk to us if you want a second read on where your own numbers sit against these benchmarks.
Frequently Asked Questions
How big is the B2B ecommerce market in 2026?
It depends heavily on the methodology, and the published estimates disagree by an order of magnitude. Grand View Research puts global B2B ecommerce gross merchandise value at roughly USD 28.0 trillion for 2026, Mordor Intelligence estimates USD 36.86 trillion using a different scope, and Digital Commerce 360's narrower US manufacturing-and-wholesale-sales figure, which is not the same measurement, puts total US B2B sales at USD 15.12 trillion for 2025. None of these figures are wrong; they are counting different transaction universes. The narrower and more directly comparable figure - US B2B ecommerce site sales specifically - reached USD 2.297 trillion in 2024, up 10.5% year over year.
Is B2B ecommerce actually growing or is demand flat?
Both are true at once, which is the defining pattern of 2026. Total US manufacturing and wholesale distribution sales grew just 0.4% in 2025, following 1.0% in 2024 and 0.4% in 2023 - a near-total stall compared with the 14.3% and 14.5% growth of the 2021-2022 pandemic rebound. Beneath that flat top line, digital B2B channels are still expanding at double-digit rates, absorbing transactions that used to flow through sales reps, phone orders and faxed purchase orders. It is a two-speed economy: flat overall demand, rapid channel migration within it.
Do B2B buyers actually prefer self-service over talking to a sales rep?
A majority say they do for routine work, but the picture is more nuanced than 'self-service won.' 61% of B2B buyers now prefer a rep-free buying experience and 83% have already defined their purchase requirements before ever engaging a rep. But McKinsey's nine-year 'rule of thirds' finding, cumulative across roughly 30,000 respondents in 13 countries, shows demand for in-person, remote-human and digital self-service remains roughly balanced at any given buying stage - and Gartner finds buyers are 1.8x more likely to complete a high-quality deal when digital tools are combined with a sales rep rather than either channel alone.
What conversion rate should a B2B ecommerce site expect?
There is no single B2B conversion benchmark, because traffic type changes the number by more than 20x. Anonymous, open-traffic visitor-to-purchase conversion of 2-3% is considered strong. Logged-in reorder buyers convert at 15-30%. Quote-to-order flows in industrial B2B run 25-35%. Best-in-class self-service execution reaches 45-55%. Judging a B2B site against a single blended average, rather than against the funnel stage each visitor is actually in, is the most common benchmarking mistake.
What is the biggest blocker to scaling B2B self-service?
Data quality, not buyer willingness. 33% of B2B online orders contain errors and 83% of companies report incomplete or inaccurate product data feeding their digital channels, according to Elogic Commerce's 2026 research. ERP and PIM connectivity is what turns a B2B site from a static brochure into a functioning revenue channel - self-service demand already exists, but a storefront built on dirty product data will underperform its own traffic regardless of design or marketing spend.
Sources
Elogic Commerce - The State of B2B Ecommerce 2026: Trends & Benchmarks
Scube Marketing - B2B Ecommerce Statistics for 2026
Digital Commerce 360 - U.S. B2B sales top $15 trillion, ecommerce redefines how companies buy
eMarketer - B2B Ecommerce Forecast 2026
Mordor Intelligence - B2B E-commerce Market Size & Share Analysis, 2026-2031
Forrester - The State Of Business Buying, 2024