Table of contents

Average customer lifetime value by industry ranges from $185 in beauty ecommerce to $1.13 million in architecture consulting - a spread that makes a single blended CLV average close to useless. This page keeps B2B and ecommerce on separate tables, sourced from CustomerGauge's 2025 B2B research and Shopify's 2026 ecommerce benchmarks, because the two are built on different buying models entirely.
Key Takeaways
- B2B customer lifetime value ranges from $90,000 to $1.13 million across seven sectors (CustomerGauge).
- Architecture firms average $1,130,000 in CLTV, the highest B2B sector measured.
- Business consultancies average $385,000 in CLTV.
- Healthcare consultancies average $330,000.
- Insurance companies average $321,000.
- B2B software companies average $240,000.
- B2B financial advice firms average $164,000.
- Digital design brands average $90,000, the lowest B2B sector measured.
- The universal CAC-to-CLTV target is 1:3 across every industry (CustomerGauge).
- Ecommerce CLV clusters between $100 and $300 for most segments (Shopify 2026).
- Home and furniture brands average $800 to $2,500 in CLV, the highest ecommerce tier.
- Luxury goods brands average $1,000-plus in CLV on a small but high-value base.
- Grocery and meal kit brands average $400 to $1,000-plus.
- Subscription box services average $450 to $900, 2 to 3 times a one-time model.
- Consumer electronics brands average $250 to $600.
- Apparel and fashion brands average $312.
- Beauty and personal care brands average $185, the lowest ecommerce tier measured.
- eMarketer tracks CLV across 15 verticals from 1,071 US ecommerce brands (AdScale data, Q2 2026).
Why one blended average hides more than it shows
"Average customer lifetime value" is really two different metrics wearing one label. B2B CLTV compounds through multi-year contracts, renewal cycles and account expansion; ecommerce CLV compounds through repeat purchase frequency on a comparatively small order value. Treating them as one number means either the B2B side looks absurdly inflated or the ecommerce side looks trivially small - neither comparison is useful for planning.
So this page keeps the two apart. CustomerGauge's research covers seven B2B sectors updated for 2025. Shopify's 2026 benchmarks cover eight consumer and ecommerce categories. Read each table against its own industry, not against the other table.
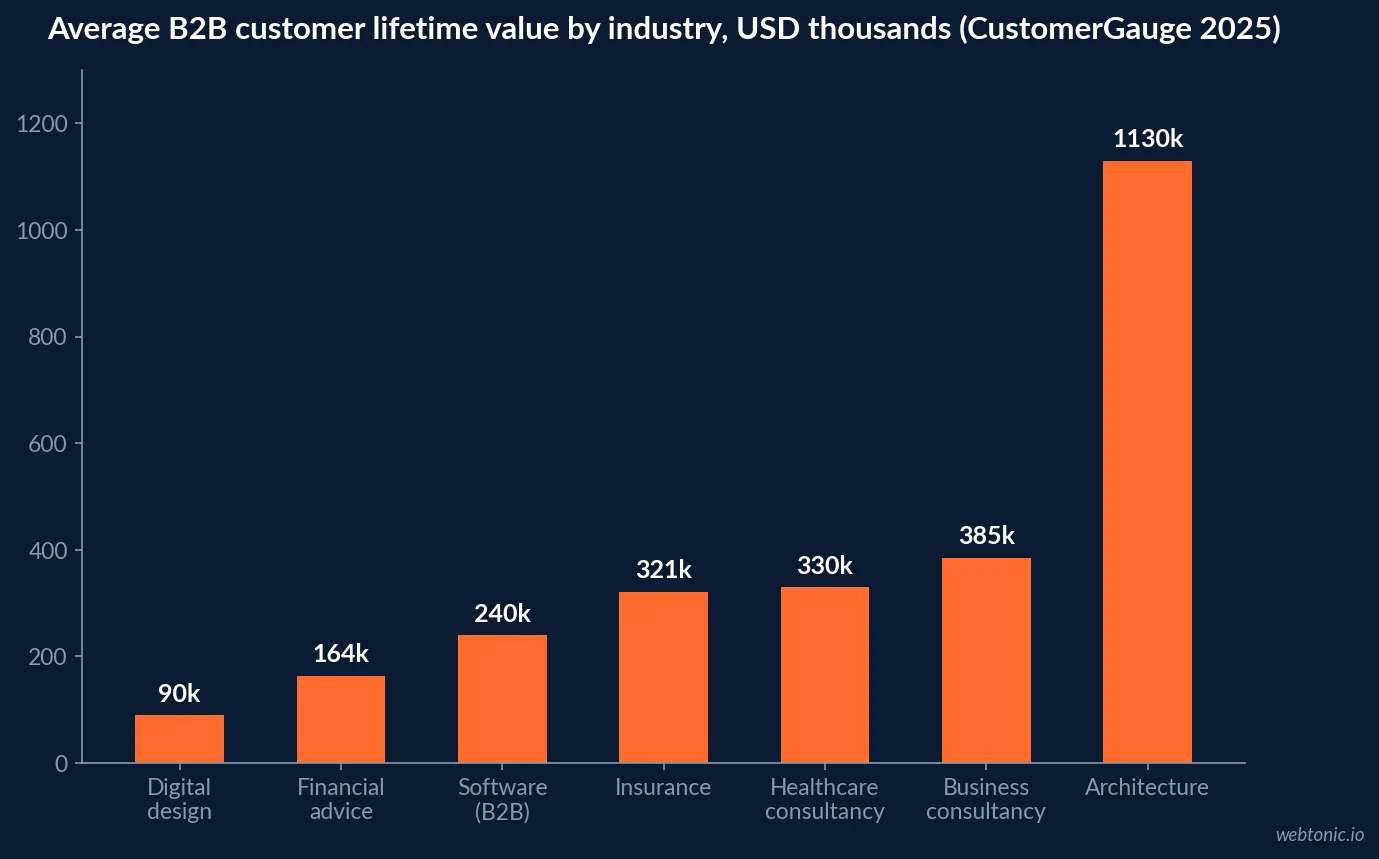
B2B customer lifetime value by industry (CustomerGauge)
Most B2B sectors fall between $164,000 and $385,000, with architecture as a clear outlier on the high end and digital design as the outlier on the low end. What separates the top from the bottom is not deal size alone - it is whether the relationship structure is a long compliance- or project-driven retainer or a shorter, often one-off, project engagement.
| B2B industry | Avg. CLTV (CustomerGauge) | Typical customer lifetime | What drives the difference |
|---|---|---|---|
| Architecture firm | $1,130,000 | Long, project-based retainers | High project value + multi-year relationships |
| Business consultancy | $385,000 | Medium-long, retainer + project mix | Recurring advisory fees + expansion |
| Healthcare consultancy | $330,000 | Long, regulatory-driven | Compliance dependency + switching costs |
| Insurance company | $321,000 | Long, annual renewals | Premium size + low churn in compliant markets |
| B2B software company | $240,000 | Medium, SaaS renewal cycles | Seat expansion + platform dependency |
| B2B financial advice | $164,000 | Long, fiduciary relationships | AUM growth + referral networks |
| Digital design brand | $90,000 | Short-medium, often project-based | One-off project model limits compounding |
The ratio that matters more than the raw number
CustomerGauge's benchmark work frames CLTV against acquisition cost rather than in isolation: the universal target across every B2B sector in its research is a 1:3 CAC-to-CLTV ratio. An architecture firm acquiring clients at $50,000 with a $1.13 million CLTV is running at roughly 22:1 - comfortably above target. A digital design brand at the $90,000 CLTV end has far less room before acquisition spend erodes the relationship's value.
The practical takeaway: benchmark your own CAC:CLTV ratio against 1:3 before benchmarking your raw CLTV number against the industry table. The ratio tells you whether growth is profitable; the raw number alone does not.
Ecommerce and consumer CLV by industry (Shopify 2026)
Consumer CLV runs on a completely different scale - typically two to four orders of magnitude smaller than B2B - because it is built from repeat purchase frequency rather than contract value. Shopify's 2026 blog reports the following ranges across eight consumer categories, most clustering under $600 with home goods and luxury as outliers on the high end.
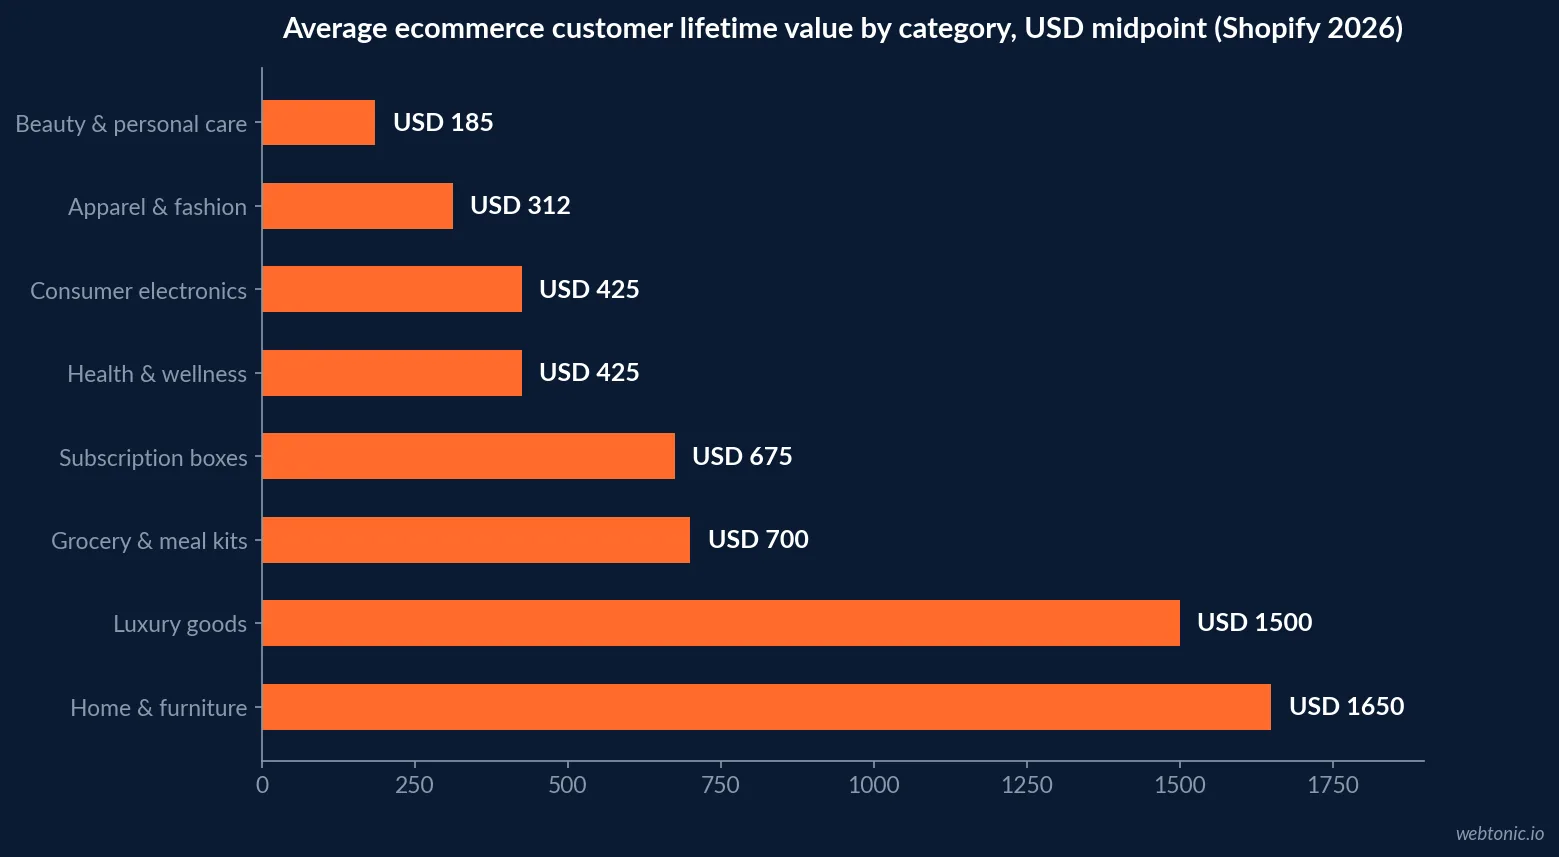
| Ecommerce category | Avg. CLV (Shopify 2026) | What drives the difference |
|---|---|---|
| Home and furniture | $800-$2,500 | High order value, infrequent repeat purchase |
| Luxury goods | $1,000+ | High margin, small base, deep brand loyalty |
| Grocery and meal kits | $400-$1,000+ | Retention-dependent, subscription-adjacent |
| Subscription box services | $450-$900 | Automated renewal extends customer lifespan |
| Health and wellness | $300-$550+ | Recurring, consumable subscription orders |
| Consumer electronics | $250-$600 | High order value offset by low purchase frequency |
| Apparel and fashion | $312 | Seasonal repeat purchase, moderate frequency |
| Beauty and personal care | $185 | Low order value, fast replenishment cycles |
Where the two tables actually meet
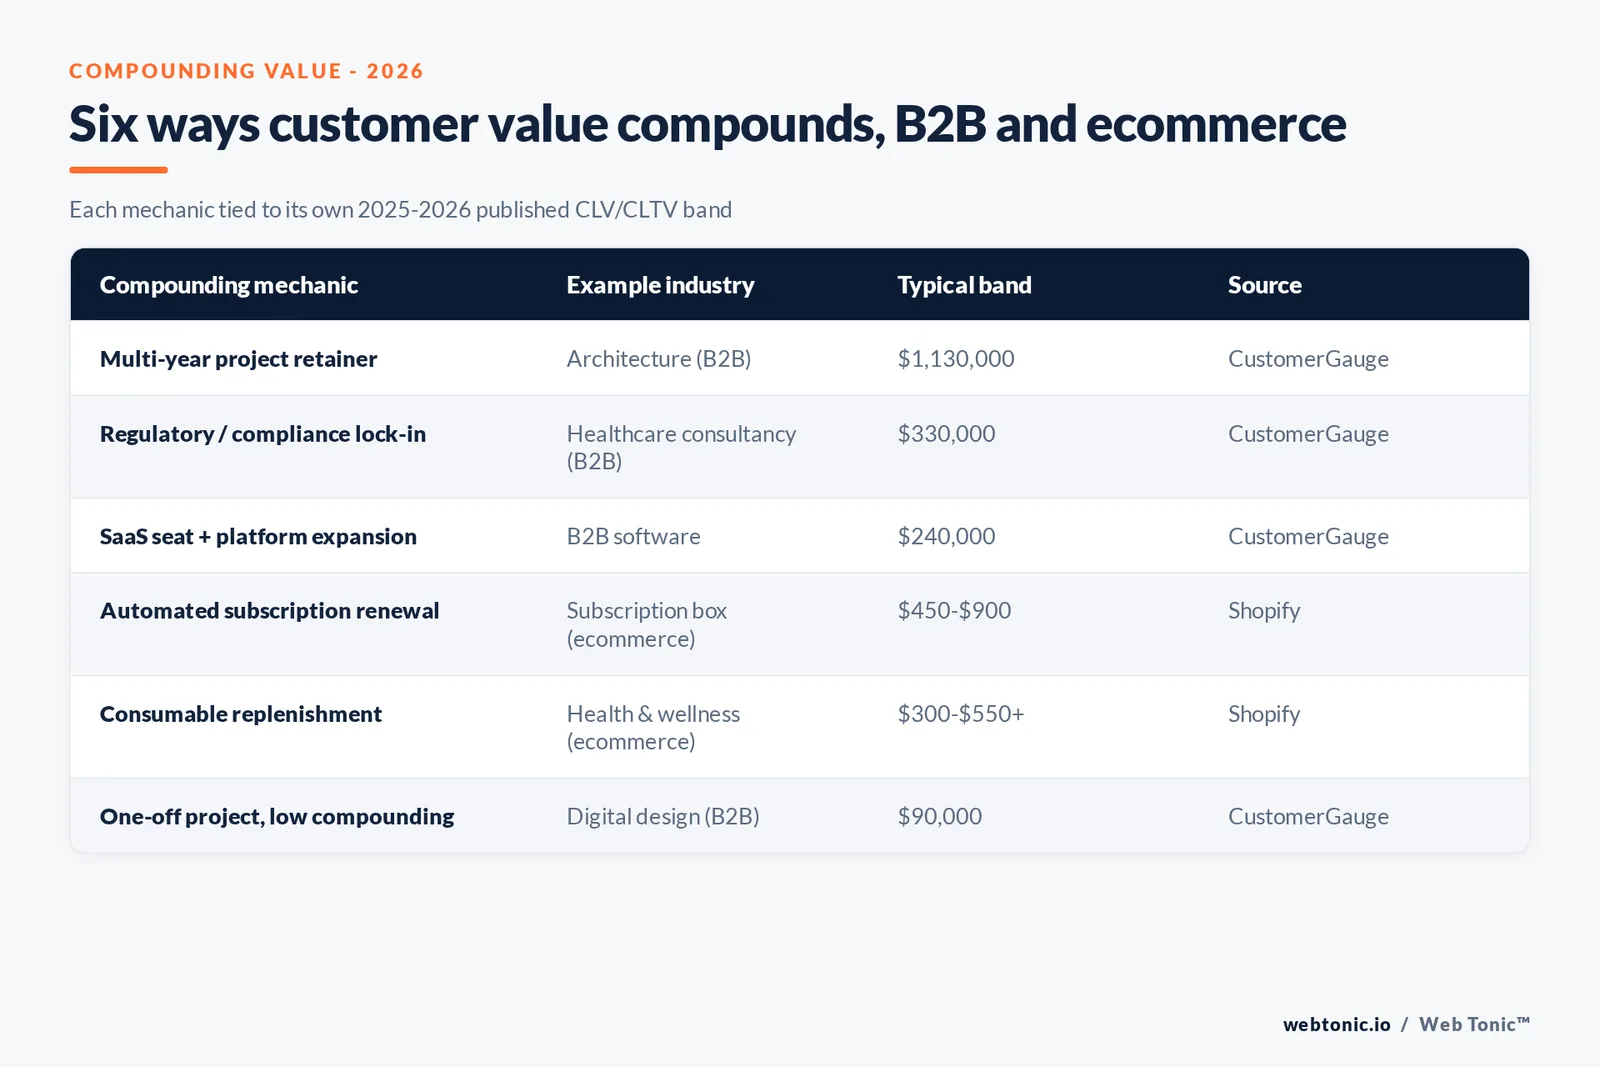
The categories closest to converging are subscription-driven ecommerce and B2B SaaS - both compound value through an automated renewal event rather than a one-off purchase or negotiation. A subscription box brand at $450-$900 CLV and a B2B software company at $240,000 CLTV look nothing alike in dollar terms, but both are built on the same underlying mechanic: reduce the friction of re-purchase and the lifetime value compounds on its own.
Our data and analytics practice builds the cohort models that separate a genuinely high-CLV segment from one that just looks good on a blended average.
| Compounding mechanic | Example industry | Typical CLV/CLTV band | Source |
|---|---|---|---|
| Multi-year project retainer | Architecture (B2B) | $1,130,000 | CustomerGauge |
| Regulatory / compliance lock-in | Healthcare consultancy (B2B) | $330,000 | CustomerGauge |
| SaaS seat + platform expansion | B2B software | $240,000 | CustomerGauge |
| Automated subscription renewal | Subscription box (ecommerce) | $450-$900 | Shopify |
| Consumable replenishment | Health and wellness (ecommerce) | $300-$550+ | Shopify |
| One-off project, low compounding | Digital design (B2B) | $90,000 | CustomerGauge |
The retention math behind every row in these tables
Both tables above are ultimately a retention story wearing an industry label. Bain & Company's long-standing research on customer economics found that increasing customer retention by as little as 5% can lift profit by 25% or more, because return customers buy more over time, cost less to serve as trust builds, and refer others at a higher rate than a brand-new acquisition channel ever will. That is the mechanic driving the gap between architecture's $1.13 million CLTV and digital design's $90,000: not a bigger initial contract, but a longer, better-retained relationship.
HubSpot's own CLV methodology breaks the calculation into the same three inputs regardless of industry - average purchase value, purchase frequency, and average customer lifespan - which is why a $1,130,000 architecture contract and a $185 beauty order are structurally the same formula at wildly different scales. Improve any one of the three inputs and the number in either table moves in the same direction.
| CLV/CLTV input | Lever on the B2B side | Lever on the ecommerce side |
|---|---|---|
| Average purchase value | Contract size, scope of retainer | Average order value, bundling |
| Purchase frequency | Renewal cadence, expansion modules | Repeat purchase rate, subscriptions |
| Customer lifespan | Multi-year retainer, switching costs | Loyalty programs, replenishment timing |
How eMarketer's broader ecommerce dataset compares
eMarketer tracks CLV benchmarks sourced from AdScale's analysis of 1,071 US ecommerce brands across 15 verticals, segmenting further by revenue tier (startups under $100,000, small businesses $100,000 to $1 million, emerging $1 million to $10 million, and established $10 million to $50 million). That revenue-tier layer is the piece Shopify's category table does not capture: CLV inside a single vertical still varies by how mature the brand's retention programs are, not only by what it sells.
The practical implication: a $10 million apparel brand and a $200,000 apparel brand should not be benchmarked against the same $312 figure without adjusting for that maturity gap.
Klaviyo's own ecommerce benchmark data, drawn from its merchant base, points at the same maturity gap from a different angle: brands running structured lifecycle email and SMS programs consistently pull a larger share of revenue from repeat customers than brands relying on one-off acquisition campaigns - the CLV table above rewards exactly that behavior, category by category.
What moves a business up its own table
On the B2B side, the levers are renewal predictability and account expansion - the sectors at the top of CustomerGauge's table (architecture, consultancy) are not necessarily selling at higher initial contract value, they are retaining and expanding for longer. On the ecommerce side, Shopify's data points to the same mechanic in miniature: subscription automation and consumable replenishment cycles outperform one-time, seasonal purchase categories.
Either way, the fix is rarely acquisition. It is reducing the friction between one purchase or renewal and the next. Our growth marketing practice and breakdown of paid acquisition costs both start from that same CAC-versus-CLTV framing before touching a channel budget.
Reading the tables correctly
CustomerGauge's own note applies to both tables: CLTV and CLV vary significantly within an industry based on contract structure, retention rates, upsell activity and, on the ecommerce side, average order value and repeat-purchase cadence. The most defensible use of either table is not "am I above or below the industry number" but "does my CAC-to-CLTV ratio clear 1:3, and is my retention trend moving my own number up or down year over year."
If you want the tracking and cohort dashboards built before that conversation happens, talk to us.
Putting a number on your own business first
Before benchmarking against either table, calculate your own CLV or CLTV using the same three inputs both use: average purchase or contract value, purchase or renewal frequency, and average customer lifespan. Compare that number against your CAC, not just against the industry row - a business tracking above the 1:3 CAC-to-CLTV target but below its industry's raw CLV figure is in a healthier position than one hitting the industry average on a 1:1.5 ratio.
| Step | What to calculate | Benchmark against |
|---|---|---|
| 1 | Average purchase or contract value | Your own trailing 12-month average |
| 2 | Purchase or renewal frequency | Your industry's typical cadence (tables above) |
| 3 | Average customer lifespan | Your own cohort retention curve |
| 4 | CAC-to-CLTV ratio | 1:3 minimum (CustomerGauge) |
Frequently Asked Questions
What is the average customer lifetime value in SaaS versus ecommerce?
They are not comparable on the same axis. CustomerGauge's B2B research puts software company CLTV at a median $240,000, inside a B2B band that runs from $90,000 for digital design brands to $1.13 million for architecture firms. Shopify's 2026 ecommerce benchmarks put consumer CLV between $100 and $2,500, with most categories clustering under $600. The gap is structural: B2B relationships compound over years of renewals, ecommerce relationships compound over repeat orders.
Why does architecture have the highest B2B customer lifetime value?
Long project-based retainers plus multi-year relationships. CustomerGauge's research puts architecture firm CLTV at $1.13 million, nearly three times the next-highest B2B sector (business consultancy at $385,000), because a single client relationship can span years of phased project work rather than one transaction.
What CAC-to-CLTV ratio should I target?
CustomerGauge's benchmark research cites 1:3 as the universal target across industries - a customer should be worth at least three times what it cost to acquire them. Below that ratio, growth is likely unprofitable once fully loaded costs are counted; well above it, especially past 1:5, you may be under-investing in acquisition relative to the value on the table.
Why is ecommerce CLV reported as a range instead of one number?
Because purchase frequency and order value swing widely inside 'ecommerce.' Shopify's 2026 data shows home and furniture brands averaging $800 to $2,500 CLV on high ticket size but infrequent purchases, while beauty brands average a flatter $185 on frequent, low-cost replenishment. A single ecommerce average would blend two entirely different retention models.
Which industries compound customer value the fastest?
Subscription-driven categories. Shopify's benchmarks show subscription box services running $450 to $900, double to triple a comparable one-time-purchase model, because automated renewal removes the re-purchase decision. On the B2B side, insurance and B2B software compound through multi-year renewal cycles rather than subscription automation, landing at $321,000 and $240,000 respectively.
Sources
CustomerGauge - Average B2B customer lifetime value by industry (2025 research)
Shopify - Average customer lifetime value by industry in 2026
eMarketer - Customer Lifetime Value (CLV) (US) by industry and country
Bain & Company - Prescription for cutting costs (customer retention and profit research)
HubSpot - How to calculate customer lifetime value (CLV) and why it matters
Klaviyo - Ecommerce email marketing benchmark report