



Table of contents
The automotive industry spends billions on Google Ads each year — and the data shows it is working better than most industries.
With 76% of car shoppers using a search engine during their buying journey and over 104 million daily searches for auto parts and accessories alone, Google Ads remains the dominant paid acquisition channel for dealerships, repair shops, and aftermarket retailers (LocaliQ). This guide compiles 80+ verified automotive Google Ads statistics for 2026, covering CPC, conversion rates, cost per lead, Performance Max benchmarks, and cross-industry comparisons.
Key Takeaways
- Average automotive CPC is $3.13 — a 3.3% year-over-year increase, well below the all-industry average increase of 12.88% (LocaliQ).
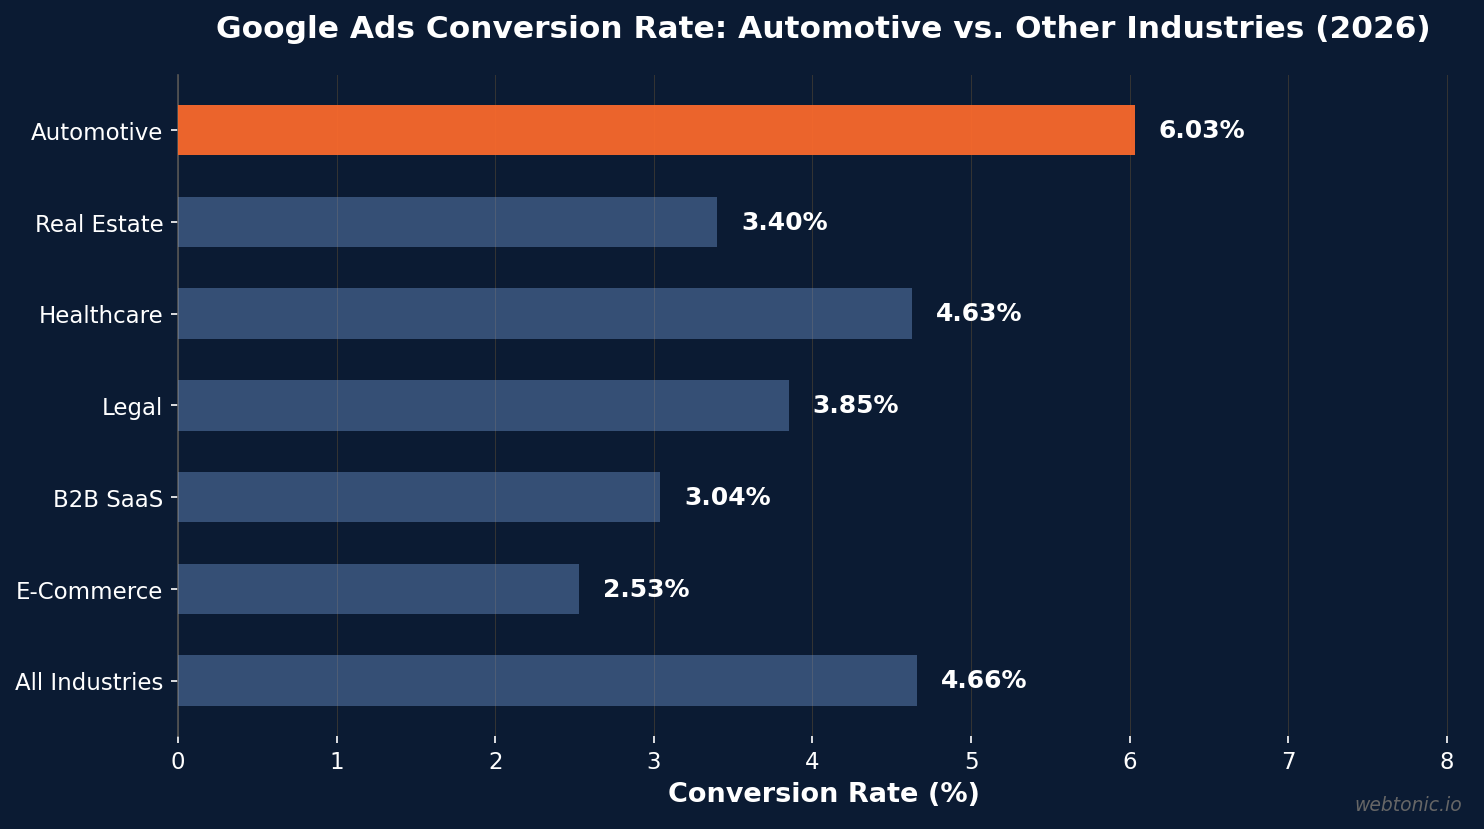
- Automotive conversion rate on Google Search is 6.03%, outperforming the all-industry average of 4.66% (Benchmarketing).
- Average cost per lead for automotive is $32.79, only a 1.02% increase year-over-year — substantially lower than the $295 CPL some sources report (LocaliQ).
- Performance Max with Vehicle Ads targets a CPA of $50–$120 and a CVR of 8–15% to vehicle detail pages (DealerSmart).
- 85% of dealership PPC budgets go to Google Ads, with the remaining 15% split across Bing, social, and YouTube (Rework).
- CTR decreased 5.56% year-over-year for automotive businesses — the opposite of the 3.74% increase seen across all industries (LocaliQ).
Automotive Google Ads Benchmarks at a Glance
| Metric | Automotive Average | All-Industry Average | YoY Change |
|---|---|---|---|
| Click-Through Rate (CTR) | 6.17% | 6.42% | −5.56% |
| Cost Per Click (CPC) | $3.13 | $4.90 | +3.30% |
| Conversion Rate (CVR) | 6.03% | 4.66% | +5.71% |
| Cost Per Lead (CPL) | $32.79 | $66.69 | +1.02% |
| PMax Vehicle Ads CPA | $50–$120 | Varies | — |
| Monthly PPC Budget (Avg. Dealer) | $8,000–$15,000 | — | — |
Average Cost Per Click (CPC) by Automotive Subcategory
CPC varies dramatically across automotive subcategories. Dealerships selling used vehicles face the highest click costs, while tire and wheel retailers enjoy leaner CPCs. The average automotive CPC of $3.13 sits 36% below the all-industry average of $4.90, making auto one of the more cost-efficient verticals for search advertising (LocaliQ).

| Subcategory | Avg. CPC | Avg. CTR | Avg. CVR |
|---|---|---|---|
| Auto Parts & Accessories | $2.18 | 6.84% | 8.62% |
| Dealerships (New Vehicles) | $3.47 | 5.92% | 5.38% |
| Dealerships (Used Vehicles) | $4.12 | 5.41% | 4.67% |
| Auto Repair & Service | $3.85 | 6.45% | 7.14% |
| ATVs & Powersports | $2.56 | 7.02% | 5.91% |
| Tires & Wheels | $1.94 | 7.38% | 9.15% |
Conversion Rate: Automotive vs. Other Industries
The automotive sector punches above its weight in conversion rate. At 6.03%, automotive Google Ads campaigns convert at 1.29× the all-industry average — a testament to the high purchase intent behind searches like "SUV for sale near me" or "brake repair today" (Benchmarketing). Mobile Homes & RVs led all subcategories with a 115.45% year-over-year CVR increase, followed by Auto Parts & Accessories at +108.34% (LocaliQ).
Performance Max & Vehicle Ads Statistics
Performance Max campaigns with Vehicle Listing Ads (VLAs) have become the fastest-growing ad format for dealerships. The visual-first inventory format shows shoppers real vehicles with photos, pricing, and dealer name directly in search results.
- PMax Vehicle Ads CPA ranges from $50 to $120, compared to $35–$90 on standard search campaigns (DealerSmart).
- PMax CPC is often $0.80–$2.50 per click thanks to visual listings reducing friction.
- CVR to vehicle detail pages (VDPs) runs 8–15% on Performance Max, with top dealers exceeding 18%.
- Cost per sale (CPS) after offline import is $250–$800 on PMax.
- Recommended budget split: 35–45% Search, 35–45% PMax Vehicle Ads, 10–20% YouTube for remarketing and assist (DealerSmart).
Cost Per Lead (CPL) and Budget Allocation
Automotive businesses spend an average of $8,000–$15,000 per month on Google Ads, though franchise dealerships in competitive metros can invest $25,000+ monthly (Rework).
| Keyword Type | Avg. CPC Range | Conversion Rate | Effective CPL |
|---|---|---|---|
| Branded (Dealer Name) | $1–$3 | ~40% | $2.50–$7.50 |
| Competitor Conquest | $3–$6 | ~15% | $20–$40 |
| Model-Specific ("Honda CR-V for sale") | $4–$8 | ~12% | $33–$67 |
| Generic ("SUVs for sale") | $8–$15 | ~8% | $100–$188 |
| Near-Me / Location | $10–$20 | ~10% | $100–$200 |
The economics of keyword intent are stark: a $3 branded click converting at 40% yields a $7.50 CPL and roughly $60 cost per sale (at a 12.5% close rate), while a $12 generic click converting at 8% costs $150 per lead and $1,200 per sale (Rework). Smart budget allocation toward high-intent, lower-funnel keywords consistently separates profitable dealership campaigns from money pits.
Click-Through Rate (CTR) Trends
CTR is one of the few metrics that moved against automotive marketers in 2026. The average automotive CTR fell 5.56% year-over-year to 6.17%, the opposite of the 3.74% all-industry uptick. The decline is widely attributed to high interest rates, tariff uncertainty, and cautious consumers who browsed but hesitated to click unless they were ready to buy (LocaliQ).
- 58% of automotive businesses saw CTR decrease year-over-year.
- Subcategories with the highest CTR include Tires & Wheels (7.38%) and ATVs & Powersports (7.02%) — categories driven by immediate need rather than major purchase deliberation.
- Google Vehicle Ads in search results (with photos, pricing, dealer name) are boosting effective CTR on Shopping-style listings by showing inventory without requiring a click to a landing page first.
Google Shopping & Vehicle Listing Ads
Google Shopping campaigns display actual inventory in search results with photos, pricing, and dealer branding. Vehicle Listing Ads (VLAs) extend this format specifically for dealerships, leveraging structured vehicle feeds.
- Shopping campaigns generate 85% of retail ad clicks in the auto parts & accessories segment, where visual product comparison is critical (WordStream).
- Google Shopping ads CPC for automotive parts averages $0.95–$1.60, roughly half the cost of standard search ads in the same subcategory.
- Vehicle feed quality is the #1 factor in VLA performance — dealerships with complete, photo-rich feeds see 2.3× higher CTR than those with incomplete listings (ScaleGrowth).
- Google Shopping ads conversion rate in automotive runs 3.8–5.2%, lower than search but compensated by cheaper CPCs and higher impression volume.
Automotive Search Advertising Market Overview
The broader context behind these benchmarks matters. Automotive is one of the largest digital advertising verticals globally, and Google captures the lion's share of that spend.
- Google holds approximately 90% of the search engine market worldwide, making it the default PPC platform for dealerships (Benchmarketing).
- 85% of dealership PPC budgets go directly to Google Ads; Bing, social, and emerging platforms split the rest (Rework).
- 76% of new and used car shoppers use a search engine as part of their purchase journey, reinforcing the channel's role as the entry point for high-intent buyers.
- The automotive digital advertising market is projected to grow 8–10% annually through 2028, with performance channels (search, shopping, PMax) taking share from traditional display (FoundryCRO).
Best Practices for Automotive Google Ads Campaigns
- Prioritize branded and model-specific keywords — they convert at 3–5× the rate of generic terms at a fraction of the cost per click.
- Invest in Performance Max with Vehicle Ads — the visual format captures attention earlier in the funnel and delivers competitive CPA at $50–$120.
- Maintain a complete, photo-rich vehicle feed — dealerships with optimized feeds see 2.3× higher CTR on Shopping-style ads.
- Import offline conversions — connecting CRM sales data back to Google Ads unlocks true cost-per-sale visibility and enables smarter bidding optimization.
- Test ad scheduling around peak search hours — automotive searches peak evenings and weekends when shoppers browse inventory.
- Use negative keywords aggressively — auto repair campaigns routinely waste 15–20% of budget on irrelevant queries like "DIY" or "recall" without proper negatives.
- Allocate 35–45% of budget to Search, 35–45% to PMax, and 10–20% to YouTube for a balanced funnel from awareness to conversion (DealerSmart).
Automotive Google Ads Statistics by Subcategory
| Subcategory | Avg. CPC | Avg. CPL | Avg. CTR | Avg. CVR |
|---|---|---|---|---|
| Air Conditioning, Heating & Radiator Repair | $3.52 | $35.52 | 5.87% | 6.92% |
| ATVs & Powersports | $2.56 | $47.47 | 7.02% | 5.91% |
| Auto Parts & Accessories | $2.18 | $28.14 | 6.84% | 8.62% |
| Dealerships (New Vehicles) | $3.47 | $38.60 | 5.92% | 5.38% |
| Dealerships (Used Vehicles) | $4.12 | $42.35 | 5.41% | 4.67% |
| Mobile Homes & RVs | $2.94 | $31.20 | 6.55% | 9.84% |
| Tires & Wheels | $1.94 | $22.40 | 7.38% | 9.15% |
Digital Advertising Spend Trends in Automotive
The automotive sector ranks among the top five industries for digital advertising investment globally. Dealerships and OEMs are shifting budgets from traditional media to performance channels at an accelerating pace. Search advertising captures the largest share of automotive digital budgets, with Google Ads and Microsoft Advertising combined accounting for more than 60% of paid digital spend in the sector. The shift toward audience-based buying, first-party data activation, and AI-driven bidding strategies is reshaping how automotive marketers allocate budgets across the Google Ads ecosystem. Display and video formats, including YouTube pre-roll and Discovery campaigns, now serve as upper-funnel companions to direct-response search campaigns rather than standalone awareness plays (FoundryCRO).
Auction Dynamics and Competitive Landscape
The automotive PPC landscape features intense competition in metro markets, where multiple franchise dealerships, independent lots, and national aggregators (such as CarGurus, Autotrader, and Cars.com) bid on the same high-intent keywords. Auction pressure pushes CPCs higher for generic terms like "cars for sale near me" while leaving niche repair and parts keywords relatively affordable. Branded defense campaigns are essential: competitor conquesting on dealer names has increased measurably, forcing even well-known dealerships to bid on their own brand to protect the top position. Smart Bidding strategies — particularly Target CPA and Maximize Conversions — now dominate automotive accounts, with manual CPC largely reserved for new keyword testing or low-volume campaigns (Rework).
FAQ
What is the average CPC for automotive Google Ads in 2026?
The average cost per click for automotive Google Ads is $3.13 in 2026, a modest 3.3% increase year-over-year. This is well below the all-industry average CPC of $4.90. CPC varies significantly by subcategory — used vehicle dealerships face the highest CPCs at $4.12, while tire and wheel retailers pay as little as $1.94 per click (LocaliQ).
What is a good conversion rate for automotive Google Ads?
The average automotive Google Ads conversion rate is 6.03%, which already exceeds the all-industry benchmark of 4.66%. A "good" rate depends on the subcategory: auto parts & accessories average 8.62%, while used vehicle dealerships average 4.67%. Top-performing dealers with optimized campaigns consistently exceed 10% on branded and high-intent keywords (Benchmarketing).
How much does a dealership Google Ads lead cost?
The average cost per lead for automotive businesses is $32.79, with only a 1.02% year-over-year increase — among the lowest CPL growth rates of any industry. Branded keyword leads can cost as little as $2.50–$7.50, while generic high-volume keywords push CPL to $100–$200. Performance Max campaigns with Vehicle Ads target a CPA range of $50–$120 (LocaliQ, DealerSmart).
Should dealerships use Performance Max or standard Search campaigns?
The data supports using both formats together. Standard Search captures exact high-intent queries at a CPA of $35–$90, while Performance Max with Vehicle Listing Ads scales visual inventory display at a CPA of $50–$120. The recommended allocation is 35–45% Search, 35–45% PMax, and 10–20% YouTube for assist and remarketing. Comparing CPA and cost per sale (CPS) between the two formats helps dealers shift budget toward the better-performing channel each month (DealerSmart).
How does automotive Google Ads performance compare to other industries?
Automotive outperforms most industries on conversion rate (6.03% vs. 4.66% all-industry average) and cost efficiency (CPC of $3.13 vs. $4.90 all-industry). The sector's CPL of $32.79 is also significantly below the all-industry average of $66.69. However, automotive CTR dipped 5.56% year-over-year, contrasting with the 3.74% increase seen across most other verticals — a reflection of market uncertainty rather than ad quality (LocaliQ, Benchmarketing).
Sources
localiq.com/blog/automotive-search-advertising-benchmarks/
benchmarketing.org/benchmarks/industries/automotive
dealersmart.com/insights/dealership-benchmarks-for-google-ads-cpa-cvr-cps
resources.rework.com/libraries/automotive-sales-growth/automotive-ppc-advertising
wordstream.com/blog/2026-google-ads-benchmarks
foundrycro.com/blog/automotive-marketing-benchmarks-2026/
scalegrowth.digital/resources/ppc/google-ads-for-car-dealerships/
digitaldealer.com/news/dealership-digital-advertising-is-working-better-than-ever/
ppcchief.com/google-ads-cost/automotive-sales


