



Table of contents
A 2026 dataset of 94 live Google Ads accounts found Performance Max returning 9.32x ROAS against 2.61x for Search, and Maximize Conversion Value bidding beating Maximize Conversions 6.44x to 1.96x. Automated ads are outperforming manual ones in 2026 -- but only for the accounts feeding the algorithm the data it needs, which is the part most "AI wins" headlines leave out.
Key Takeaways
- Performance Max delivered 9.32x ROAS versus 2.61x for Search across 94 accounts.
- Maximize Conversion Value beat Maximize Conversions 6.44x to 1.96x on ROAS.
- PMax absorbed 95% of platform impressions while consuming only 38% of spend.
- The dataset covered $3,014,680 in spend and 85,834 conversions.
- Blended platform ROAS across all channels and strategies was 5.01x.
- E-commerce accounts averaged 6.72x ROAS; lead-gen accounts averaged a $46.68 CPA.
- 32,201 negative keyword exclusions across 74 accounts prevented an estimated $20,712 in wasted spend.
- Growth-tier accounts (under $3K/month) matched Professional-tier ROAS at 3.18x vs. 3.22x.
- Scale-tier accounts underperformed both at 2.14x ROAS despite larger budgets.
- Meta reported $42.3 billion in Q1 2026 ad revenue, up 19% year over year, crediting automated products.
- E-commerce accounts averaged a 6.72x ROAS under automated bidding versus a $46.68 CPA for lead-gen accounts with no revenue signal to optimize toward.
- Hybrid business models landed in between at 2.23x ROAS.
- Jasper's 2026 survey of 1,400 marketers found only 41% can confidently prove AI ROI, down from 49% the year before.
The headline gap, from a live 94-account dataset
Lyra's State of Google Ads Optimization 2026 report is unusual among ad-platform research for being built entirely from live, currently managed accounts rather than a survey: 94 accounts, 522 campaigns, $3,014,680 in spend and 240.7 million impressions between June 2025 and April 2026. The core finding is stark. Performance Max delivered 9.32x ROAS across 68 accounts, compared with 2.61x ROAS for Search across 79 accounts. PMax absorbed 95% of platform impressions (191.9 million of 240.7 million) while consuming only 38% of platform spend, driven largely through Display Network, YouTube and Gmail inventory at a lower blended CPC of $0.42 versus Search's $1.89.
The report's own caveat matters as much as the number: PMax adoption in this dataset skews toward e-commerce accounts with product feeds and accurate conversion-value tracking already in place -- exactly the conditions under which the algorithm performs best. The 9.32x figure describes what automation does with good inputs, not what it does regardless of them.
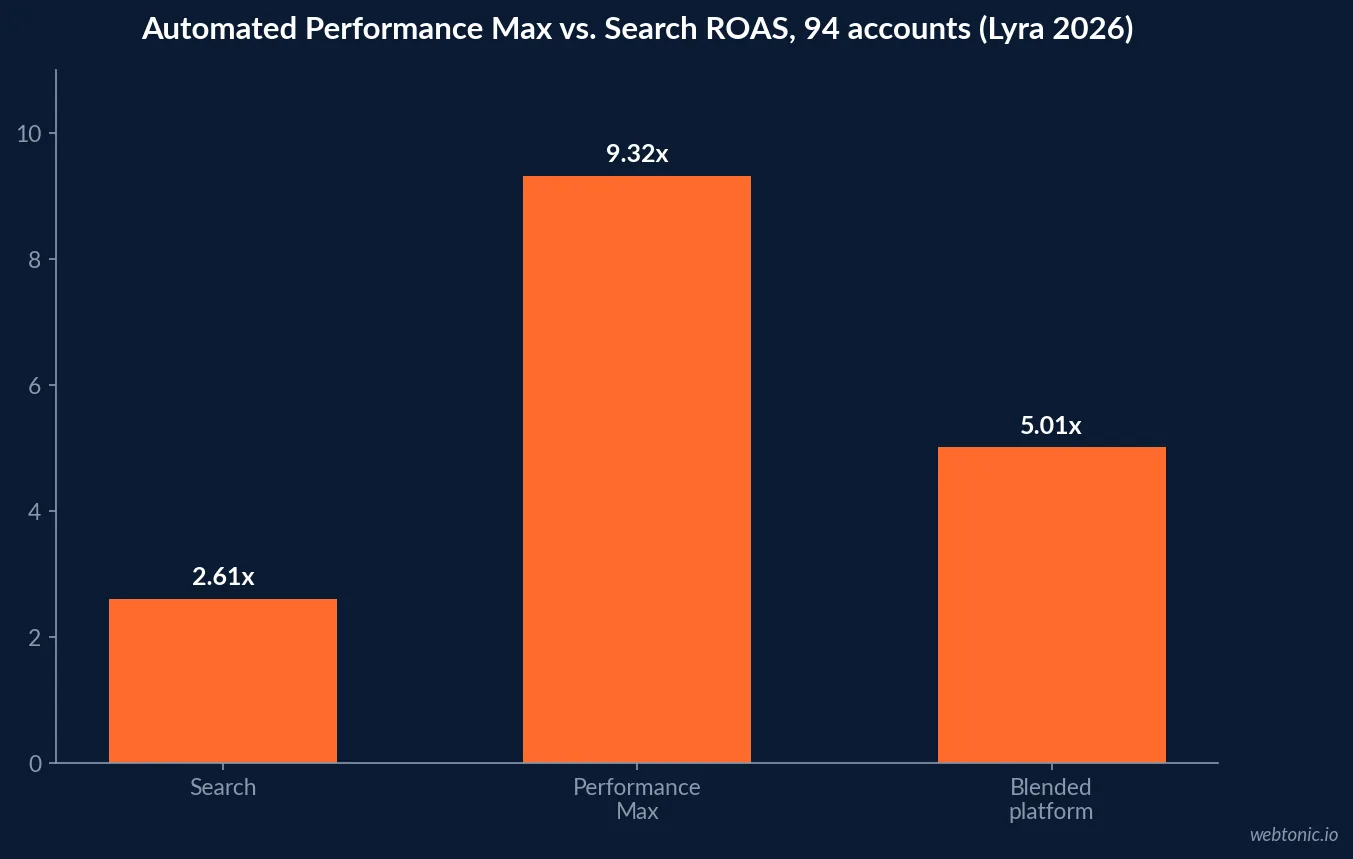
| Channel (94-account dataset, 2026) | Accounts | Spend | CTR | CPA | ROAS |
|---|---|---|---|---|---|
| Search | 79 | $1,652,304 | 10.72% | $45.16 | 2.61x |
| Performance Max | 68 | $1,150,756 | 1.43% | $23.79 | 9.32x |
| Shopping | 27 | $3,487 | 1.44% | $130.20 | 2.63x |
| Display | 6 | $8,236 | 1.66% | $18.76 | 0.05x |
| Demand Gen | 1 | $89,057 | 0.50% | $230.38 | 0.55x |
Bidding strategy, not campaign type, is the real lever
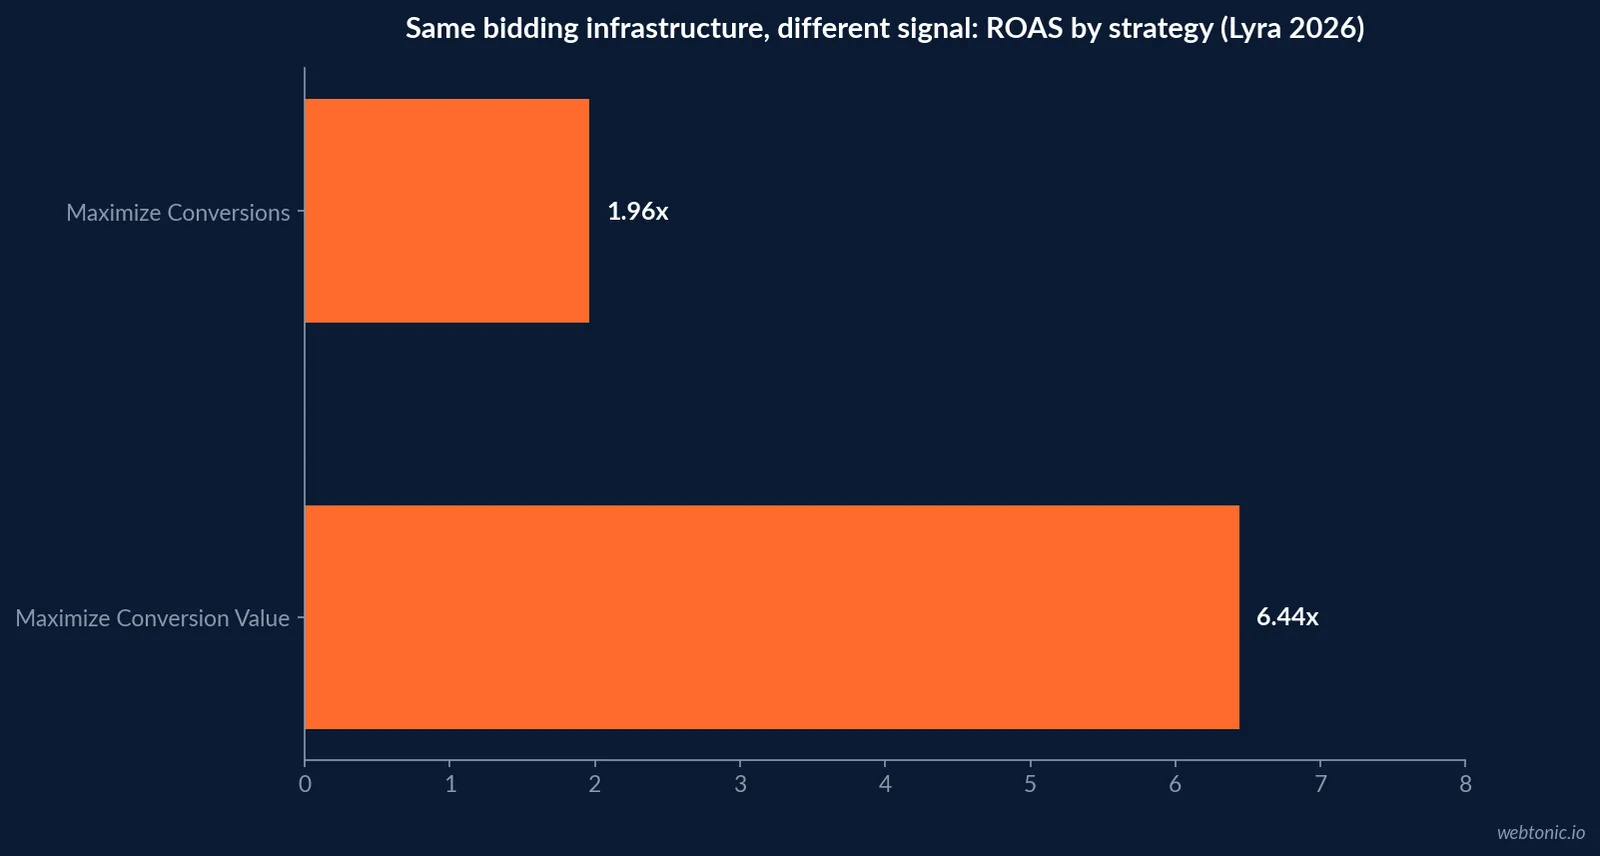
The same report isolates the bidding-strategy comparison and finds a bigger gap than the channel comparison alone suggests. Maximize Conversion Value and Maximize Conversions are adopted by almost identical numbers of accounts (52 versus 55), yet the ROAS gap between them is 6.44x versus 1.96x. Both strategies run on the same Smart Bidding infrastructure; the difference is entirely in what each is told to optimize for. Maximize Conversion Value learns to bid more aggressively on the users and queries that historically produce higher-value sales -- but only if the advertiser passes a reliable transaction_value with each conversion. Feed it noisy or missing revenue data, and the same "smarter" algorithm optimizes toward that noise.
| Bidding strategy (2026) | Accounts | Spend | CPA | ROAS |
|---|---|---|---|---|
| Maximize Conversion Value | 52 | $2,135,344 | $31.23 | 6.44x |
| Maximize Conversions | 55 | $609,557 | $37.62 | 1.96x |
| Target Spend | 23 | $141,120 | $133.24 | 0.09x |
| Target ROAS | 3 | $16,256 | $684.18 | 0.19x |
Where automated ads underperform manual ones
Automation is not a uniform winner across every business model, and the Lyra dataset shows the split inside Google Ads itself. E-commerce accounts -- the business model automated Shopping-style bidding is built for -- averaged a 6.72x blended ROAS, because they pass a real transaction_value with each conversion and ROAS becomes a direct measure of revenue return. Lead-generation accounts, where the "conversion" is a form fill with no immediate revenue attached, averaged a $46.68 CPA instead of a comparable ROAS figure, because there is no reliable value signal for the algorithm to optimize toward. Hybrid accounts sat in between at 2.23x ROAS. The pattern is consistent with the platform's own broader trend: complex, high-consideration purchases give automated bidding less to work with than a simple e-commerce checkout does.
Creative volume is one of the clearest levers inside the automated systems themselves: accounts uploading more creative assets are consistently described across 2026 automation research as out-performing thin creative sets, and catalog feed quality is treated as a prerequisite regardless of budget, since Shopping-style automation pulls its targeting signal directly from the product feed.
What Google itself is automating next, and by how much
Google's own numbers on its newest automation layer, announced at Google Marketing Live 2026, give a rare platform-reported before/after figure rather than a third-party estimate. Google's own announcement reports that Smart Bidding Exploration, which lets Search campaigns bid on less obvious, incremental queries, delivers an average 27% increase in unique converting users where it is active. Campaign total budgets, which let Google's AI move daily spend automatically rather than requiring manual caps, produced an average 66% reduction in manual budget adjustments for advertisers who adopted them. The newest layer, Journey-aware Bidding, extends Target CPA optimization to learn from non-biddable conversions -- phone calls, newsletter signups, form fills -- specifically to give the algorithm more of the signal that the Lyra dataset shows determines whether automation actually helps.
| Google automation feature (2026) | Reported effect | Source |
|---|---|---|
| Smart Bidding Exploration (Search) | +27% unique converting users | Google Marketing Live 2026 |
| Campaign total budgets | -66% manual budget adjustments | Google Marketing Live 2026 |
| Journey-aware Bidding (beta) | Adds non-biddable conversions to Target CPA learning | Google Marketing Live 2026 |
| Demand-led pacing | Automatically shifts daily spend to match demand | Google Marketing Live 2026 |
What automation has not changed: search costs keep climbing
Automation is optimizing inside a market that keeps getting more expensive to enter. WordStream/LocaliQ's 2026 Search Advertising Benchmarks report, built from 13,474 customer campaigns across 23 industries between April 2025 and March 2026, found average cost per click at $5.42, more than double the $2.32 recorded a decade earlier, though year-over-year changes in 2026 were unusually stable after several years of sharp swings. For the first time in five years, overall average cost per lead actually declined slightly, though it still sits at $66.69 against $59.18 a decade ago. None of that is an automation failure -- it is the backdrop automated bidding is trying to buy efficiency inside, not a market it is shrinking.
A separate direct study by Optmyzr, analyzing 30,000 Google Ads accounts for February 2026, shows advertisers extending that same trust to automation at the keyword level: exact match's share of Search spend has declined by roughly 9.5 percentage points since 2022 as broad match, paired with Smart Bidding, became the dominant match type by budget. The one place broad match still loses outright is conversion rate, where phrase match performs 36% better -- a reminder that automation earns trust unevenly even within a single platform.
| Search cost benchmark (LocaliQ/WordStream, Apr 2025-Mar 2026) | 2026 figure | Figure 10 years earlier |
|---|---|---|
| Average cost per click | $5.42 | $2.32 |
| Average cost per lead | $66.69 | $59.18 |
| Sample size | 13,474 campaigns, 23 industries | n/a |
| Match type spend shift since 2022 | Exact match down ~9.5 pts; broad match now dominant | Optmyzr, 30,000 accounts |
The platform side of the trade: automation is also a growth strategy for Meta and Google
Platform revenue growth gives a sense of how much of this automation push is advertiser benefit versus platform monetization strategy. Meta's Q1 2026 results reported revenue of $56.31 billion, up 33% year over year, with ad impressions across the Family of Apps up 19% and the average price per ad up 12% -- growth Meta leadership has directly credited to Advantage+ automated products absorbing more of that impression volume. That does not make the advertiser-side ROAS numbers in this dataset any less real, but it is worth remembering that platform automation is being built to grow platform revenue first, and advertiser efficiency second.
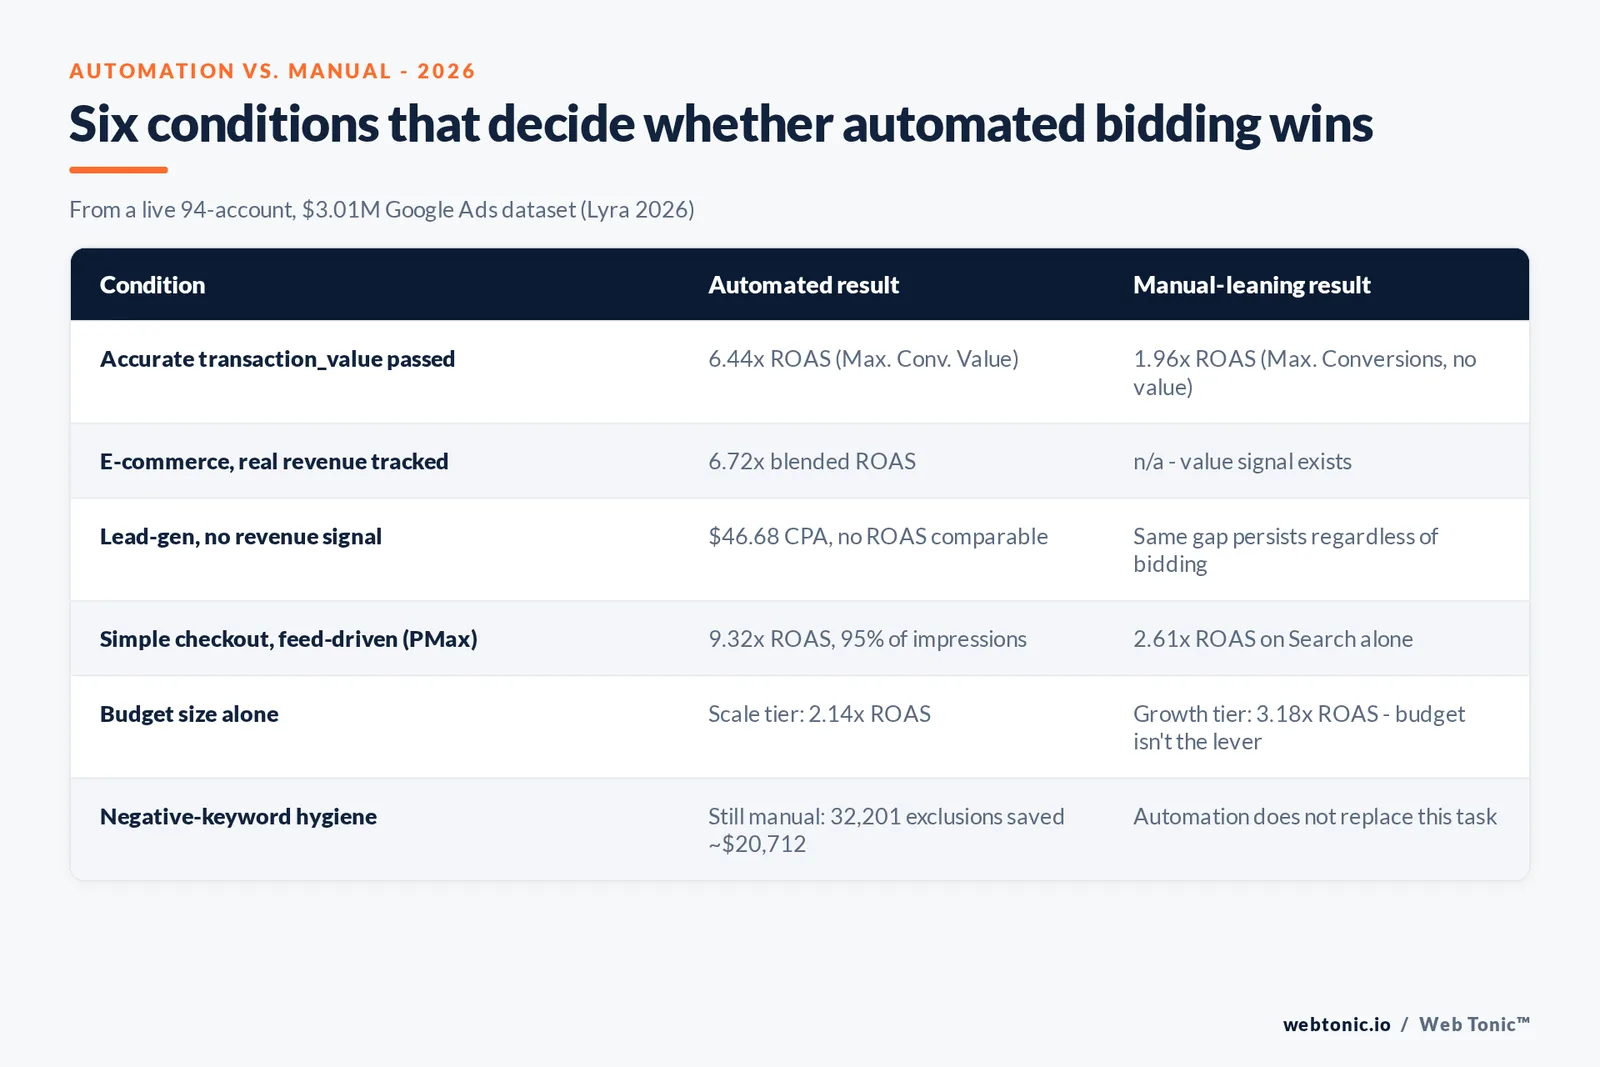
| Condition for automation to win | Evidence |
|---|---|
| The business tracks real revenue per conversion | E-commerce accounts hit 6.72x ROAS vs. $46.68 CPA for untracked lead-gen |
| The purchase is a simple, high-volume checkout | PMax absorbed 95% of impressions at 9.32x ROAS on that mix |
| The account has budget history to learn from | Growth and Professional tiers matched at 3.18x-3.22x ROAS |
| Non-biddable conversions feed the algorithm | Journey-aware Bidding adds calls, forms, signups to Target CPA learning |
| Exploration budget is available for incremental queries | Smart Bidding Exploration: +27% unique converting users |
| Someone still checks negative keywords manually | 32,201 exclusions across 74 accounts prevented an est. $20,712 in waste |
Budget size is not the variable that predicts success
One of the more counter-intuitive findings in the Lyra dataset is that account size does not predict automated-campaign efficiency. Growth-tier accounts spending under $3,000 a month delivered 3.18x ROAS, nearly identical to Professional-tier accounts at 3.22x, and both comfortably outperformed Scale-tier accounts at 2.14x ROAS despite the larger budgets. The report's read is consistent with the bidding-strategy finding above: what an account brings to the algorithm -- clean tracking, a healthy margin profile, accurate value data -- predicts performance more reliably than how much it spends.
That reading fits the wider AI-marketing confidence data too. Jasper's 2026 survey of 1,400 marketers found 91% now use AI in marketing, up from 63% in 2025, but only 41% can confidently prove AI ROI, down from 49% the year before, as expectations for what counts as proof have risen faster than measurement practice has caught up.
What this means before you hand more budget to automation
PPC professionals themselves are cooling on treating automation as the headline priority even as adoption keeps rising. The State of PPC 2026 Global Report, the fourth annual edition from PPCsurvey.com surveying 1,306 PPC professionals, found "leverage automation and AI" had slipped to the third-ranked priority at 43%, down from the number-one spot two years earlier, while 68% named improving campaign efficiency and profitability as their leading focus and 59% named increasing conversions and revenue. The report's own read is that automation is no longer the differentiator it was in 2024 -- it has become table stakes, and the competitive edge has moved to what an account feeds it.
Google's own Performance Max channel performance report documentation confirms the mechanism behind the 9.32x figure: PMax reports actual ROAS or CPA against your target, broken down by channel and format, specifically so an advertiser can verify which inventory -- Search, Display, YouTube, Gmail or Maps -- is producing the number before trusting it account-wide. The 2026 evidence supports automating bidding and campaign structure specifically where the account can feed it clean value data, and staying more hands-on where the purchase is complex or the tracking is not yet reliable. Before shifting budget from Search into Performance Max on the strength of a 9.32x headline, check whether your own conversion-value tracking looks like the accounts that produced that number. Our performance creative team builds the asset volume automated systems reward, and our Google Ads practice audits conversion tracking before recommending a bidding-strategy switch. For the cost side of this decision, see our guide to what Google Ads actually costs in 2026, or talk to us about whether your account is automation-ready.
Frequently Asked Questions
Are automated ads actually performing better than manual campaigns in 2026?
Conditionally, yes, but not automatically. Lyra's State of Google Ads Optimization 2026 report, drawn from 94 live accounts and $3.01M in spend, found Performance Max delivering 9.32x ROAS versus 2.61x for Search, and Maximize Conversion Value bidding beating Maximize Conversions 6.44x to 1.96x. But the report is explicit that the gap reflects which accounts have clean conversion-value data feeding the algorithm, not the algorithm being smarter on its own.
Does automated bidding work without accurate conversion data?
No, and the same dataset shows why: Maximize Conversion Value only outperforms Maximize Conversions when an advertiser passes reliable transaction_value data. Without it, the algorithm optimizes toward noise, and the report's own guidance is to use Maximize Conversions instead when value tracking is missing or unreliable.
Does the business model change whether automation is worth using?
Sharply. In the same 94-account dataset, e-commerce accounts -- which pass real transaction values -- averaged a 6.72x blended ROAS under automated bidding. Lead-generation accounts, where a form fill carries no immediate revenue signal, averaged a $46.68 CPA instead of a comparable ROAS figure, because there is no reliable value data for the algorithm to bid against. Automation performs best on businesses that can hand it a real number to chase.
What is the biggest routine win automation still leaves on the table?
Search term hygiene. Across the 94-account Lyra dataset, 32,201 negative keyword exclusions applied across 74 accounts prevented an estimated $20,712 in wasted spend -- a manual-adjacent task automated bidding does not fully replace on its own.
Does budget size predict how well automation performs?
Not in the 2026 dataset. Growth-tier accounts under $3,000 a month delivered 3.18x ROAS, nearly identical to Professional-tier accounts at 3.22x, and both outperformed Scale-tier accounts at 2.14x -- evidence that account inputs like conversion tracking quality matter more than budget size.
Sources
Lyra - State of Google Ads Optimization 2026
Jasper - The State of AI in Marketing 2026
Google - New updates to the measurement suite in Google Ads
Google - Google Marketing Live 2026: bidding and budgeting news
WordStream / LocaliQ - Search Advertising Benchmarks by Industry 2026
Optmyzr - Broad Match is Winning the Budget War. Is It Winning on Performance Too?
Meta - Meta Reports First Quarter 2026 Results
Google Ads Help - About the channel performance report for Performance Max
PPCsurvey.com - The State of PPC 2026 Global Report


