



Table of contents
Half of auto repair shops still cannot answer basic questions about their own numbers. Before evaluating any tracking or analytics tool, this page lays out what the 2026 industry data says shops actually track, what it costs to generate a lead in the first place, and where the remaining technology gaps sit - built from AutoLeap's benchmark survey, WordStream's search benchmarks and CallRail's automotive call data.
Key Takeaways
- Only 51% of auto repair shops actively track KPIs.
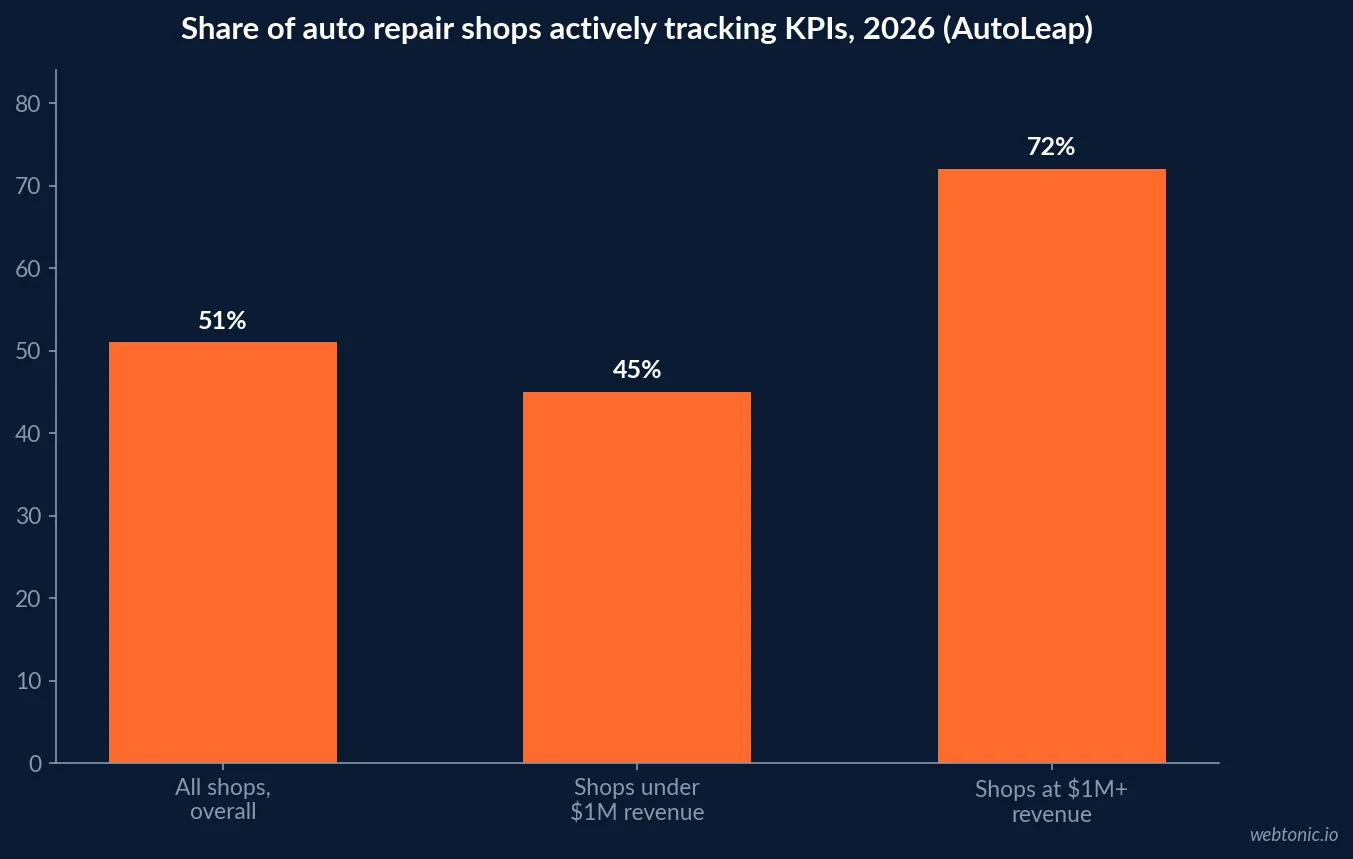
- 72% of shops with $1M+ revenue track KPIs, against a lower share below that mark.
- Shop management software saves more than 30% of admin time, per user survey data.
- 78% of KPI-tracking shops watch gross profit margin.
- 68% watch average repair order size as a core metric.
- Auto repair's median Google Ads cost per lead is $29.96.
- That is 55% below the $66.69 all-industry average cost per lead.
- Auto repair converts at 15.51% against an 8.18% all-industry average.
- Auto repair's CTR is the lowest of any industry, at 5.56%.
- Only 43% of shops use digital inspection sheets.
- Just 47% use online appointment and scheduling.
- 51% of shop owners report EV service equipment in place.
- Only 18% currently offer ADAS calibration.
- Google Business Profile drives the largest share of automotive calls industry-wide.
- Automotive cost-per-lead rose 5.12% year over year in 2026.
- All-industry average CTR is 6.64% against auto repair's 5.56%.
The baseline problem: half of shops fly blind
AutoLeap's benchmark survey report of auto repair shop owners and managers across North America found only 51% actively track KPIs at all, and the gap is size-linked: shops with $1 million or more in revenue track KPIs at a materially higher rate than smaller shops, which the report's own commentator, shop consultant Chris Cotton, called out directly, arguing the figure "should be 100%."
That gap is the reason to evaluate tracking and analytics software as an operating decision, not a convenience feature: shops that already track KPIs skew larger and more profitable in the same survey, and the direction of causation runs at least partly from measurement to performance, not the reverse alone.
| KPI-tracking metric (AutoLeap benchmark survey) | Figure |
|---|---|
| Shops actively tracking KPIs, overall | 51% |
| Shops with $1M+ revenue tracking KPIs | 72% |
| Shops below $1M revenue tracking KPIs | 45% |
| Average admin time saved by shop software | >30% |
| Shops citing ease of use as top software criterion | Reported highest of three factors |
What the shops that do track KPIs actually watch
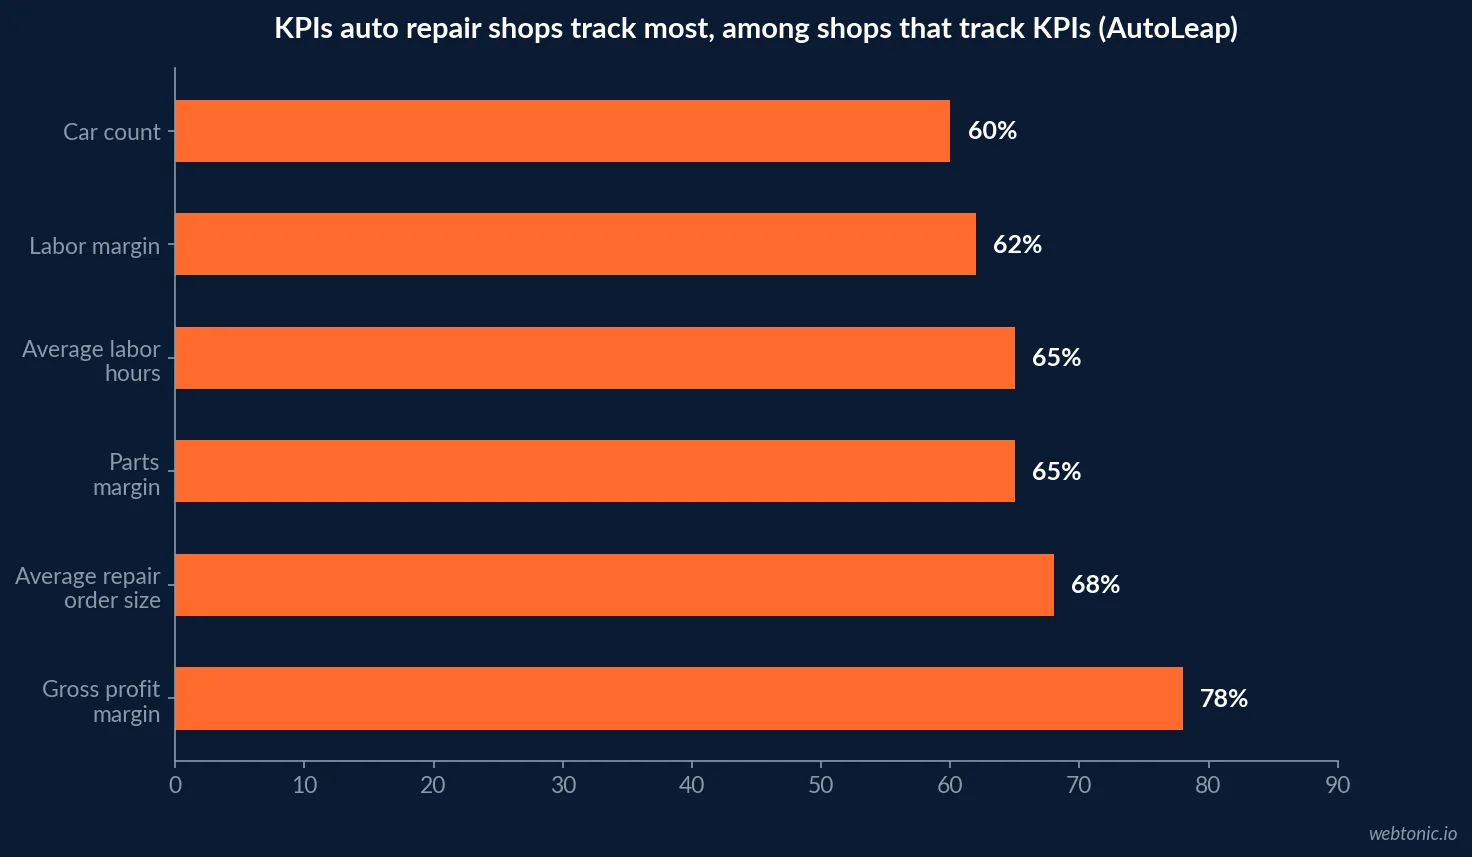
Among shops that track KPIs, AutoLeap's survey found gross profit margin is the most common metric at 78%, followed by average repair order size (68%), parts margin (65%), average labor hours (65%), labor margin (62%) and car count (60%). That list is a specification for what an analytics dashboard needs to surface on one screen before any add-on reporting is worth paying for.
Any tool evaluation should start by checking these six fields are natively available, since they are the metrics shop owners themselves rank as most useful, not a vendor's default report set.
| KPI (AutoLeap survey, shops that track KPIs) | Share tracking it |
|---|---|
| Gross profit margin | 78% |
| Average repair order size | 68% |
| Parts margin | 65% |
| Average labor hours | 65% |
| Labor margin | 62% |
| Car count | 60% |
What a lead costs before it ever reaches the shop's own tracking
WordStream's 2026 Search Advertising Benchmarks report puts Automotive Repair, Service and Parts at a $29.96 cost per lead, the second-lowest of every industry the report tracks after Arts and Entertainment, well under the $66.69 all-industry average. The reason is conversion rate, not cheap clicks: auto repair converts at 15.51% against an 8.18% all-industry average, the third-highest conversion rate of any category measured, because people search for a mechanic when the car is already broken and the click is worth more on arrival. The category's click-through rate tells the other half of the story: at 5.56%, it is the single lowest CTR of any industry in the report, against a 6.64% average, because these ads are competing on intent, not curiosity. That said, automotive repair's cost per lead still rose 5.12% year over year in the 2026 edition, one of the larger increases the report recorded.
A tracking stack that only reports a blended overall marketing cost hides this shape entirely: cheap leads driven by a hard-to-attract but high-intent click are a different problem to solve than cheap leads driven by high traffic and low conversion.
| Metric (WordStream/LocalIQ 2026 Search Advertising Benchmarks) | Automotive Repair, Service and Parts | All-industry average |
|---|---|---|
| Cost per lead | $29.96 (2nd-lowest of all industries) | $66.69 |
| Conversion rate | 15.51% (3rd-highest of all industries) | 8.18% |
| Click-through rate | 5.56% (lowest of all industries) | 6.64% |
| YoY change in cost per lead | +5.12% | Varies by industry |
Where a shop's phone leads are actually coming from
CallRail's analysis of 1.1 million leads across seven industries, automotive among them, found Google Ads, Google Business Profile and organic search as the consistent top three channels driving phone and text conversations across every industry measured, with automotive skewing toward Google Business Profile calls more heavily than most other verticals in the sample. Any analytics setup for a repair shop needs call tracking on all three, or a large share of lead volume simply reports as "direct" with no channel attached.
Missed calls compound the problem: CallRail's broader dataset shows missed-call rates reaching 32% in some tracked industries, and a missed call with no automated follow-up is a lead that disappears from every report a shop looks at.
| Lead-tracking gap | What it hides | Fix |
|---|---|---|
| No call tracking on Google Business Profile | Largest automotive call channel goes uncredited | Location-level tracking number |
| Blended shop-wide cost per lead | Sub-service spread of $35-$54 per lead is invisible | Track cost per lead by service line |
| No missed-call flag | Up to 32% of calls can vanish with no record | Automated missed-call text-back |
| No KPI dashboard for non-financial metrics | Only 51% of shops track KPIs at all today | Native six-KPI dashboard (see above) |
The technology gaps still open in most shops
The 2026 Ratchet+Wrench/AutoZone Technology Adoption report, surveying 300 shop owners and service managers, found only 43% of shops use digital inspection sheets despite documented gains in repair approvals and customer trust, and just 47% use online appointment and scheduling systems despite high adoption of electronic customer communication elsewhere. On the newer-vehicle side, 51% of shops report having EV service equipment in place, but only 18% currently offer ADAS calibration, one of the larger gaps the report identified for shops willing to invest early.
| Technology (Ratchet+Wrench/AutoZone, 2026, n=300 shops) | Current adoption |
|---|---|
| Digital inspection sheets | 43% |
| Online appointment and scheduling | 47% |
| EV service equipment | 51% |
| ADAS calibration capability | 18% |
The staffing data a shop's analytics should also track
Tracking software is only as useful as the labor capacity behind it. TechForce Foundation's 2026 workforce report, drawn from federal IPEDS and BLS data, finds automotive technician supply meeting only 42% of demand nationally, with 241,842 annual openings against 101,743 completions across ten skilled-trade sectors, and auto-specific student completions down 34% from their 2012 peak. A shop dashboard that tracks car count and labor hours but not technician capacity against booked work is missing the constraint that actually caps revenue in a tight labor market.
The Ratchet+Wrench/AutoZone report covering the same 300-shop sample also found shop owners weighing new equipment investment against this same labor reality: EV and ADAS service equipment sit at 51% and 18% adoption respectively, decisions that a tracking system should log alongside revenue per bay, not treat as a one-time setup note.
Local search context for the leads a shop tracks
BrightLocal's 2026 Local Consumer Review Survey found consumers now checking an average of six review platforms before choosing a business, with Google's share of review traffic slipping from 83% in 2025 to 71% in 2026 as Apple Maps usage nearly doubled from 14% to 27%. A shop that tracks Google reviews alone, without the other platforms customers are actually checking, is missing roughly three in ten review-driven touchpoints before a lead ever calls.
The demand curve behind these numbers
The Auto Care Association's 2026 Factbook and Lang Annual reports the average age of light-duty vehicles in operation has reached a record 12.9 years, with the U.S. light-duty vehicle parc projected to exceed 301 million vehicles by 2029, up nearly 10 million from 2025 levels, and total auto care industry revenue projected to reach $676.5 billion by 2029, growing 5.4% in 2026. An aging, growing vehicle population is the demand curve behind every lead a shop's tracking system counts; it is also the reason the 58% technician supply gap described above is a capacity constraint that compounds over time rather than a one-year staffing problem.
An evaluation checklist for tracking and analytics software
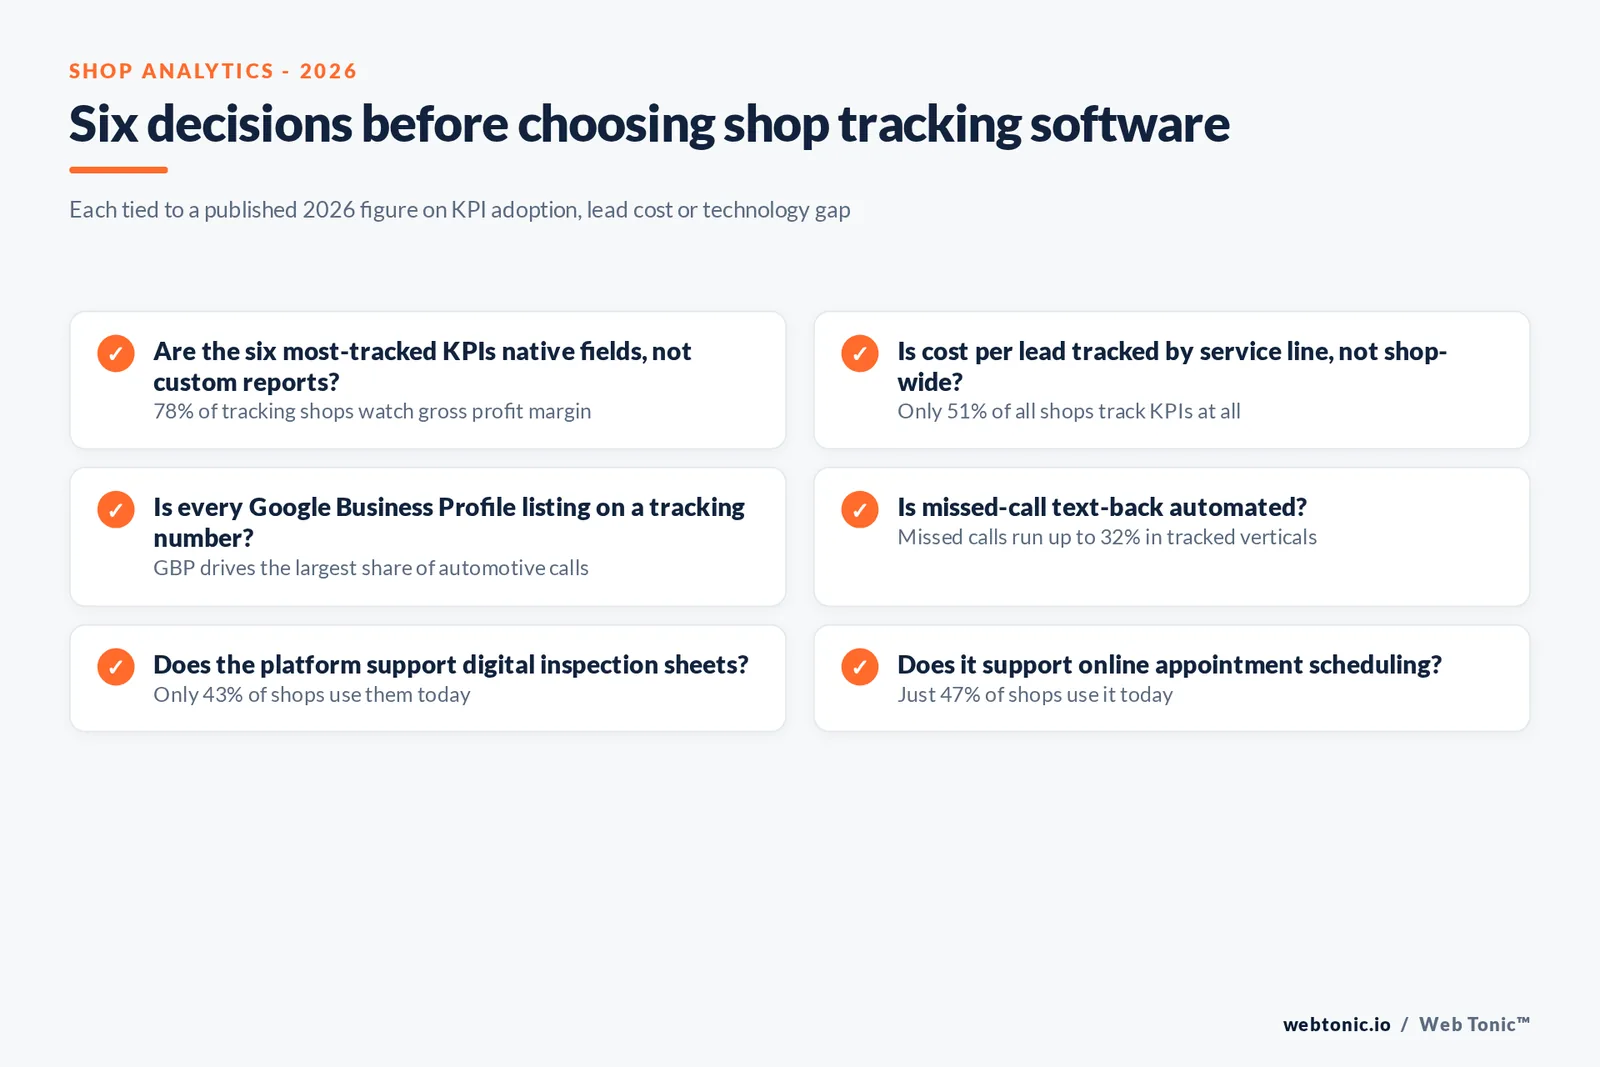
- Confirm the six most-tracked KPIs (gross profit margin, repair order size, parts margin, labor hours, labor margin, car count) are native, one-screen fields, not custom reports.
- Require call tracking on Google Ads, Google Business Profile and organic search separately; blending them hides the channel driving the most automotive calls.
- Track cost per lead by service line, not shop-wide; the spread between sub-services runs $35 to $54 per lead in the published 2026 data.
- Add missed-call text-back before adding ad spend; missed calls can run as high as 32% without it.
- Check whether the platform supports digital inspection sheets and online scheduling if the shop has not adopted them yet - both remain under 50% adoption industry-wide.
Our data and analytics practice builds this kind of shop-level dashboard, and our guide to Google Ads pricing covers the paid-search side of the funnel this page's cost-per-lead figures come from. If your current system cannot answer "what did our last 20 leads actually cost by service line," talk to us.
Frequently Asked Questions
What share of auto repair shops actually track their KPIs?
Just 51% overall, per AutoLeap's benchmark survey report of North American shop owners and managers, and the gap is size-linked: shops with $1 million or more in revenue track KPIs at meaningfully higher rates than shops below that threshold. Chris Cotton, quoted in the same report, called the 51% figure itself surprising low, arguing it should be closer to 100%.
What KPIs do the shops that track them actually watch?
Financial and labor metrics dominate: gross profit margin (78%), average repair order size (68%), parts margin (65%), average labor hours (65%) and labor margin (62%), per AutoLeap's survey. A tracking or analytics tool that cannot surface those five numbers on one screen is missing what shop owners themselves say matters most.
Does shop management software actually save time, or is that a vendor claim?
AutoLeap's own survey respondents report it does: shop management software saved an average of more than 30% of time spent on administrative tasks, and owners cited ease of use, price and range of functionality as the three features that mattered most when choosing a system. That is self-reported by users, not a vendor's marketing figure, though it comes from a vendor-sponsored survey and should be read that way.
What does a Google Ads lead actually cost an auto repair shop in 2026?
Less than almost any other local-service category on the lead side, even though clicks are cheap to earn but hard to attract. WordStream's 2026 Search Advertising Benchmarks report puts Automotive Repair, Service and Parts at $29.96 cost per lead, the second-lowest of every industry it tracks, against an all-industry average of $66.69, because the category converts at 15.51% against an 8.18% all-industry average. The same category posts the single lowest click-through rate of any industry in the report, 5.56% against a 6.64% average, so cost efficiency comes from what happens after the click, not the click itself.
What technology gaps show up most in shop-level analytics right now?
Customer-facing digital workflow tools lag well behind demand: only 43% of shops use digital inspection sheets and only 47% use online appointment and scheduling systems, per the 2026 Ratchet+Wrench/AutoZone Technology Adoption report, even though both are documented to increase repair approvals and reduce missed bookings when tracked and used consistently.
Sources
AutoLeap - State of the Auto Repair Industry Benchmark Survey
WordStream/LocalIQ - Search Advertising Benchmarks by Industry, 2026
CallRail - From Conversations to Conversions, 2026
Ratchet+Wrench/AutoZone - Technology Adoption Within Automotive Repair Shops, 2026
Ratchet and Wrench - State of the Market Report coverage
TechForce Foundation - Supply, Demand & Opportunity: 2026 Technician Workforce Report
BrightLocal - 2026 Local Consumer Review Survey, via AutomotiveSEO
Auto Care Association - 2026 Auto Care Factbook and Lang Annual


