Table of contents
App store optimization statistics for 2026 split into three layers that get blended into one misleading average far too often: how users discover apps, how they convert once they land on a listing, and what it costs to acquire them. Search still drives 65-70% of App Store downloads, but conversion rate alone swings from about 3% in Games to over 100% in Navigation depending on category.
Key Takeaways
- 65-70% of App Store downloads begin with a search.
- Google Play sees roughly 60% of installs driven by search.
- US product-page conversion sits at about 25% on iOS.
- Google Play page-view conversion runs around 27.3%.
- Global impression-to-install lands at 3.6% to 3.8%.
- Games convert at just 3-5%, the lowest category band.
- Navigation apps show ~115% conversion due to redownloads.
- Screenshots and video preview add roughly +30% conversion.
- Title keyword optimization adds about +25%.
- Ratings above 4.5 stars add roughly +22%.
- App icon redesign adds about +18%.
- Average iOS cost per install is USD 2.24 worldwide.
- Average Android cost per install is USD 1.12 worldwide.
- Apple Search Ads CPI averages USD 2.88 in North America.
- 79% of users read at least one review before downloading.
- Localizing in 10+ languages lifted downloads by an average of 128%.
- A/B testing store listings delivers a 17-26% conversion uplift.
Discovery still runs through search
Between 65% and 70% of App Store downloads begin with a search query, and Google Play sees roughly 60% of installs driven by search, per Searchlab's compiled 2026 data sourced from Apple and Sensor Tower. Apple's own 2025 App Store Transparency Report puts weekly App Store visitors at roughly 892.7 million, with 463.6 million accounts searching the store every week, per AppDrift's sourced benchmark page. Visitors are not downloads, and search visits are not organic installs - but the scale of search-driven discovery is the reason keyword work still outranks almost every other ASO lever on leverage per hour spent.
Conversion rate is a family of metrics, not one number
ScreenFast's 2026 benchmark review makes the distinction explicit: impression to product page (tap-through), impression to install (the one-step global rate, 3.6% to 3.8% per Adapty), and product page to install (the most commonly quoted "conversion rate," about 25% on iOS and 27.3% on Google Play per AppTweak's H1 2024 baseline) are three different funnel stages routinely quoted as if they were interchangeable. When a developer says their conversion rate is 6%, they usually mean product-page conversion; when they say 0.3%, they usually mean impression-to-install, which makes an ordinary number sound like a crisis.
| Metric | iOS benchmark | Google Play | Source |
|---|---|---|---|
| Product page conversion (page view to install) | 25% | 27.3% | AppTweak, H1 2024 baseline |
| Impression to install (global) | 3.6-3.8% | n/a | Adapty 2026 |
| Cross-store methodology | 24% | 13% | SplitMetrics via Promodo |
| Install to in-app purchase, Retail | 1.38% | 1.38% | UXCam |
| Install to in-app purchase, Travel | 2.41% | 2.41% | UXCam |
| Download-to-trial (subscription apps) | 3.7-8.9% | n/a | Adapty 2026 |
Conversion rate by category swings by more than 30x
Apple's own App Store Connect Benchmarks tab compares an app against its category peer group rather than a cross-industry average, and the category spread explains why: Navigation apps show roughly 115% conversion (heavily inflated by device-wipe redownloads), Weather sits at 79.8%, Reference at 67.2% and Business at 66.7%, while Games cluster at just 3-5% and Entertainment at 3.2%, the lowest band AppTweak tracks. Comparing a games app against the Business category average would make an entirely healthy listing look like it was failing.
| Category (iOS) | Conversion rate band, 2026 | Note |
|---|---|---|
| Navigation | ~115% | Heavily inflated by redownloads after device wipes |
| Weather | 79.8% | Same redownload effect, smaller magnitude |
| Reference | 67.2% | High-intent users, narrow product pages convert hard |
| Business | 66.7% | Dictionaries, file scanners, productivity utilities |
| Productivity | 25% | Wide spread between utility-style and SaaS-style apps |
| Finance | 5-8% | Trust-driven category, slower decision |
| Health & Fitness | 4-7% | Subscription-heavy, promise must feel achievable |
| Games (overall) | 3-5% | Lowest CVR band across all categories |
| Entertainment | 3.2% | Crowded and largely undifferentiated |
What actually moves the conversion needle
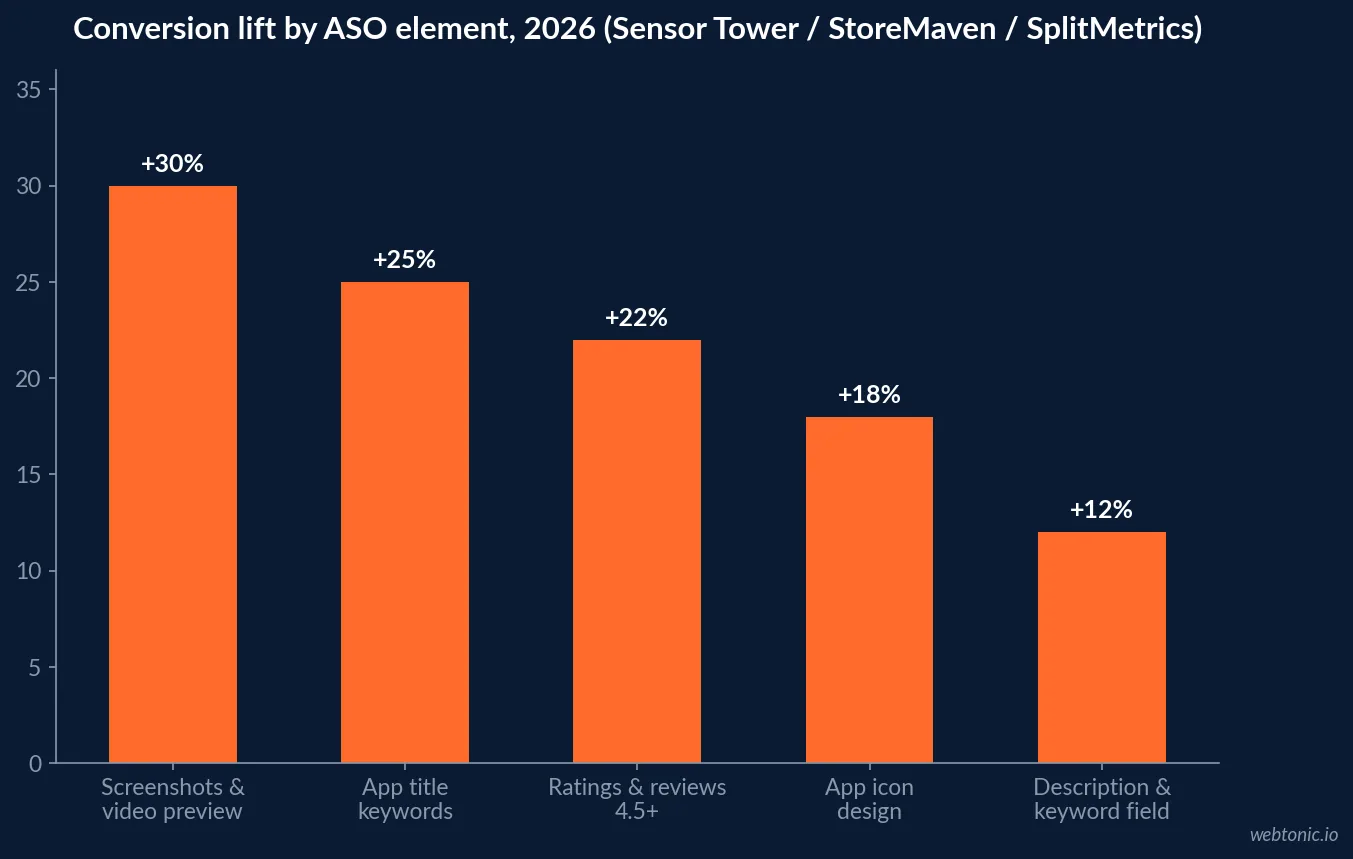
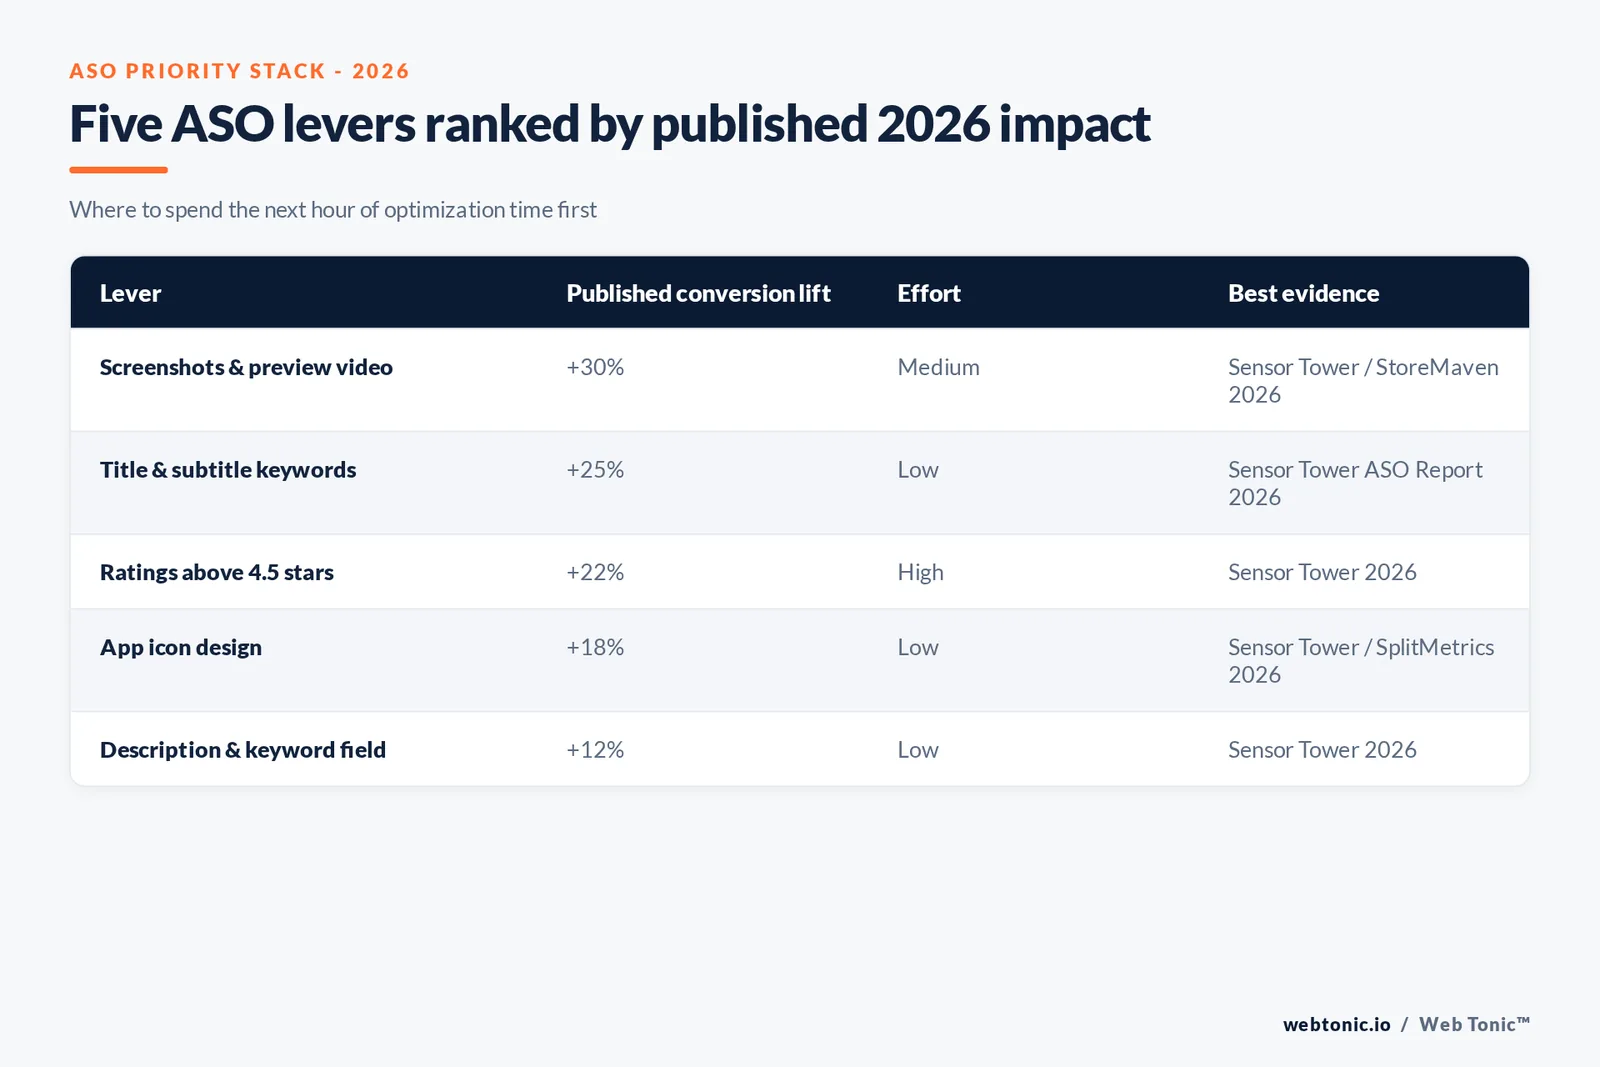
Sensor Tower, StoreMaven and SplitMetrics' pooled 2026 data ranks five creative and metadata levers by measured conversion lift: screenshots and video preview lead at roughly +30%, followed by title keyword optimization at +25%, ratings and reviews above 4.5 stars at +22%, app icon design at +18% and the description and keyword field at +12%. Apps with a video preview convert 23% higher than apps without one, and structured A/B testing of store listings delivers an average 17-26% conversion uplift per Google Play Console experiment data.
Reviews matter earlier in the funnel than most teams assume: 79% of users read at least one review before downloading, and a jump from a 3-star to a 4-star average rating is associated with a documented +340% revenue increase in AppDrift's sourced benchmark set.
| ASO element | Measured conversion lift, 2026 | Effort to implement |
|---|---|---|
| Screenshots & video preview | +30% | Medium - requires new creative assets |
| Title & subtitle keywords | +25% | Low - metadata change only |
| Ratings & reviews above 4.5 | +22% | High - requires product and support work |
| App icon design | +18% | Low - a single asset swap |
| Description & keyword field | +12% | Low - metadata change only |
What it costs to acquire the install
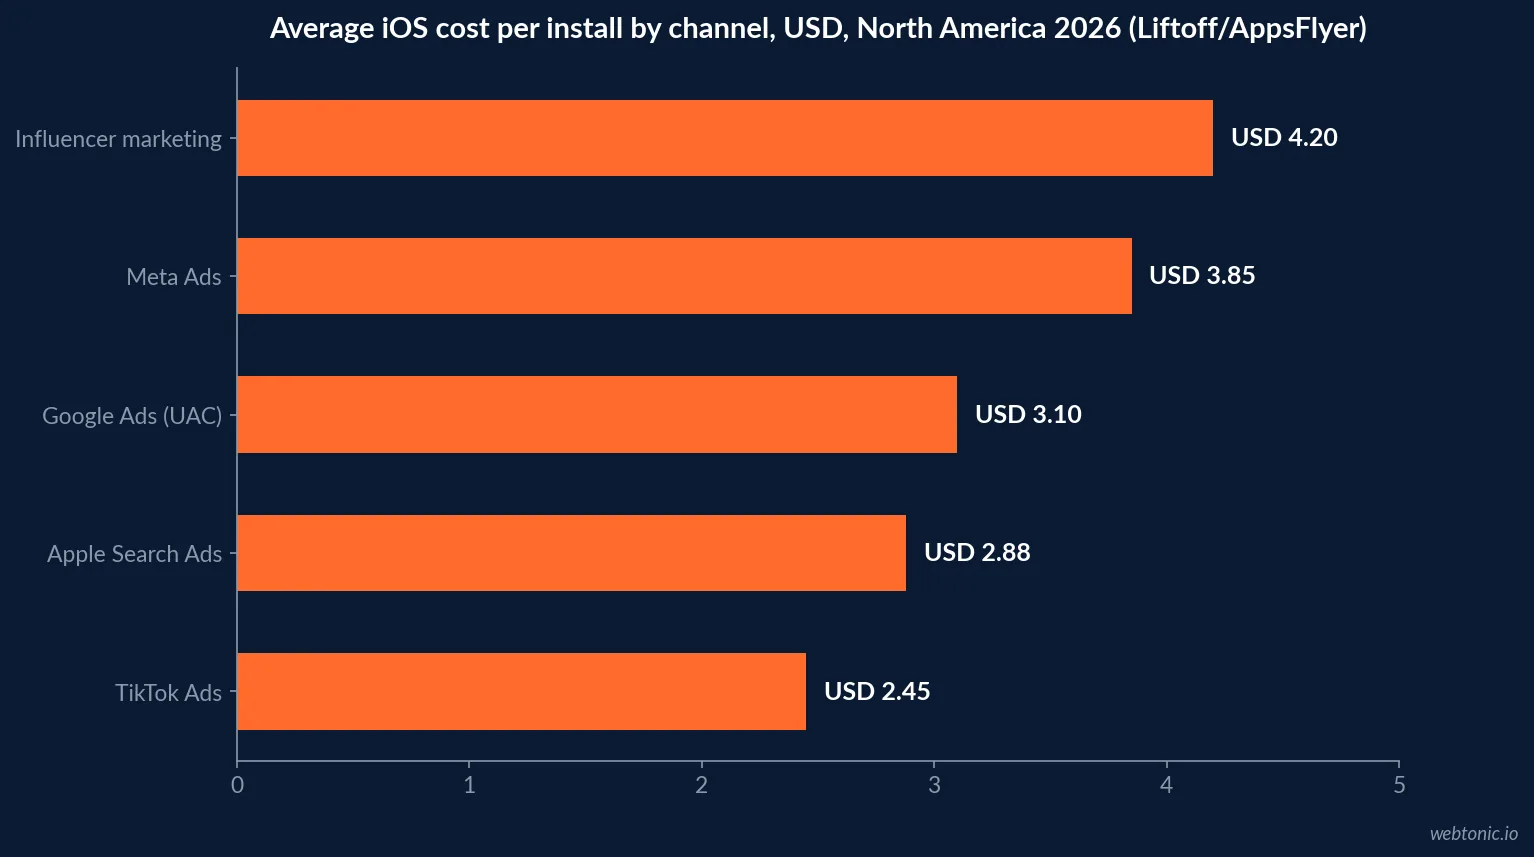
Average cost per install runs about USD 2.24 on iOS worldwide and USD 1.12 on Android, roughly double on iOS due to Apple's ATT framework and higher average user value, per Adjust's 2026 Global App Trends data. By channel in North America, Apple Search Ads averages USD 2.88, Google Ads (UAC) USD 3.10, Meta Ads USD 3.85, TikTok Ads USD 2.45 and influencer marketing USD 4.20. Retargeting lowers CPA by 38% compared with prospecting campaigns, and fintech apps carry the highest acquisition cost of any category at roughly USD 5.80 iOS CPI.
| Channel | Avg. iOS CPI, North America 2026 | YoY trend |
|---|---|---|
| Apple Search Ads | USD 2.88 | +8% |
| Google Ads (UAC) | USD 3.10 | +12% |
| Meta Ads (Facebook/Instagram) | USD 3.85 | +15% |
| TikTok Ads | USD 2.45 | -5% |
| Influencer marketing | USD 4.20 | +3% |
App Store versus Google Play: same job, different mechanics
The two stores reward slightly different work. Apple's ranking algorithm weighs the dedicated 100-byte keyword field heavily, so title, subtitle and keyword field optimization compound directly - Apple Search Ads reports an average conversion rate of 50% for branded keywords and 30% for generic keywords. Google Play has no separate keyword field; its algorithm reads the title, short description and full description as running text, which rewards natural keyword density inside readable copy over the more mechanical field-stuffing that iOS listings can get away with. A/B testing is native to Google Play Console Experiments and delivers a documented 17-26% conversion uplift, while iOS teams typically need a third-party tool to run the equivalent test.
Store choice also changes what "search-driven" means in practice: Apple's own data puts search-driven downloads at roughly 70% against Google's 60%, so an app skewed toward Android users should weight browse and category placement work slightly higher relative to keyword optimization than an iOS-first app would.
| Mechanic | App Store (iOS) | Google Play | Practical implication |
|---|---|---|---|
| Dedicated keyword field | Yes, 100 bytes, hidden from users | No - keywords must live in visible copy | iOS rewards field-stuffing; Android rewards natural copy |
| Search-driven downloads | ~70% | ~60% | iOS teams should prioritize keyword work slightly higher |
| Native A/B testing | Requires third-party tool | Built into Play Console Experiments | Android testing has a lower setup cost |
| Apple Search Ads branded-keyword conversion | 50% | n/a | Branded search ads convert far above generic terms |
| Apple Search Ads generic-keyword conversion | 30% | n/a | Still well above typical organic browse conversion |
What a real 90-day ASO run looks like
Documented case studies give the abstract lifts above a concrete shape. One 90-day, zero-paid- spend ASO campaign took a fitness app from roughly 500 plateaued daily downloads to about 850 daily downloads after a keyword overhaul and visual refresh alone, then added international localization for five markets and saw international downloads surge 120% - Japan alone went from 30 to 180 daily downloads once native keyword research replaced direct translation. The combined campaign is reported as a 300% organic download increase in 90 days. A separate campaign pairing ASO with Apple Search Ads reported a 387% download increase.
Neither result required a product change - both came entirely from metadata, creative and localization work on an existing listing.
| Case study | Timeframe | Reported result | Levers used |
|---|---|---|---|
| FitFlow (fitness app) | 90 days | +300% organic downloads | Keywords, screenshots, localization |
| Mobile security app (Strataigize) | Not disclosed | +387% downloads | ASO combined with Apple Search Ads |
A 2026 ASO checklist
Start with keyword research against mid-tail, beatable terms rather than broad, ultra- competitive ones - the highest-leverage, lowest-cost step available. Rebuild the first three screenshots around the strongest value proposition, since most users never scroll past them. Add a short preview video if the category supports one. Then localize for the top markets by existing traffic share using native keyword research, not machine translation, before spending on paid acquisition. Finally, compare every conversion number against your own category benchmark, not a cross-industry average - the two can differ by more than 30x.
Our performance creative team applies the same screenshot-and-hook testing discipline to paid social creative that ASO case studies apply to store listings, and if paid acquisition is already carrying most of your install volume, our guide to what Facebook Ads actually cost is a useful cross-check on blended CPI, and our growth marketing practice treats ASO and paid acquisition as one funnel rather than two separate budgets competing for the same install.
Frequently Asked Questions
What percentage of app downloads come from search?
Between 65% and 70% on the App Store, and roughly 60% on Google Play, according to Apple and Sensor Tower's 2026 data. That makes keyword optimization the single highest-leverage lever most developers can pull, because a listing that does not rank in the top few results for its core terms is effectively invisible regardless of how good the app itself is.
What is a good App Store conversion rate in 2026?
There is no single number, and quoting one is the most common ASO mistake. AppTweak's baseline puts US product-page conversion (page view to install) at roughly 25% on iOS and 27.3% on Google Play, but category bands swing from about 3-5% in Games and 3.2% in Entertainment up to 66-80% in Business, Reference and Weather, categories inflated by redownload behavior. Always compare your number against your own category, using Apple's App Store Connect Benchmarks tab, not a cross-industry average.
Which ASO element moves conversion the most?
Screenshots and preview video carry the largest single measured lift at roughly +30%, ahead of title keyword optimization at +25%, ratings and reviews above 4.5 stars at +22%, app icon design at +18% and the description and keyword field at +12%, per Sensor Tower, StoreMaven and SplitMetrics 2026 data. Screenshots are also the cheapest fix: most listings can redesign their first three screenshots in a day, and users rarely scroll past that point.
How much does it cost to acquire an app user in 2026?
Average cost per install runs about USD 2.24 on iOS worldwide and USD 1.12 on Android, roughly double on iOS because of Apple's ATT framework and higher average user value, per Adjust's 2026 data. By channel in North America, Apple Search Ads averages USD 2.88, Google Ads (UAC) USD 3.10, Meta Ads USD 3.85, TikTok Ads USD 2.45 and influencer marketing USD 4.20 - so channel mix matters as much as creative quality for blended CPI.
Does localization actually increase downloads?
Case-study evidence says yes, substantially. One documented 90-day ASO campaign localized a listing for five markets and saw international downloads surge 120%, with Japan going from 30 to 180 daily downloads after native (not machine-translated) keyword research replaced direct translations that had returned zero search volume. Treat literal translation and true localization as different projects with very different returns.
Sources
AppDrift - ASO Statistics & Benchmarks 2026
ScreenFast - App Store Conversion Rate Benchmarks by Category, 2026
Searchlab - App Marketing & ASO Statistics 2026
AppFollow - App Store Optimization Metrics: 2026 ASO Tracking Guide
Digital Applied - App Store Optimization (ASO) Statistics 2026
BoostYourApp - How We Increased App Downloads 300% with ASO
Strataigize - How We Increased App Downloads with ASO and ASA by 387%
SEM Nexus - App Store Conversion Funnel: Impression to Install Benchmarks 2026