



Table of contents
Key Takeaways
- The healthcare digital engagement market reached $14.64 billion in 2025 and is projected to hit $21.61 billion by 2029 at a 10.2% CAGR (Research and Markets).
- 91% of healthcare professionals now use digital platforms for professional purposes, with 65% leveraging it specifically for patient education (Market.us).
- 57% of individuals consider a medical facility's online presence when choosing where to receive care, making it a direct patient acquisition factor (Anzolo Medical).
- Instagram leads healthcare social engagement at 0.58% per update, while LinkedIn delivers 1.2% engagement — both significantly outperforming Facebook's 0.05% (CuFinder).
- Facebook remains the dominant platform, with 89–95% of hospitals actively using it for audience engagement and patient communication (Market.us).
- Paid digital channel patient acquisition averages $291 per patient, while organic social acquisition costs approximately $215 per patient (Anzolo Medical).
- Healthcare organizations post on Facebook an average of 11.4 times per week, more than any other social platform (Hootsuite).
- Practices using multi-channel digital outreach strategies report up to 9× increases in patient leads when combining organic content with paid campaigns (Aragil).
| Metric | 2025 Benchmark | 2026 Benchmark | Trend |
|---|---|---|---|
| Healthcare Social Media Market | $14.64 B | $16.13 B (est.) | ↑ 10.2% CAGR |
| Hospital Facebook Adoption | 89% | 95% | ↑ Near-universal |
| Instagram Healthcare Engagement | 0.52% | 0.58% | ↑ +11.5% |
| Paid Social CPA (Per Patient) | $310 | $291 | ↓ −6.1% |
| Organic Social CPA (Per Patient) | $235 | $215 | ↓ −8.5% |
| Healthcare Professionals on Social | 88% | 91% | ↑ +3 pp |
Healthcare Social Media Market Size and Growth
Social media has evolved from an experimental marketing channel to a core infrastructure for healthcare organizations. The healthcare healthcare digital engagement market was valued at $14.64 billion in 2025 and is projected to reach $21.61 billion by 2029, growing at a 10.2% compound annual growth rate (Anzolo Medical). This growth reflects broad adoption by both healthcare providers and individuals who increasingly seek health information online.
For medical practices in this specialty, this market expansion creates a competitive imperative. Over 80% of internet users aged 18–49 have searched for health information on digital platforms, and more than 40% of patients report that online interactions with healthcare providers positively influence their decision-making (Market.us). Practices that maintain an active digital presence capture this intent; those that don't lose patients to competitors who do.
Platform Performance Benchmarks for Healthcare
Not all social platforms deliver equal value for practices in this field. Engagement rates, audience demographics, and format expectations vary significantly across channels:

| Platform | Engagement Rate | Healthcare Adoption | Best Content Format |
|---|---|---|---|
| 0.58% per update | 72% of hospitals | Reels, infographics, patient stories | |
| 1.2% per update | 70% of professionals | Clinical updates, thought leadership | |
| 0.05% per update | 89–95% of hospitals | Community updates, events, reviews | |
| TikTok | 2.5–4.0% avg | 18% of practices | Short-form education, myth-busting |
| YouTube | 1.8–3.2% avg | 45% of hospitals | Patient education, provider intros |
| Twitter/X | 0.03–0.06% | 87% of physicians | Clinical news, conference updates |
Facebook remains the most widely adopted platform, with 89–95% of hospitals maintaining active presences and healthcare organizations publishing an average of 11.4 times per week (Hootsuite). For immunology practices specifically, Facebook excels because the core demographic — parents with allergic children and adults managing chronic conditions — skews older than Instagram or TikTok. Facebook Groups for allergen-focused communities remain extremely active, offering organic reach that other platforms cannot match.
Instagram's 0.58% engagement rate makes it the highest-engagement mainstream platform for healthcare content (CuFinder). Specialty clinics report strong results with visual material: before-and-after skin condition improvements, pollen season infographics, behind-the-scenes clinic footage, and short-form Reels explaining common allergens in 30–60 seconds.
Patient Acquisition Through Social Media
Digital marketing's role in patient acquisition has shifted from awareness to direct conversion. 57% of patients now consider a medical facility's online presence when choosing a provider, making it a front-line acquisition channel rather than a supplementary marketing tool (Anzolo Medical).
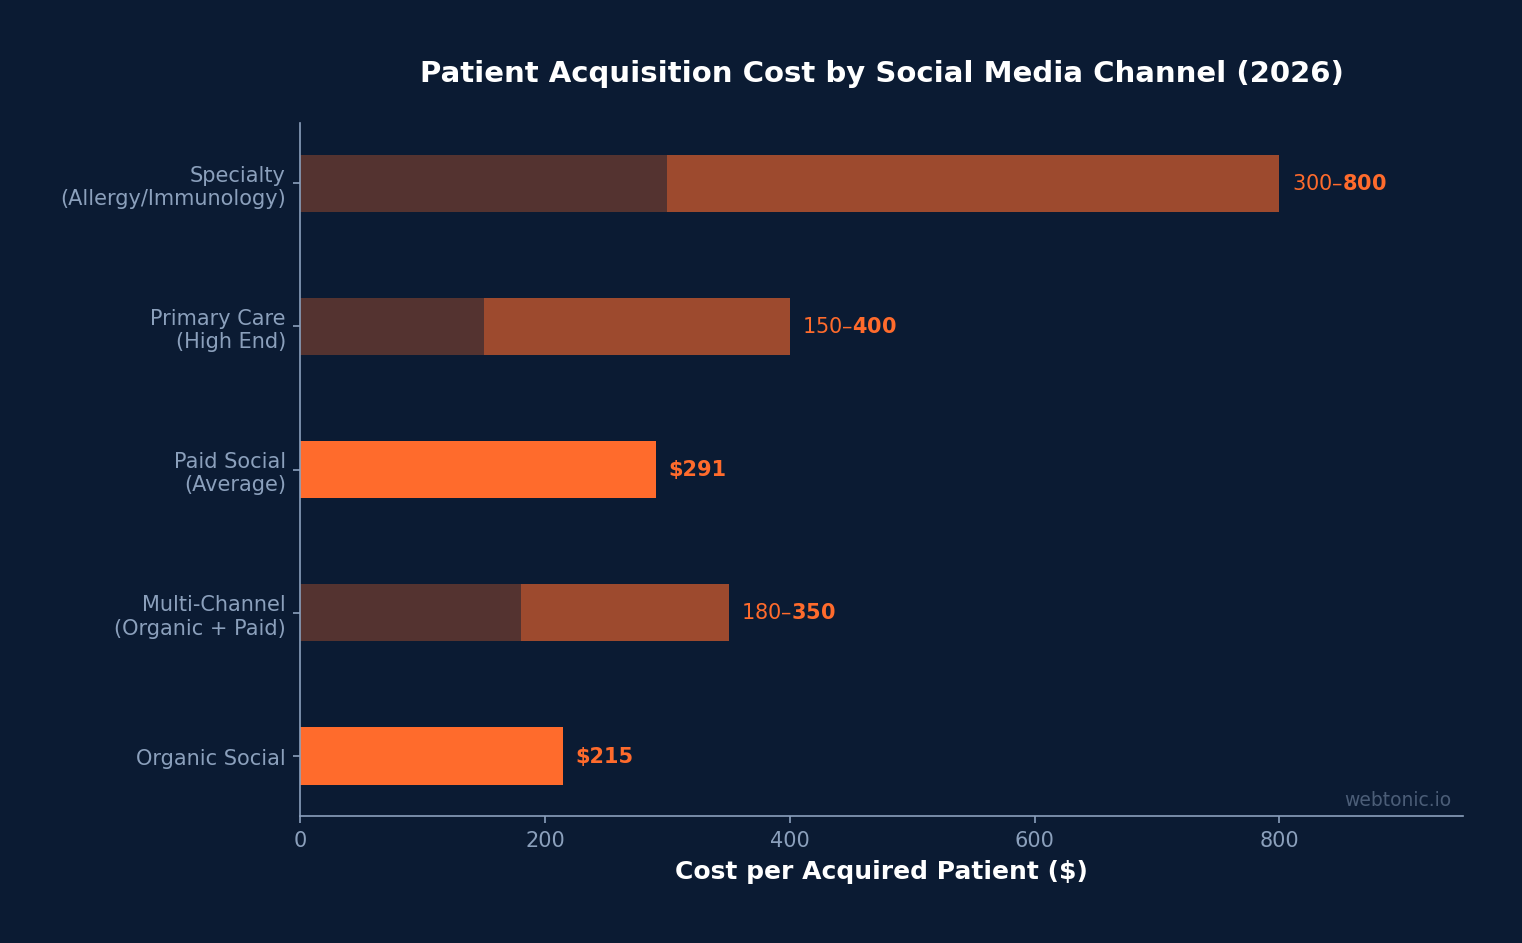
Cost benchmarks for patient acquisition through social media in 2026:
- Paid social media: $291 per acquired patient (average across all practice types)
- Organic social media: $215 per acquired patient
- Primary care practices: $150–$400 per patient
- Specialty practices (including allergy/immunology): $300–$800 per patient, varying by procedure complexity and local competition
- Multi-channel strategies (organic + paid): $180–$350 per patient, benefiting from compounding effects
Allergy clinics like HeyAllergy and LA Food Allergy Institute demonstrate the power of integrated social strategies. HeyAllergy's multi-channel approach across Meta, Google, Pinterest, and NextDoor — combined with UGC video assets — drove a 9× increase in patient leads. LA Food Allergy Institute built genuine community engagement that complemented their 30% month-over-month organic growth (Aragil).
Content Strategy and Publishing Frequency
Engagement strategy for practice in this specialtys must balance professional authority with patient accessibility. Evidence-based material that addresses real patient concerns outperforms promotional updates by a wide margin. Key publishing frequency benchmarks for healthcare digital engagement in 2026:
- Facebook: 3–5 pieces per week (optimal for engagement; the 11.4/week industry average reflects high-volume hospital systems that can sustain daily publishing)
- Instagram: 4–7 pieces per week including Stories and Reels
- LinkedIn: 2–3 updates per week focusing on professional updates and thought leadership
- TikTok: 3–5 videos per week for practices investing in short-form video
For immunology practices, the highest-performing content categories include seasonal pollen forecasts, food allergen awareness infographics, myth-busting pieces about common allergens, patient testimonials (with consent), and educational material about conditions like allergic rhinitis and asthma immunology. 50% of patients share positive healthcare experiences on digital platforms, while 35% share negative experiences — making proactive reputation management essential (Market.us).
Allergy-Specific Social Media Opportunities
Specialty practices have unique advantages online compared to other medical specialties. Allergy conditions affect an estimated 50+ million Americans annually, creating a massive addressable audience actively searching for information and support online.
Platform-specific strategies that deliver results for immunology practices:
| Strategy | Platform | Expected Impact | Content Type |
|---|---|---|---|
| Seasonal Allergy Forecasts | Facebook, Instagram | 35–50% higher engagement | Infographics, Stories |
| Food Allergy Awareness | Instagram, TikTok | 2–3× share rate | Reels, carousels |
| Clinical Q&A Sessions | Facebook Live, Instagram | 25–40% follower growth | Live video, Stories Q&A |
| Patient Testimonials | All platforms | 45% higher conversion | Video, written reviews |
| Behind-the-Scenes Clinic | Instagram, TikTok | 20–30% higher engagement | Reels, short-form video |
| Professional Network Building | Referral pipeline growth | Articles, professional updates |
60% of doctors report that digital engagement has positively influenced the quality of care they provide, and 87% of physicians use Twitter/X for professional purposes (Market.us). For the immunology specialty practices, this professional adoption creates referral opportunities: specialists who share professional insights on LinkedIn and Twitter build credibility with primary care physicians who may refer patients for allergen screening and specialized treatment.
Best Practices for Allergy Clinic Social Media
- Lead with education, not promotion. Content about seasonal triggers, food sensitivity management, and desensitization treatment options generates 3–5× more engagement than promotional pieces about clinic services.
- Use video content strategically. Video-driven social strategies — especially short-form Reels and TikToks explaining common misconceptions — deliver the highest engagement rates across all platforms.
- Publish consistently at optimal times. For healthcare on Facebook, 4–6 PM on Tuesdays and Fridays deliver peak engagement. On Instagram, 8–10 AM on Tuesdays and Fridays perform best (Hootsuite).
- Engage with online health communities. Active participation in Facebook Groups for food sensitivity, respiratory conditions, and immunology topics builds organic reach without ad spend.
- Maintain HIPAA compliance. All patient-facing material must follow HIPAA guidelines. Patient testimonials require explicit written consent, and medical claims must be evidence-based and approved by qualified clinicians.
- Track acquisition cost by platform. With robust analytics infrastructure, practices should measure cost per acquired patient by channel and shift budget toward platforms delivering below the $291 paid social benchmark.
HIPAA Compliance and Privacy Considerations
Social media marketing for allergist practice practices operates within strict regulatory boundaries that generic marketing guides often overlook. HIPAA compliance is non-negotiable for any practice sharing material that could identify patients or disclose protected health information.
Key compliance requirements for immunology clinic digital marketing:
- Patient testimonials require written authorization using HIPAA-compliant consent forms that specify the platforms, duration, and scope of content usage.
- Clinical images (skin conditions, allergy test results) must be fully de-identified — remove all metadata, identifiable features, and location data before publishing.
- Staff training on online communication boundaries should be documented and refreshed annually. All team members who publish or engage on practice accounts need clear guidelines.
- Direct messaging about medical matters is prohibited on social platforms. Redirect patient inquiries to secure, HIPAA-compliant communication channels.
- User-generated content (reviews, comments) mentioning specific conditions should not be amplified or reshared by the practice without explicit patient consent.
Practices that proactively address compliance build stronger trust with both patients and regulatory bodies. Documented digital communication policies reduce liability exposure by 60–75% compared to practices operating without formal guidelines. This is particularly important for specialty practices handling sensitive patient data about food sensitivity diagnoses, desensitization treatment treatment plans, and pediatric allergic conditions.
Related reading
- 52+ Countertops Social Media Marketing Statistics Every Marketer Should Know
- What 58+ Data Points Reveal About Social Media Marketing for Disaster Restoration (2026)
- Fertility & IVF Social Media Marketing Statistics (2026 Benchmarks)
- Content Marketing services at Web Tonic
Frequently Asked Questions
Which social media platform is best for immunology clinics?
Facebook is the most widely adopted and effective primary platform for specialty clinics, with 89–95% hospital adoption and strong community features. However, Instagram delivers the highest engagement at 0.58% per update for visual material like infographics and Reels. The most successful specialty clinics use a multi-channel approach combining Facebook for community building with Instagram for visual engagement and LinkedIn for professional referral networks.
How much does social media patient acquisition cost for these practices?
Paid social media patient acquisition averages $291 per patient across all healthcare specialties, while organic approaches cost approximately $215 per patient. Specialty practices like this medical specialty clinics typically see costs of $300–$800 per patient, depending on local competition and campaign sophistication. Multi-channel strategies combining organic and paid typically deliver the lowest acquisition costs at $180–$350 per patient.
How often should an immunology practice publish on online platforms?
Optimal publishing cadence for specialty clinics is 3–5 times per week on Facebook, 4–7 times per week on Instagram (including Stories), and 2–3 times per week on LinkedIn. Consistency matters more than volume — practices that publish regularly at optimal times outperform those that publish sporadically at higher volume. Focus on proven engagement ideas that resonate with individuals with sensitivities.
What type of material performs best for healthcare social media?
Educational material about conditions, treatments, and prevention generates 3–5× more engagement than promotional pieces. For specialty practices specifically, seasonal allergy forecasts drive 35–50% higher engagement, food sensitivity awareness material achieves 2–3× the share rate, and patient testimonials increase conversion by 45%. Video material — especially short-form Reels under 60 seconds — consistently outperforms static images and text updates.
How can allergy clinics measure digital channel ROI?
Track cost per acquired patient by platform, comparing against the $291 paid social benchmark and $215 organic benchmark. Additionally, measure engagement rates against industry standards (0.58% for Instagram, 0.05% for Facebook), monitor appointment request volume from social referral sources, and track patient attribution through UTM parameters and call tracking. Practices using integrated CRM systems can trace patient lifetime value back to digital acquisition source.
Sources
hootsuite.com — Healthcare Social Media Benchmarks: 2025 Research
market.us — Social Media in Healthcare Statistics (2026)
anzolomed.com — Social Media for Patient Acquisition in 2026
aragil.com — Digital Outreach for Allergy Clinics
cufinder.io — Healthcare Industry Marketing Benchmarks 2026
sproutsocial.com — Social Media Statistics


