



Table of contents
An ad exchange is the auction floor, not the auction itself — it is the piece of programmatic infrastructure that lets a buyer's demand-side platform and a publisher's supply-side platform clear a price in the time it takes a webpage to load. In 2025 that auction floor processed USD 162.4 billion in ad spend, and the mix of who wins each bid keeps rotating.
Key Takeaways
- Programmatic advertising revenue hit USD 162.4 billion in 2025, up 20.5% year over year.
- That growth added USD 27.6 billion in new spend in a single year (IAB/PwC).
- The real-time bidding market itself is valued at USD 26.32 billion in 2026, up from USD 21.02 billion in 2025.
- It is forecast to reach USD 64.34 billion by 2030, a 25% compound annual growth rate.
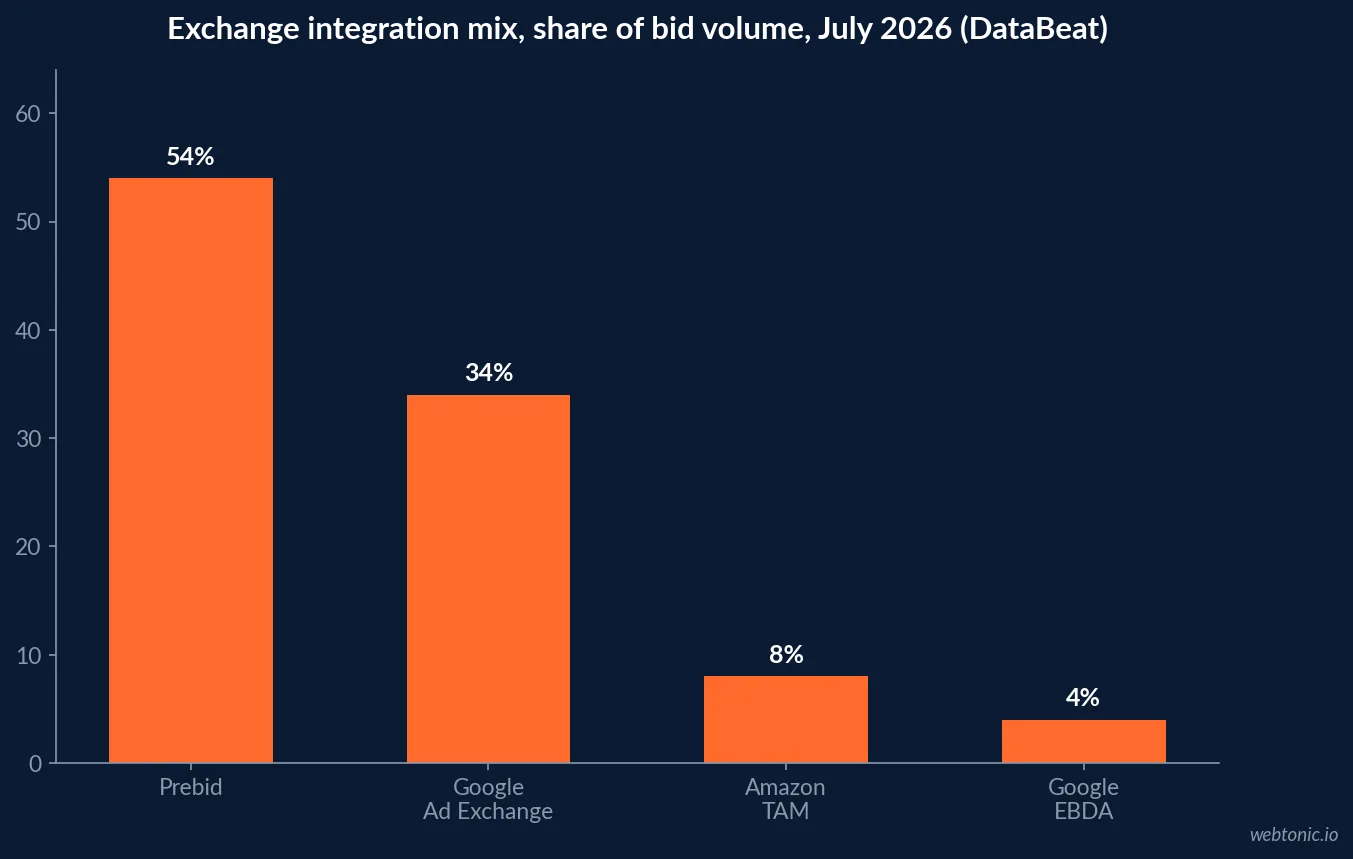
- Prebid held 54% of exchange integration mix in July 2026, per DataBeat.
- Google's Ad Exchange (AdX) held 34%, Amazon's TAM 8% and Google's EBDA 4%.
- That mix reversed from two months earlier, when AdX rose to 35% and Prebid fell to 48%.
- Prebid CPMs reached USD 1.82, up 38.0% year over year.
- Amazon's TAM CPM reached USD 2.34, up 35.5% year over year.
- Google's Ad Exchange CPM sat at USD 1.46, down 0.5% year over year.
- Mobile CPMs rose 53.5% year over year to USD 1.72.
- CTV CPMs remain down 12.3% year over year at USD 5.74 despite a 20.7% monthly bounce.
- Publishers moving from waterfall to unified auctions report 15% to 30% revenue gains.
- 64,800 net new ads.txt lines were added in July 2026 alone, per DataBeat's Sellers Report.
- 56.9% of that new supply arrived through resellers, not direct publisher relationships.
- Tier-1 SSPs carry a 46% duplicated-domain rate, letting one impression compete against itself.
- Only about 30% of web traffic is addressable via a cookie or alternative identifier.
- Roughly 50% of Chrome bid requests still carry a cookie, per AdExchanger reporting.
What an exchange actually auctions
An ad exchange connects supply-side platforms holding publisher inventory to demand-side platforms holding advertiser budget, clearing each impression through a bid in the milliseconds before a page renders. The mechanism is standardized by IAB Tech Lab's OpenRTB protocol, first built when programmatic accounted for roughly 4% of the display market in 2013. The exchange itself is now the default way most digital inventory changes hands, and the arithmetic behind it is what this page unpacks.
What buyers usually call "the exchange" is really several competing integrations sitting side by side in the same auction: an open-source header bidding wrapper, a search-engine-owned exchange, a retail-owned exchange and a browser-native auction path. Each behaves differently, and each is documented below with the same July 2026 dataset so the comparisons are apples to apples.
| Digital ad category, 2025 | Revenue | YoY growth | Share of total |
|---|---|---|---|
| Social | USD 117.7B | 32.6% | 40.0% |
| Search | USD 114.2B | 11.0% | 38.8% |
| Digital video | USD 78.0B | 25.4% | 26.5% |
| Display | USD 81.6B | 9.8% | 27.7% |
| Commerce media | USD 63.4B | 18.0% | 21.5% |
| Programmatic (cross-format) | USD 162.4B | 20.5% | — |
The real-time bidding market's growth curve
Programmatic's headline revenue number sits inside a faster-growing sub-market: real-time bidding infrastructure itself. The Business Research Company values the global RTB market at USD 21.02 billion in 2025, growing to USD 26.32 billion in 2026 at a 25.2% compound annual growth rate, and projects it will reach USD 64.34 billion by 2030 at a similar 25.0% pace as privacy-compliant identity tooling and cross-channel programmatic demand expand the addressable pool of auctionable inventory.
| RTB market milestone | Value | Growth rate | Source |
|---|---|---|---|
| 2025 market size | USD 21.02B | — | The Business Research Company |
| 2026 market size | USD 26.32B | 25.2% CAGR | The Business Research Company |
| 2030 projected size | USD 64.34B | 25.0% CAGR | The Business Research Company |
| 2025 IAB programmatic revenue | USD 162.4B | 20.5% YoY | IAB/PwC |
| New programmatic spend added in 2025 | USD 27.6B | — | IAB/PwC |
Who wins the auction changes month to month
DataBeat's July 2026 US programmatic report tracked the integration mix reversing direction inside a single quarter. In April 2026, Google's Ad Exchange (AdX) had expanded to 35% of bid volume while Prebid fell to 48% - a shift DataBeat read at the time as demand consolidating toward Google's exchange. Two months later the flow ran the other way entirely.
| Integration | July 2026 share | April 2026 share | Direction |
|---|---|---|---|
| Prebid (header bidding) | 54% | 48% | Regained share |
| Google Ad Exchange (AdX) | 34% | 35% | Slight pullback |
| Amazon TAM | 8% | — | Stable |
| Google EBDA | 4% | — | Stable |
What each integration actually pays
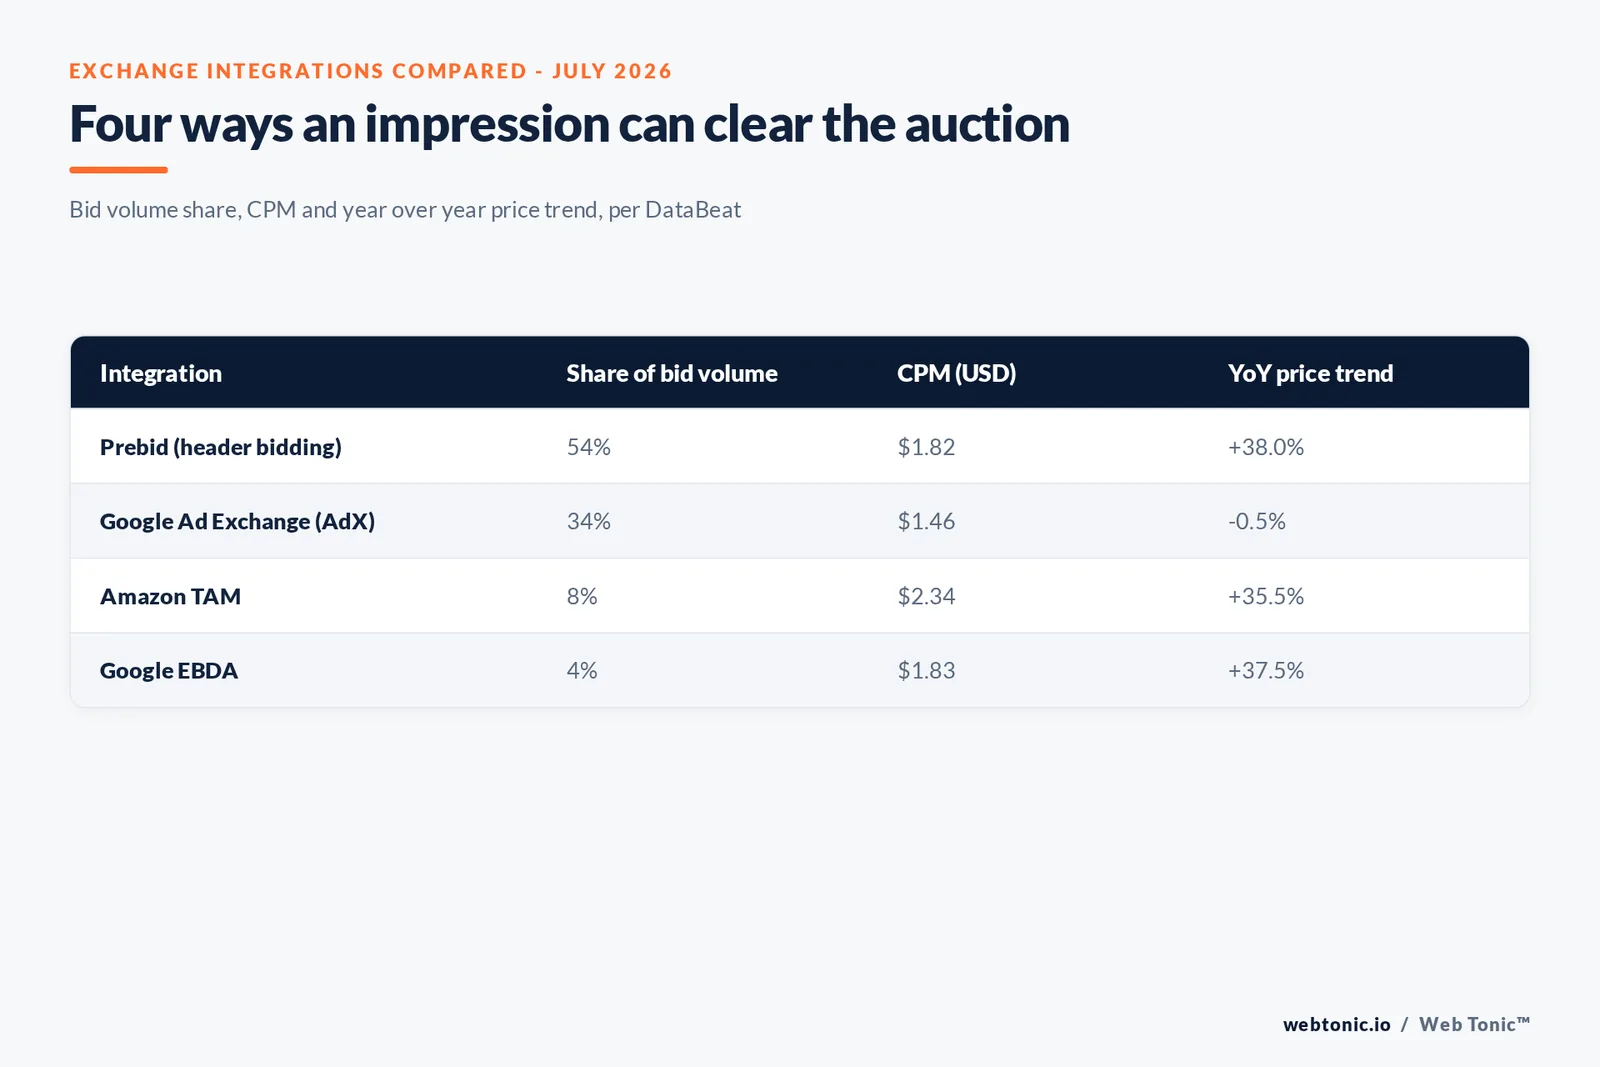
Volume share and price are two different scoreboards, and DataBeat's July 2026 figures show them diverging. Prebid CPMs reached USD 1.82, up 19.9% for the month and 38.0% year over year. Amazon's TAM reached USD 2.34, up 19.0% monthly and 35.5% annually - the highest CPM of the four. Google's EBDA reached USD 1.83, up 14.3% and 37.5%. Google's Ad Exchange reached USD 1.46, up only 6.0% for the month and essentially flat at down 0.5% year over year, even while remaining the largest single volume channel. DataBeat reads that near-flat annual line as evidence the exchange's pricing ceiling is being tested as competing integrations absorb incremental demand.
| Integration | CPM (USD) | MoM change | YoY change |
|---|---|---|---|
| Amazon TAM | $2.34 | +19.0% | +35.5% |
| Google EBDA | $1.83 | +14.3% | +37.5% |
| Prebid | $1.82 | +19.9% | +38.0% |
| Google Ad Exchange (AdX) | $1.46 | +6.0% | -0.5% |
Device pricing has nearly converged
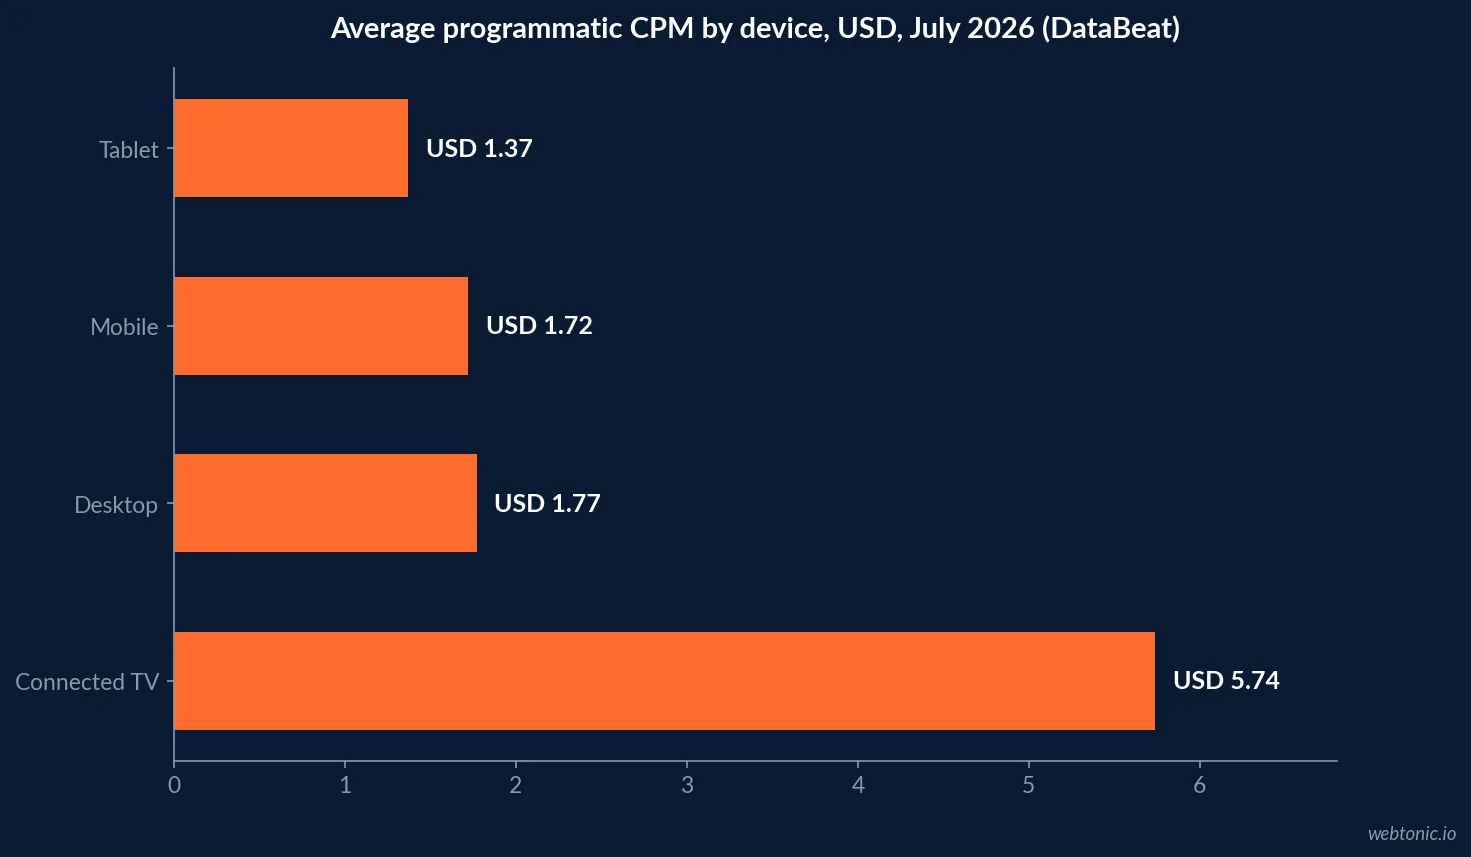
Mobile and desktop CPMs sat five cents apart in July 2026: mobile at USD 1.72 (up 19.4% monthly, 53.5% annually) against desktop at USD 1.77 (up 6.4% monthly, 43.6% annually). Tablet posted USD 1.37, up 31.5% year over year. Connected TV remains the exception - it recovered 20.7% month over month to USD 5.74 but is still down 12.3% year over year, narrowed from a 25.8% annual decline recorded three months earlier. DataBeat attributes mobile's rise to advertisers gaining confidence in in-app inventory as publishers strengthen first-party and contextual signals rather than relying on device identifiers.
| Device | CPM, July 2026 | MoM change | YoY change |
|---|---|---|---|
| Connected TV | $5.74 | +20.7% | -12.3% |
| Desktop | $1.77 | +6.4% | +43.6% |
| Mobile | $1.72 | +19.4% | +53.5% |
| Tablet | $1.37 | +8.5% | +31.5% |
Header bidding's role in the mix
Prebid's regained 54% share did not happen in a vacuum. Prebid.org maintains the open-source header bidding standard that lets a publisher run one unified auction across dozens of demand sources instead of a sequential waterfall, and Red Volcano's publisher-detection data tracks well over 300,000 publisher domains running each of the top header bidding wrappers, with the leading players separated by tens of thousands of sites rather than an order of magnitude. That crowded, competitive field is exactly why DataBeat's own reporting ties the unified-auction migration to publisher revenue gains of 15% to 30% over legacy waterfall setups.
Supply still arrives through middlemen
The auction's pricing only tells half the story; the other half is how many hands the impression passes through before it reaches the exchange. DataBeat's Sellers Report for July 2026 recorded a net addition of 64,800 ads.txt lines across the market, with resellers responsible for 56.9% of that growth - down slightly from 63% in April and 57.4% in June, but still the majority path. Tier-1 supply-side platforms carried a 46% duplicated-domain rate and a direct-only share of just 19.91%, meaning the same publisher inventory frequently enters more than one auction path and can end up competing against itself for the same impression.
| Supply-chain metric, July 2026 | Value | Trend vs. prior months | Source |
|---|---|---|---|
| Net new ads.txt lines added | 64,800 | — | DataBeat Sellers Report |
| Share added via resellers | 56.9% | Down from 63% (April) | DataBeat |
| Tier-1 SSP duplicated-domain rate | 46% | Flat | DataBeat |
| Tier-1 SSP direct-only share | 19.91% | Essentially flat | DataBeat |
Addressability is patchy, not gone
Buyers often talk about identity loss at the exchange level as though it were uniform. It isn't. AdExchanger reporting puts overall addressable web traffic - reachable via either a third-party cookie or an alternative identifier - at roughly 30%, while about 50% of Chrome bid requests still carry a cookie. That gap between the aggregate figure and the Chrome-specific one is the practical reason sell-side curation and supply path optimization have become standing agenda items rather than one-time projects: the addressable share of the bidstream now depends on which browser, which integration and which publisher relationship a given impression travels through.
What this means for a buyer's plan
Three things follow directly from the data above. First, integration mix is not stable enough to set and forget - a media plan built around April's 35% AdX share would have missed July's swing back to Prebid entirely. Second, CPM and volume move independently, so chasing the cheapest headline rate (AdX at USD 1.46) can mean routing budget away from integrations posting stronger year-over-year growth. Third, reseller-heavy, duplicated supply paths are a measurable tax on spend before an impression is even bid on, which is exactly the waste that supply path optimization programs are built to recover. Teams building or auditing a paid media plan around this layer can see how we structure that work in our growth marketing practice, or read our breakdown of building a Google Ads strategy for the buy-side counterpart to this exchange data. If you want a second set of eyes on an existing programmatic setup, talk to our team before the next quarter's integration mix shifts again.
Frequently Asked Questions
How big is the real-time bidding market?
The Business Research Company sizes real-time bidding at USD 21.02 billion in 2025, growing to USD 26.32 billion in 2026 at a 25.2% compound annual growth rate, and projects USD 64.34 billion by 2030. That trajectory tracks the IAB's finding that programmatic advertising revenue itself rose 20.5% year over year to USD 162.4 billion in 2025, adding USD 27.6 billion in new spend in a single year.
Which exchange integration wins the most bid volume?
It changes month to month. DataBeat's July 2026 data puts Prebid at 54% of integration mix, Google's Ad Exchange (AdX) at 34%, Amazon's TAM at 8% and Google's EBDA at 4%. Two months earlier the flow ran the other way, with AdX rising to 35% and Prebid falling to 48%. Neither integration holds a stable lead; buyers who assume last quarter's mix still applies are pricing against stale data.
Do different exchange integrations pay different CPMs?
Yes, and the gap is widening rather than closing. DataBeat's July 2026 figures show Prebid CPMs at USD 1.82 (up 38.0% year over year), Amazon's TAM at USD 2.34 (up 35.5%), Google's EBDA at USD 1.83 (up 37.5%) and Google's Ad Exchange at USD 1.46, essentially flat at down 0.5% year over year despite remaining the largest single volume channel.
How much of the exchange bidstream still runs through resellers?
A majority of it. DataBeat's Sellers Report for July 2026 recorded a net addition of 64,800 ads.txt lines, with resellers responsible for 56.9% of that growth. Tier-1 supply-side platforms carried a 46% duplicated-domain rate and a direct-only share of just 19.91%, meaning the same publisher inventory frequently enters the auction through more than one path at once.
Is third-party cookie loss actually shrinking exchange addressability?
Only partially, and unevenly by browser. AdExchanger reports that roughly 30% of web traffic is currently addressable through either a third-party cookie or an alternative identifier, while about 50% of Chrome bid requests still include a cookie. The exchange layer has not lost identity uniformly; it has lost it in patches that change which supply path is worth bidding on.
Sources
IAB - 2025 Internet Advertising Revenue Report (with PwC)
The Business Research Company - Real Time Bidding (RTB) Global Market Report 2026
PPC Land - US programmatic CPMs gain 51% year over year, DataBeat finds
DataBeat - U.S. Programmatic Trends Report, August 2026
AdExchanger - Can sell-side curation solve the cookieless audience problem?
Red Volcano - Top header bidding partners, 2026 data
Prebid.org - Open-source header bidding standard
IAB Tech Lab - OpenRTB (Real-Time Bidding) standard


