Table of contents
Only 17.4% of A/B tests reach a statistically significant winner, and the average lift on that win is a modest 8.4% - not the dramatic doubling that case studies advertise. This page pulls together the 2026 data on win rates, sample sizes, and which page elements are worth testing first.
Key Takeaways
- 17.4% of A/B tests reach a significant winner across a 2,408-test 2026 dataset.
- The average lift on a winning test is 8.4%, median 6.1%.
- A 50%-plus lift happens in only 1.7% of winning tests - a 1-in-300 outcome.
- Fewer than 0.2% of websites run structured A/B testing, about 2.2 million sites.
- 32% of the top 10,000 sites by traffic run a testing platform, versus 11.5% of the top 1 million.
- Payment method surfacing wins 84.7% of the time, the highest win rate of any test type measured.
- Page speed tests win 38.4% of the time, the second-highest rate.
- The median A/B test needs 14,800 sessions per variation for a 5% minimum detectable effect.
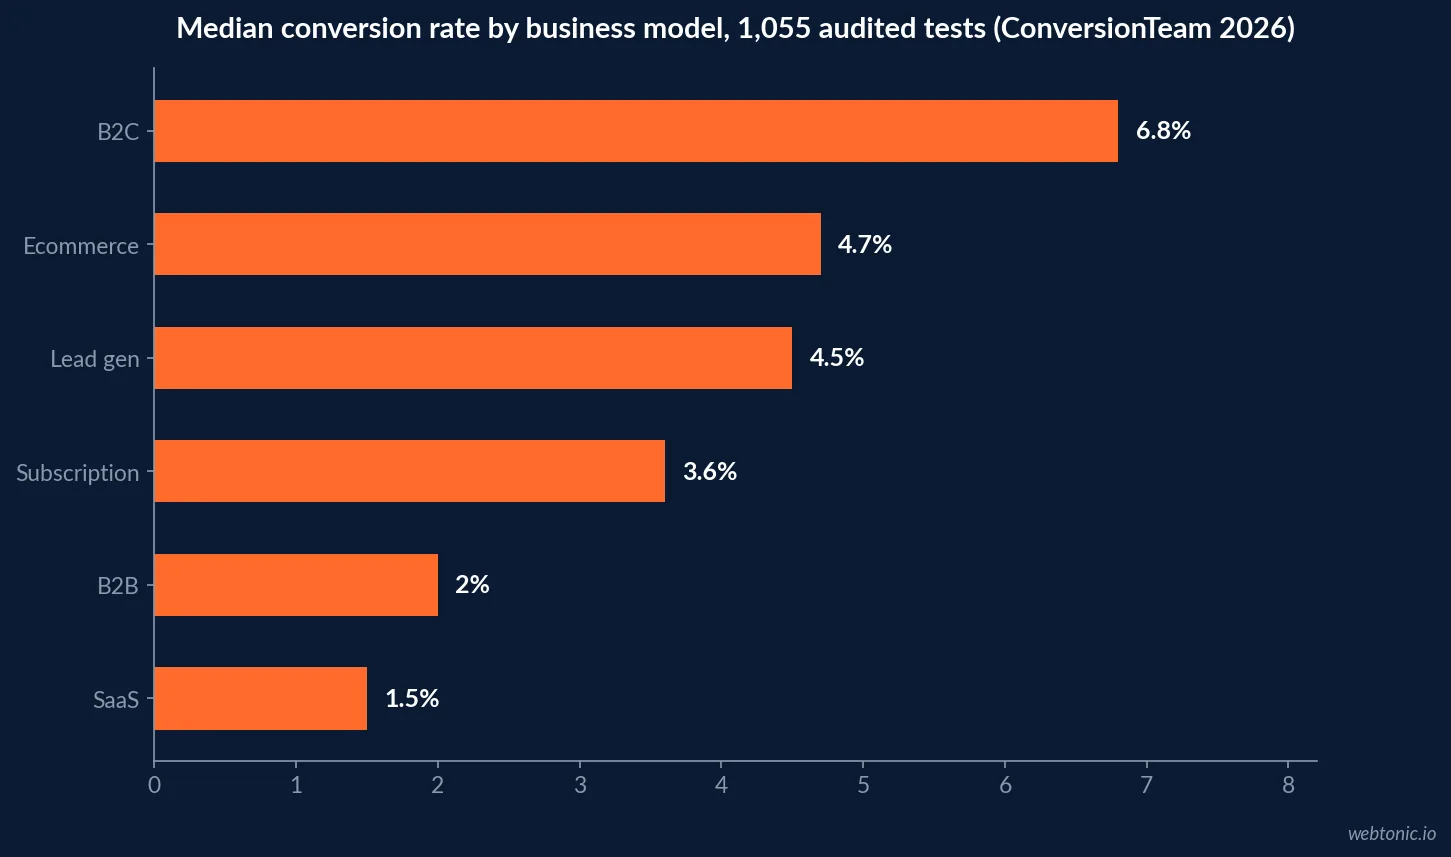
- Median control conversion rate is 4.6% across 1,055 audited tests, but ranges from 1.5% (SaaS) to 6.8% (B2C).
- Email converts at 11.8% median, the best-performing channel measured.
- 36.3% of tests produce a significant winner in Convert's own 2026 platform data.
- Top-quartile programs run 24-plus tests a year; the median program runs 14.
- 99% of marketers call their A/B testing program at least somewhat successful, per a 2025 survey.
- 51% cite limited traffic as their top barrier to testing.
- 84% of marketers test at least monthly; 38% test weekly.
- 92% say AI tools have improved their testing process.
- Visual elements are the most-tested item, at 55.5% of programs.
- CTA copy is the single most-tested tactic, run roughly 3,500 times in VWO's benchmark set.
How many companies actually run A/B tests
Self-reported adoption is high and largely meaningless: Foundry CRO's 2026 analysis found 77% of companies say they A/B test, yet fewer than 0.2% of the roughly 1.1-1.2 billion active websites online - about 2.2 million sites - actually run a recognized experimentation or personalization platform, per BuiltWith data cited in Convert's 2026 stats roundup. Adoption is also concentrated at the top of the traffic curve, not spread evenly across the web.
| Site tier | Share running a testing/personalization platform |
|---|---|
| Top 10,000 sites by traffic | 32% |
| Top 100,000 sites | 20.95% |
| Top 1,000,000 sites | 11.5% |
| All active websites (~1.1-1.2B) | ~0.2% |
Win rates: what "success" really looks like in 2026
Win-rate figures vary by dataset and significance threshold, but every current source lands well below the "half your tests win" intuition many teams carry. Visionary Marketing's aggregation of 2,408 experiments run between January 2023 and March 2026 found the win rate sits closer to 1-in-6 than the "1 in 8" figure that circulated in CRO literature for a decade.
| Outcome | Visionary Marketing (2,408 tests) | Convert platform data | DRIP Agency (90+ brands) |
|---|---|---|---|
| Statistically significant winner | 17.4% | 36.3% | 36.3% |
| Statistically significant loser | 8.4% | 22.1% | 22.1% |
| Inconclusive / no detectable difference | 74.2% | 41.6% | 41.6% |
Average lift on a winning test
Even a "winning" test rarely moves the needle dramatically. Across the Visionary Marketing dataset, the average lift on winning tests is 8.4% (median 6.1%, P75 12.4%, P90 18.7%, P95 28.4%). The long right tail - the 1.7% of tests with 50%-plus lifts - is what skews the mean upward and fuels the "we doubled conversions" case studies that dominate CRO marketing. Foundry CRO separately puts the median conversion-rate uplift from a winning test at 1.88% and the median revenue-per-visitor uplift at 2.77%, a more conservative read using a different baseline.
| Percentile | Lift on winning tests |
|---|---|
| Median (P50) | 6.1% |
| P75 | 12.4% |
| P90 | 18.7% |
| P95 | 28.4% |
| Mean (skewed by outliers) | 8.4% |
Win rate by test type
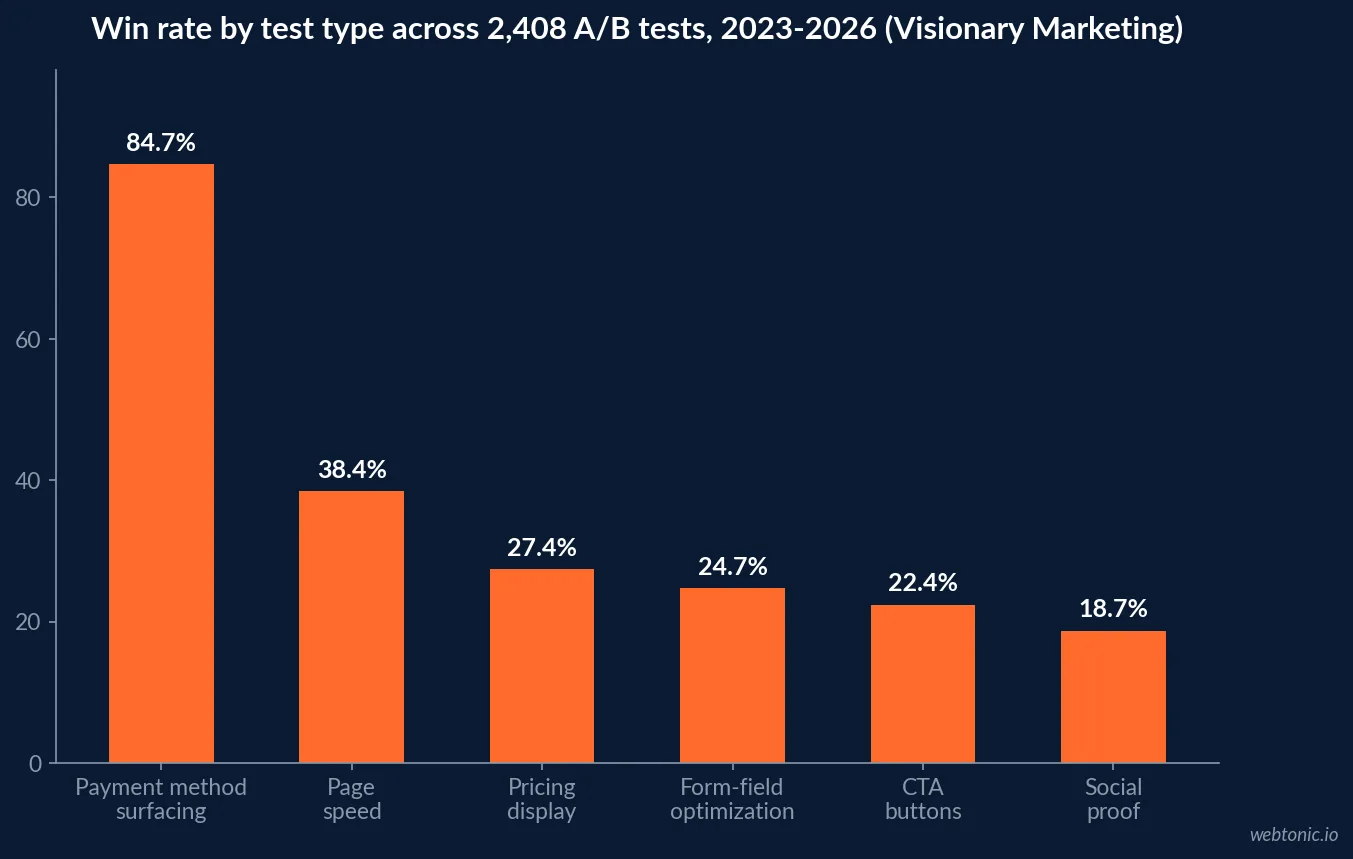
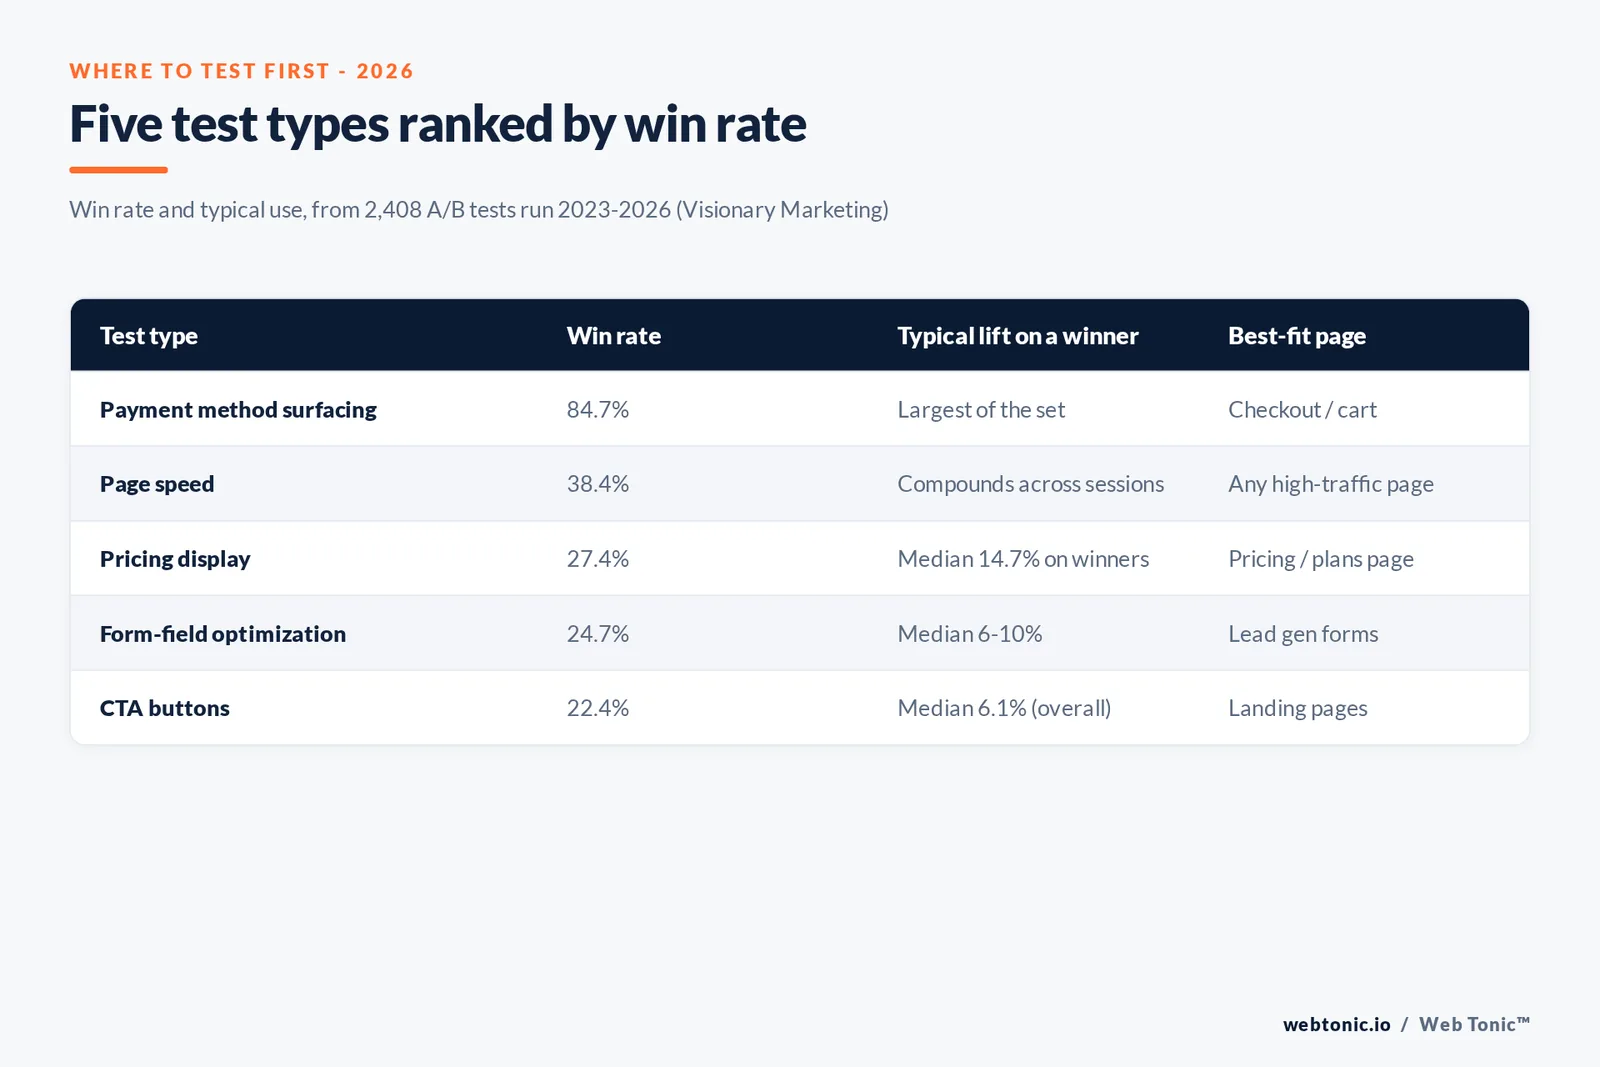
Not every test type is equally likely to win. Interventions that remove friction from an existing decision - like surfacing a preferred payment method or speeding up a page - outperform persuasion-style changes like copy or layout tweaks, according to the Visionary Marketing dataset.
| Test type | Win rate |
|---|---|
| Payment method surfacing | 84.7% |
| Page speed | 38.4% |
| Pricing display | 27.4% |
| Form-field optimization | 24.7% |
| CTA buttons | 22.4% |
| Social proof | 18.7% |
| Copy | 17.4% |
| Layout | 12.1% |
| Navigation | 11.4% |
| Image swap | 9.4% |
Conversion rate benchmarks by business model and channel
ConversionTeam's 2026 analysis of 1,055 audited A/B tests with a verified baseline found a median control conversion rate of 4.6% - but that single figure hides most of the story. The number depends almost entirely on business model and acquisition channel.
| Traffic channel | Median conversion rate |
|---|---|
| 11.8% | |
| Direct | 5.9% |
| Paid search | 4.9% |
| Referral | 4.7% |
| Organic search | 3.0% |
A related pattern: returning visitors convert about 1.8x more often than new visitors (7.4% versus 4.2% median), which is worth segmenting out before comparing a test's overall lift against an industry benchmark - a test that only reaches new visitors is competing against a lower baseline than one that reaches a returning-visitor-heavy funnel. Anyone benchmarking a paid acquisition funnel should read channel-level conversion data alongside test win rates, not instead of them.
Sample size and test duration
Statistical validity has a traffic price tag. Visionary Marketing's dataset shows the median A/B test requires roughly 14,800 sessions per variation to detect a 5% minimum detectable effect on a 3% baseline conversion rate at 95% confidence and 80% power - and 41.4% of tests in that cohort claimed significance before reaching that threshold, a common source of false positives. Limited traffic is consequently the top-cited barrier to testing: 51% of the 402 marketers surveyed by Ascend2 in 2025 named it their biggest challenge, ahead of lack of resources (47%) and time-consuming execution (38%).
| Barrier to effective A/B testing | Share of marketers citing it |
|---|---|
| Limited traffic for statistical significance | 51% |
| Lack of resources | 47% |
| Time-consuming test execution | 38% |
Testing velocity: how many tests top programs run
Win rate compounds with volume, not with any single test's outcome. DRIP Agency's 2026 CRO report, drawn from thousands of tests across 90-plus ecommerce brands, found a median of 14 tests per brand per year, with top-quartile programs running 24-plus tests annually. Foundry CRO's independent figures point the same direction: SaaS companies typically run about 5 tests a month (60 a year), the average company runs 2-3 a month, and only 9.5% of specialists reach 20-plus tests a month - and those are consistently the fastest-growing programs in their segment.
Where marketing teams focus their tests
According to HubSpot's 2026 survey of marketing teams optimizing performance, the most-tested elements skew toward visual and structural changes rather than deep copy rewrites.
| Most-tested element | Share of teams testing it |
|---|---|
| Visual elements | 55.5% |
| Audience targeting parameters | 44.2% |
| CTA wording and placement | 43.3% |
| Landing page design and structure | 42.1% |
| Offer structure and pricing | 34.4% |
VWO's 2026 benchmark report adds a volume dimension: CTA copy is the single most-tested tactic, run roughly 3,500 times across the benchmark set with about a 10% win rate, and click-through rate is the most-tested metric at roughly 8,000 tests, also around a 10% win rate. The least-tested section - the search bar - posts the highest win rate of any section measured, around 12%, suggesting a real whitespace opportunity for teams willing to test outside the usual hero-and-CTA rotation. Teams evaluating their own testing and measurement setup should weigh under-tested, high-signal areas like search and navigation alongside the crowded CTA-and-copy queue.
Why tests fail or stall
Even well-resourced programs report friction. An Ascend2 survey of 402 active A/B testers found 99% describe their program as at least somewhat successful, with 49% calling it best-in-class - but that self-reported success sits alongside real structural barriers. 46% of programs have a comprehensive, regularly updated testing strategy; 29% describe theirs as outdated or inconsistent.
| What testing programs report | Share |
|---|---|
| Program is at least somewhat successful | 99% |
| Program achieves best-in-class outcomes | 49% |
| Test at least monthly | 84% |
| Test weekly | 38% |
| Say AI tools improved the testing process | 92% |
AI's growing role in experimentation
AI tooling shows up consistently as a productivity lever rather than a replacement for testing discipline. 92% of the marketers Ascend2 surveyed said AI-driven tools have improved their A/B testing process, with nearly half (46%) reporting significant improvement - likely from faster analysis and variant generation rather than from skipping the test itself. That said, some practitioners are shifting weight toward qualitative feedback loops for time-sensitive decisions: HubSpot cites UserTesting's CMO noting that with web traffic declining, tests that take nine weeks to reach significance are too slow for some campaign timelines, making direct user feedback a necessary complement, not a replacement, for structured testing.
Turning experimentation into a measurement habit
None of the benchmarks above matter if a program can't tell a real winner from noise. The 2026 data points to three operating habits that separate compounding programs from stalling ones. First, treat testing velocity as the primary KPI, not any single test's outcome - a program running 14-plus tests a year has multiple shots at the 17-36% range of win rates documented above, while a program running two or three tests a year is gambling on a single roll. Second, size tests against the traffic-volume math up front: a page with too little traffic to reach 14,800 sessions per variation inside a reasonable window should be tested less often, or tested on a higher-traffic proxy page, rather than run to a false "significant" result at low volume. Third, weight the test queue toward friction removal - payment flows, page speed, form fields - ahead of persuasion copy, since the win-rate gap between those categories is large and consistent across datasets.
Programs that combine testing with qualitative research close the loop fastest. When traffic is too thin to reach significance quickly, direct user feedback on messaging and creative can substitute for a slow quantitative test, which is why several 2026 reports show mature teams running both in parallel rather than choosing one measurement method over the other. Anyone building or auditing a growth marketing program around these numbers should budget for both testing tools and a lightweight research process, since neither one substitutes for the other at the traffic levels most mid-market sites actually see.
Frequently Asked Questions
What percentage of A/B tests actually win?
Across a 2026 dataset of 2,408 A/B tests run between January 2023 and March 2026, 17.4% reached statistical significance with a winning variant, 8.4% reached significance as a loser, and 74.2% were inconclusive. Separately, Convert's platform data puts the win rate at 36.3%, with 22.1% losing and 41.6% inconclusive. The spread exists because "win rate" depends heavily on what a program tests and how strict its significance threshold is - but no dataset supports the old "most tests win" myth.
What is a realistic lift from a winning test?
Modest. The median lift on a winning test is 6.1%, with the mean pulled up to 8.4% by a long tail of outliers. Only 1.7% of winning tests deliver a 50%+ lift, and the frequently cited "10x your conversion rate" case studies represent roughly a 1-in-300 outcome, not a typical result. Plan a testing roadmap around single-digit compounding gains, not one dramatic win.
How many companies actually run A/B tests?
Adoption looks strong on paper - 77% of companies say they A/B test - but actual structured experimentation is rare: fewer than 0.2% of the roughly 1.1-1.2 billion active websites online, about 2.2 million sites, run a recognized testing or personalization platform. Adoption concentrates at the top: 32% of the 10,000 largest sites by traffic run one, versus 11.5% of the top 1 million.
How much traffic does a test need before it's trustworthy?
The median test in a 2026 sample needed about 14,800 sessions per variation to detect a 5% minimum detectable effect on a 3% baseline conversion rate at 95% confidence and 80% power. Low-traffic pages rarely clear that bar inside a reasonable timeframe, which is why limited traffic is the single most common barrier cited by testing teams (51% in a 2025 survey of 402 marketers).
Which page elements should marketers test first?
Test types with structurally higher win rates cluster around removing friction rather than persuasion copy: payment method surfacing wins 84.7% of the time in one 2026 dataset, followed by page speed (38.4%), pricing display (27.4%) and form-field optimization (24.7%). CTA buttons and social proof still win regularly (22.4% and 18.7%) but sit behind the friction-removal categories.
Sources
Visionary Marketing, A/B Testing Statistics 2026
Convert, 30 A/B Testing & CRO Stats 2026
ConversionTeam, CRO Statistics 2026
DRIP Agency, CRO Statistics & Industry Report 2026
Foundry CRO, A/B Testing Statistics & Benchmarks 2026
VWO, Experimentation Benchmark Report 2026
Ascend2, A/B Testing in Marketing Research
HubSpot, Optimizing Performance in 2026