



Table of contents
Solar is not an app-first industry. The solar apps people actually download are monitoring tools from equipment makers, installed after the panels are on the roof, so App Store optimization for an installer is mostly about the owner experience rather than lead generation. What the data does show clearly is how scarce App Store search visibility is: Apple's own 2025 Transparency Report counts 164,436 apps a week in the top 10 results of at least 1,000 searches, out of 2,172,472 apps on the store. No published study reports an organic click-through or conversion rate for solar apps, and this page does not invent one.
Key Takeaways
- 2,172,472 apps were on the App Store in 2025 (Apple).
- 892,670,823 average weekly visitors used the store in 2025.
- 463,575,966 customer accounts searched the store in an average week.
- Only 164,436 apps a week reached a top-10 result for 1,000+ searches.
- That is about 7.6% of the catalog holding weekly top-10 visibility.
- Enphase Enlighten shows 93K ratings at 4.6, listed in Utilities.
- mySolarEdge shows 19K ratings at 4.5, also in Utilities.
- Utilities search-ad conversion fell to 55.89% in 2025 from 67.69% (MobileAction, vendor).
- Residential solar installed 995 MWdc in Q2 2026, down 12% year over year (SEIA).
Why solar apps are a post-sale category
A homeowner shopping for solar compares installers, quotes and financing on the web and through referrals. Very few search the App Store for "solar installer". The apps that rank for solar terms are monitoring and energy-management apps that ship with the hardware: the inverter or battery maker's app shows production, consumption and backup status once the system is live.
That changes what "App Store optimization" means here. For an equipment maker, the listing is a support and retention surface that thousands of existing owners open every week. For an installer, the realistic options are narrower: a branded service or referral app if the installer is large, or simply making sure its customers get onto the manufacturer's app with the right setup instructions. Treating the store as a lead channel for a regional installer would be building on a demand signal no source measures.
How much App Store search there is to compete for
Apple publishes the scale of its store in an annual transparency report. The 2025 edition reports 892,670,823 average weekly visitors, 463,575,966 customer accounts searching each week and 929,754,061 average weekly downloads, plus 2,053,461,208 weekly redownloads. Apple's advertising page uses a rounder marketing floor of over 850 million weekly visitors for 2026.
Search is therefore a large share of how people move through the store: roughly half of weekly visitors are searching accounts. But the pool of apps competing for that search is also enormous, which is why the visibility numbers in the next section matter more than the headline traffic.
| App Store metric (Apple, 2025) | Reported value | What it tells a solar brand |
|---|---|---|
| Total apps on the store | 2,172,472 | The field every listing competes against |
| Average weekly visitors | 892,670,823 | Store-wide traffic, not solar demand |
| Weekly accounts searching | 463,575,966 | Search is the main discovery path |
| Average weekly downloads | 929,754,061 | New installs across all categories |
| Average weekly redownloads | 2,053,461,208 | Returning owners reinstalling apps |
| Apps in a top-10 result for 1,000+ searches, weekly | 164,436 | The realistic visibility tier |
| Apps in a top-10 result for 1,000+ searches, year total | 1,365,649 | Apps that reached it at least once |
Top-10 search visibility is held by a small share of apps
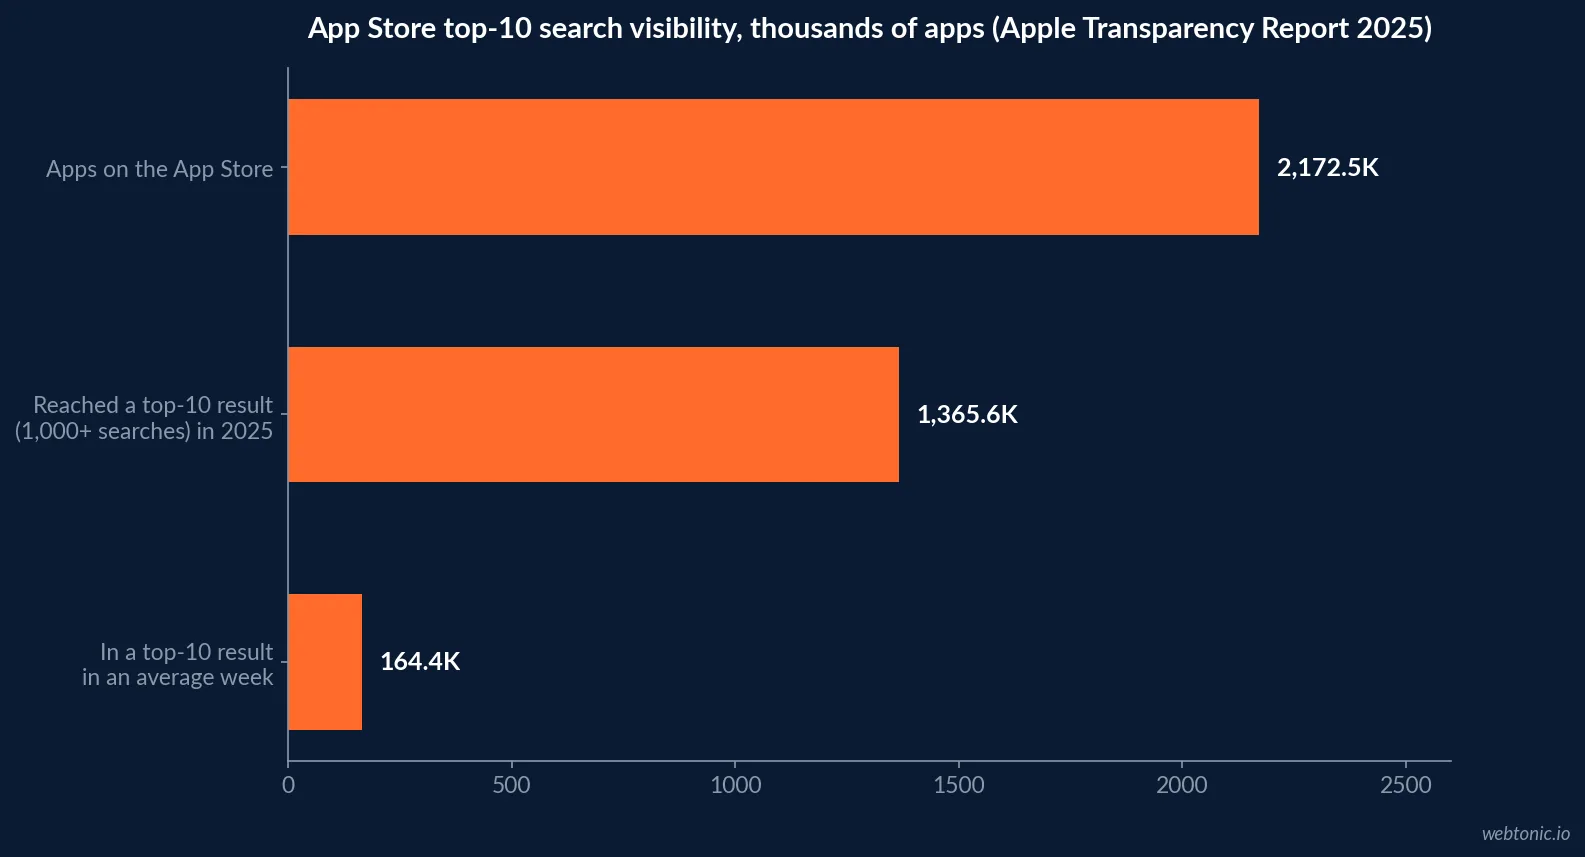
The most useful line in Apple's report for any niche is the visibility count. In an average 2025 week, 164,436 apps appeared in the top 10 results of at least 1,000 searches. Divide that by the 2,172,472 apps on the store and roughly 7.6% of the catalog held that tier in a given week. Over the full year, 1,365,649 apps reached it at least once, so visibility rotates, but the weekly slice stays thin.
For a solar monitoring app, the implication is practical. Branded searches ("Enphase", "SolarEdge") will surface the right app because the name matches. Generic searches such as "solar monitor" or "home energy" are where a smaller brand competes with every energy, smart-home and utility app, and where being outside that weekly top-10 tier means being effectively invisible.
Where the solar monitoring apps are listed
The public listings show where solar sits in Apple's taxonomy. The Enphase Enlighten listing shows 93K ratings averaging 4.6, in the Utilities category. mySolarEdge shows 19K ratings at 4.5, also in Utilities. The Tesla app, which controls vehicles and energy products including Powerwall and solar, shows 121K ratings at 4.7 and sits in Lifestyle.
These counts were read from the US App Store listings on 30 September 2026 and change daily. They are useful as a scale reference - a monitoring app with a few hundred ratings is competing against established owner bases in the tens of thousands - not as a ranking benchmark.
| Solar-related app (US App Store) | Ratings shown | Average rating | Category | Who downloads it |
|---|---|---|---|---|
| Enphase Enlighten | 93K | 4.6 | Utilities | Owners of Enphase microinverter systems |
| mySolarEdge | 19K | 4.5 | Utilities | Owners of SolarEdge inverter systems |
| Tesla | 121K | 4.7 | Lifestyle | Vehicle owners plus Powerwall and solar owners |
| Regional installer app | Not published | Not published | Varies | Rare; most installers have none |
Utilities category search-ad benchmarks
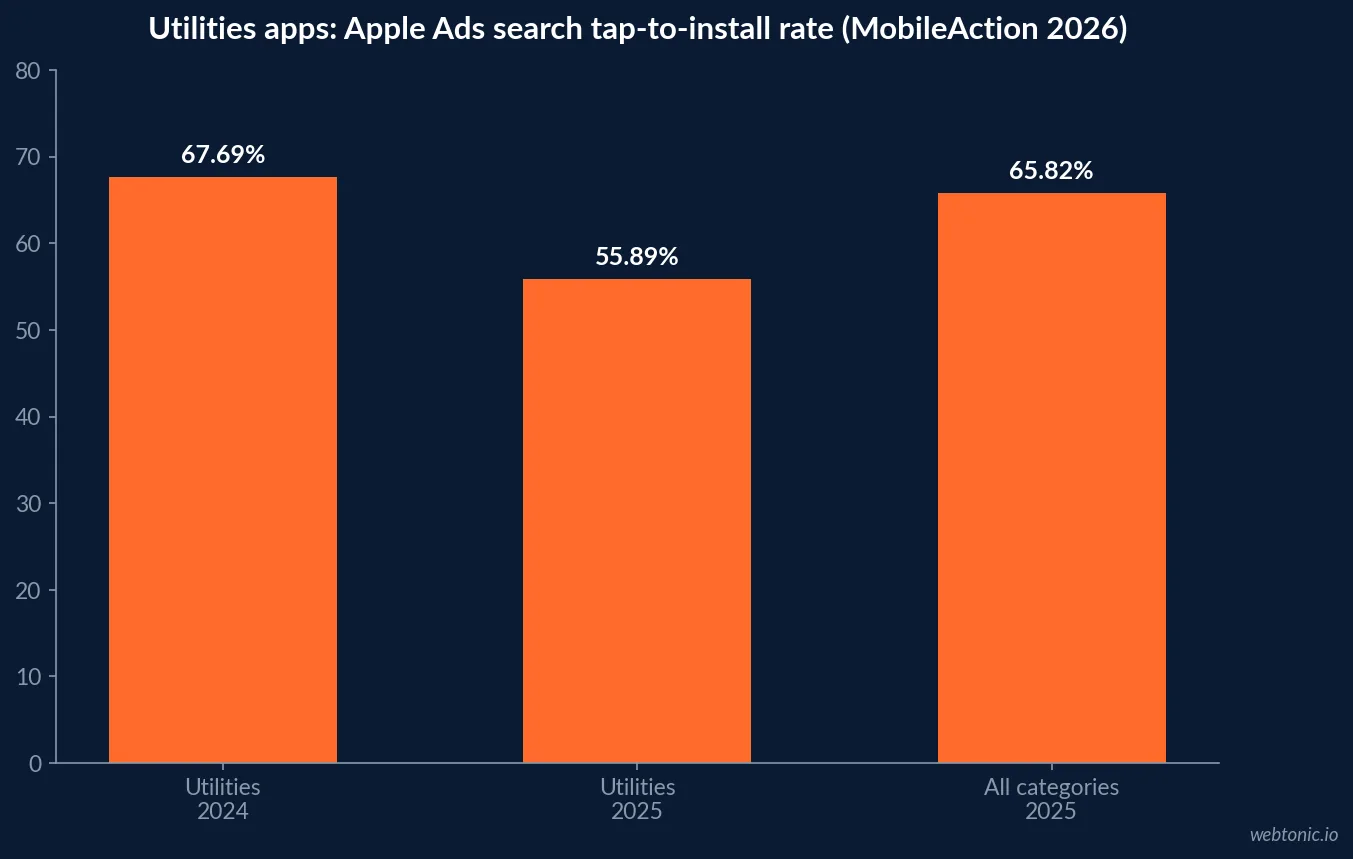
Paid data is the only category-level evidence available, so it is labelled as such. MobileAction's 2026 Apple Ads benchmark, compiled from its own and SearchAds.com tools on 2025 campaigns, reports the Utilities search-results conversion rate falling to 55.89% from 67.69% in 2024. The vendor reads that as more traffic arriving from broad comparison terms. Its tap-through rate data puts Utilities at 9.79% in 2025 against 10.47% in 2024, still in the upper tier.
For context, the same executive summary puts the all-category search-results conversion rate at 65.82% and the all-category cost per acquisition at USD 2.51 for 2025. Utilities taps are clicked readily but convert less than the average - a pattern consistent with people browsing several energy apps before installing one. These are Apple Ads figures for paid placements; they are not organic rates.
| Apple Ads search results metric (MobileAction, vendor) | Utilities 2024 | Utilities 2025 | All categories 2025 |
|---|---|---|---|
| Tap-to-download conversion rate | 67.69% | 55.89% | 65.82% |
| Tap-through rate | 10.47% | 9.79% | 8.08% |
| Cost per acquisition | Not broken out | Not broken out | USD 2.51 |
| Data basis | 2024 campaigns | 2025 campaigns | 2025 campaigns |
The installer market behind the apps
App demand in solar follows installations, and the residential market is shrinking in 2026. The SEIA and Wood Mackenzie Q3 2026 Solar Market Insight reports 995 MWdc of residential solar installed in Q2 2026, down 12% year over year and 10% quarter over quarter, as the market adjusts to the end of the Section 25D residential credit at the close of 2025. Commercial installed 638 MWdc (+11% year over year) and community solar 231 MWdc (-14%).
Total US installations still grew 45% to 11.4 GWdc, but utility-scale projects (9.6 GWdc) supplied almost all of it. Utility-scale plants do not create homeowner app downloads, so the growth headline and the monitoring-app audience move in different directions this year.
| US solar segment (SEIA/Wood Mackenzie) | Q2 2026 installed | Year over year | Creates app users? |
|---|---|---|---|
| Residential | 995 MWdc | -12% | Yes - every home system needs monitoring |
| Commercial | 638 MWdc | +11% | Some - facility managers use fleet dashboards |
| Community solar | 231 MWdc | -14% | Indirectly - subscribers use billing portals |
| Utility-scale | 9.6 GWdc | +61% | No consumer app audience |
| All segments | 11.4 GWdc | +45% | Driven by utility-scale |
What Apple and Google let you test on a listing
Both stores offer native testing, and these are the tools that change a listing's conversion without guesswork. Apple's product page optimization runs up to three treatments of icon, screenshots and previews against the default page, for up to 90 days. Apple's custom product pages allow up to 70 additional versions, and Apple reports developers seeing a 2.5 percentage point average lift when sending traffic to one, against a 1.6% average conversion rate on default pages.
On Android, Google Play's store listing experiments A/B test text and graphics, including localized variants, and report acquisition and 1-day retention by version. For a monitoring app, a custom page per hardware line (battery, EV charger, inverter) or per installer partner is a cleaner use of these tools than one generic listing.
| Listing tool | Store | Documented limit | Solar use case |
|---|---|---|---|
| Product page optimization | App Store | Up to 3 treatments, up to 90 days | Test production-graph vs savings-led screenshots |
| Custom product pages | App Store | Up to 70 extra pages | One page per hardware line or installer partner |
| Default page conversion (Apple average) | App Store | 1.6%, +2.5 points on custom pages | Baseline for measuring a custom page |
| Store listing experiments | Google Play | A/B tests incl. localized text | Test setup-guide messaging by market |
Green claims in screenshots and descriptions
Solar listings lean on savings and environmental language, and that copy is advertising. The FTC's Green Guides (16 CFR Part 260) state that it is deceptive to misrepresent, directly or by implication, that a product or service offers a general environmental benefit, and that unqualified general environmental claims are difficult to interpret and likely convey a wide range of meanings. The same part covers carbon offsets and certification seals.
In practice, a screenshot saying "eco-friendly energy" is weaker and riskier than one showing a real production graph with a clear label. If a listing mentions savings, the basis should be qualified in the description, and any third-party seal must reflect a real, independent certification.
What the data does and does not show
It is worth being explicit, because solar ASO content online often quotes numbers that no named study publishes. Apple publishes store-wide scale and visibility. MobileAction and similar vendors publish paid-search category benchmarks from their own client and tool data. Listings publish rating counts. Nobody publishes an organic keyword ranking share, click-through rate or install rate for solar apps.
With 91% of US adults owning a smartphone according to the Pew Research Center, almost every solar customer can use a monitoring app. Whether they find the right one is a setup and onboarding problem more than a store-ranking problem.
| Question | Published data? | Best available source |
|---|---|---|
| How big is App Store search? | Yes | Apple Transparency Report 2025 |
| How many apps get top-10 visibility? | Yes | Apple Transparency Report 2025 |
| Utilities paid search conversion | Yes (vendor) | MobileAction 2026 benchmark, 2025 data |
| Organic CTR or install rate for solar apps | No | None - do not quote one |
| Share of installers with their own app | No | None published |
Practical steps for installers and equipment brands
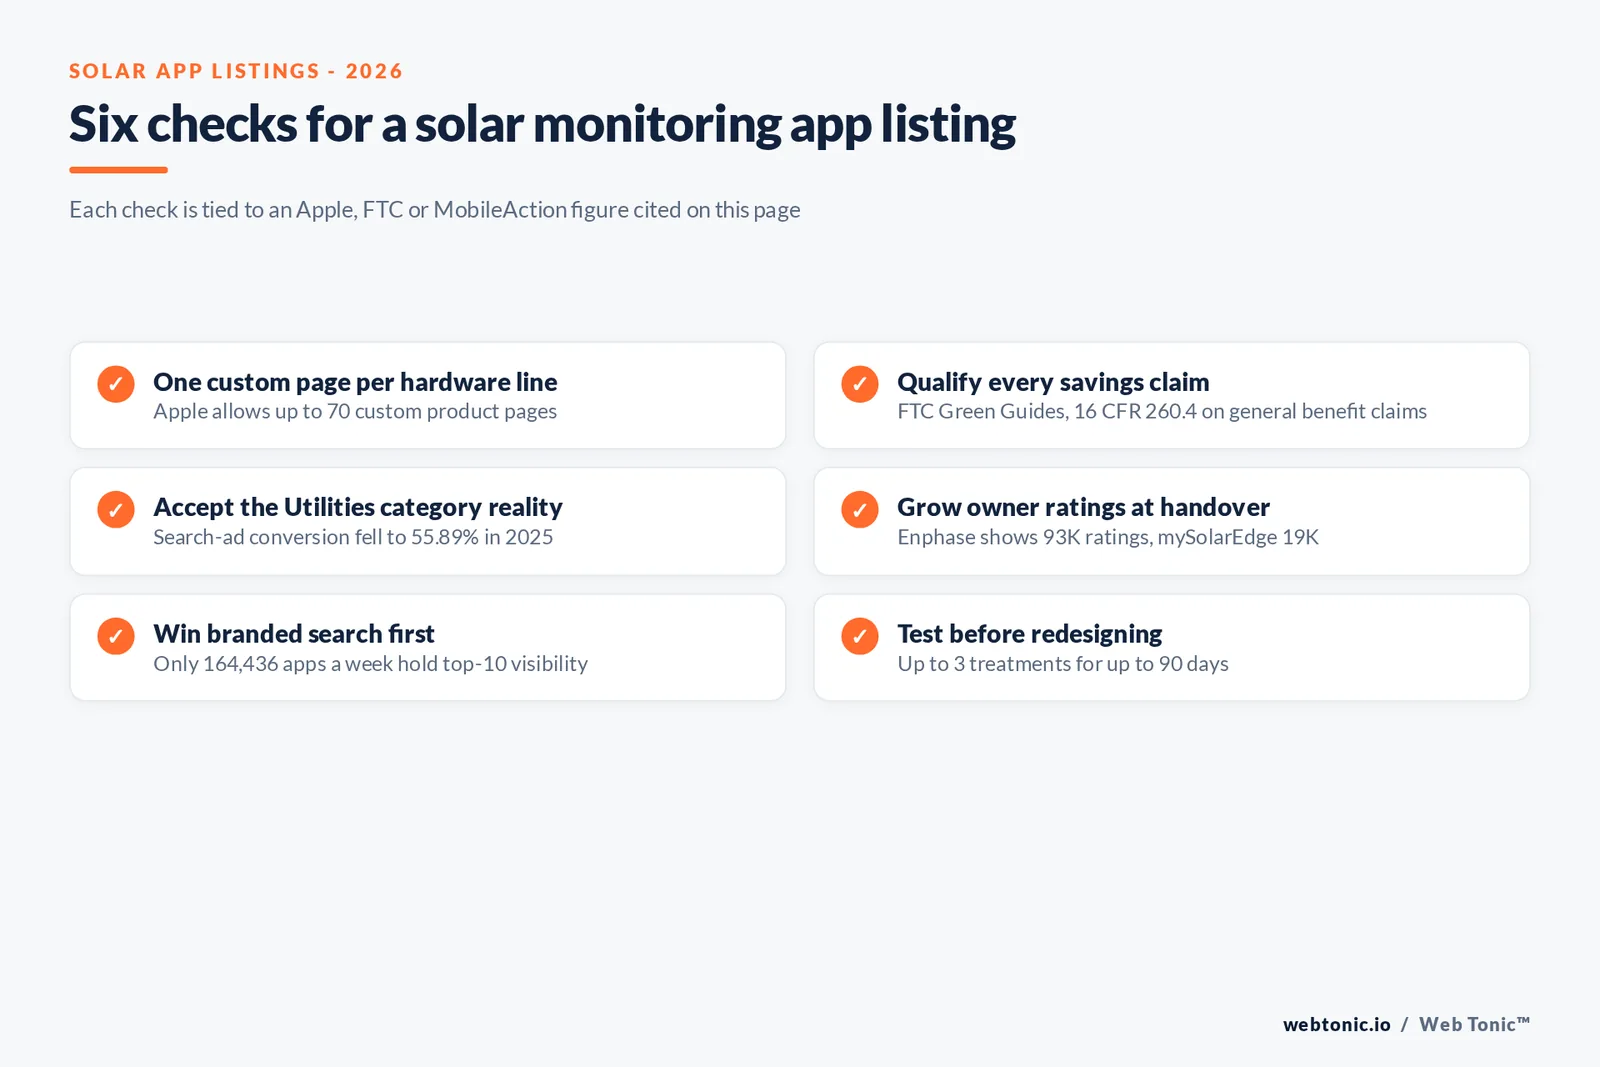
- Installers without an app: put the manufacturer's app, account setup steps and support contact into the handover pack; that is where owner ratings come from.
- Equipment makers: build custom product pages per hardware line and send support emails and packaging QR codes to the matching page.
- Everyone: track branded search share in App Store Connect and Play Console; generic terms are a long-shot against the weekly top-10 tier.
- Use a three-treatment product page test before redesigning screenshots on opinion.
- Qualify every savings or environmental claim in the listing as you would in an ad.
- Answer reviews that describe setup failures; they are the most common reason owners rate monitoring apps low.
Related reading
For the store-wide picture see our app store optimization statistics. Solar brands selling hardware online can compare feed data in solar Google Shopping and feed management statistics, and awareness buyers can look at solar connected TV advertising statistics. To plan the channel mix, see our growth marketing services.
Frequently Asked Questions
Do solar installers need App Store optimization?
Most do not, at least not as a lead channel. The apps that exist in solar are overwhelmingly monitoring apps from equipment makers - Enphase Enlighten and mySolarEdge are both listed in the Utilities category - and homeowners download them after the system is installed. An installer without its own app has nothing to optimize in the store; its search work belongs on the website and Google Business Profile.
How hard is it to rank in the App Store top 10?
Apple's 2025 Transparency Report counts 2,172,472 apps on the store but only 164,436 apps a week that appear in the top 10 results of at least 1,000 searches. Across the whole year, 1,365,649 apps reached that threshold at least once. Weekly top-10 visibility is therefore held by roughly 7.6% of the catalog.
What conversion rate should a Utilities app expect from search ads?
MobileAction's 2026 Apple Ads benchmark, built on 2025 data from its own tools, puts the Utilities search-results conversion rate at 55.89%, down from 67.69% in 2024, against 65.82% across all categories. That is a vendor figure for paid search results taps, not an organic solar benchmark; no published source reports an organic conversion rate for solar apps.
Can a solar app promise savings in its store listing?
It can make claims it can substantiate. The FTC Green Guides at 16 CFR Part 260 say it is deceptive to misrepresent that a product offers a general environmental benefit, and unqualified general claims are difficult to substantiate. Savings or production figures in screenshots should be qualified and evidenced, just as they would be in an ad.
Is the solar market growing enough to justify an app?
The residential segment is contracting. SEIA and Wood Mackenzie report 995 MWdc of residential solar installed in Q2 2026, down 12% year over year and 10% quarter over quarter, after the Section 25D credit expired at the end of 2025. Utility-scale drove the quarter's 45% total growth, which does not create consumer app demand.
Sources
Apple - App Store Transparency Report 2025
Apple Ads - App Store advertising
MobileAction - Apple Ads 2026 Benchmark Report, executive summary
MobileAction - Search results ads conversion rate by category
SEIA / Wood Mackenzie - Solar Market Insight Q3 2026
Apple App Store - Enphase Enlighten listing
Apple Developer - Product page optimization
eCFR - FTC Green Guides, 16 CFR Part 260
Google Play Console - Store listing experiments
Pew Research Center - Mobile fact sheet


