



Table of contents
Nothing published compares native ads with social media for med spas, and nothing published shows native winning. Social is the side with numbers. Beauty and Personal Care lead campaigns on Facebook cost a median USD 51.42 in WordStream's 2025 data, and US social ad revenue grew 32.6% to USD 117.7 billion in 2025. Native networks publish budgets, revenue and creative counts, but no aesthetics result, so this page compares the evidence on each side rather than inventing a winner.
Key Takeaways
- Beauty Facebook lead campaigns cost USD 51.42 a lead in 2025 (WordStream).
- Those campaigns run a 2.55% click-through rate at USD 3.06 a click.
- Beauty traffic campaigns on Facebook cost USD 0.74 a click at a 1.81% CTR.
- Beauty search leads cost USD 39.25 in 2026, with a 10.35% conversion rate.
- US social ad revenue hit USD 117.7 billion in 2025, up 32.6% (IAB/PwC).
- Half of US adults say they use Instagram (Pew, November 2025).
- Neuromodulators made up 50% of minimally invasive treatments in 2025 (ASPS).
- Hyaluronic acid fillers made up 30%, facial fillers almost 70% of those.
- AmSpa puts med spa industry revenue at USD 17 billion-plus.
- Health is native's largest vertical at 24,472 live creatives (OpenAdLibrary, July 2026).
- No med spa native CPL, CTR or conversion rate is published.
The evidence gap, stated up front
WordStream's 2025 Facebook ads benchmarks, drawn from more than 1,000 campaigns, report a Beauty and Personal Care category that most med spas fall into. Native has no equivalent study. Taboola's 2025 results report company totals, and the IAB/PwC 2025 Internet Advertising Revenue Report tracks social media as a format but does not break out native. A med spa owner comparing the two is therefore comparing a measured benchmark against an untested channel.
| Question a med spa asks | Social media answer | Native answer |
|---|---|---|
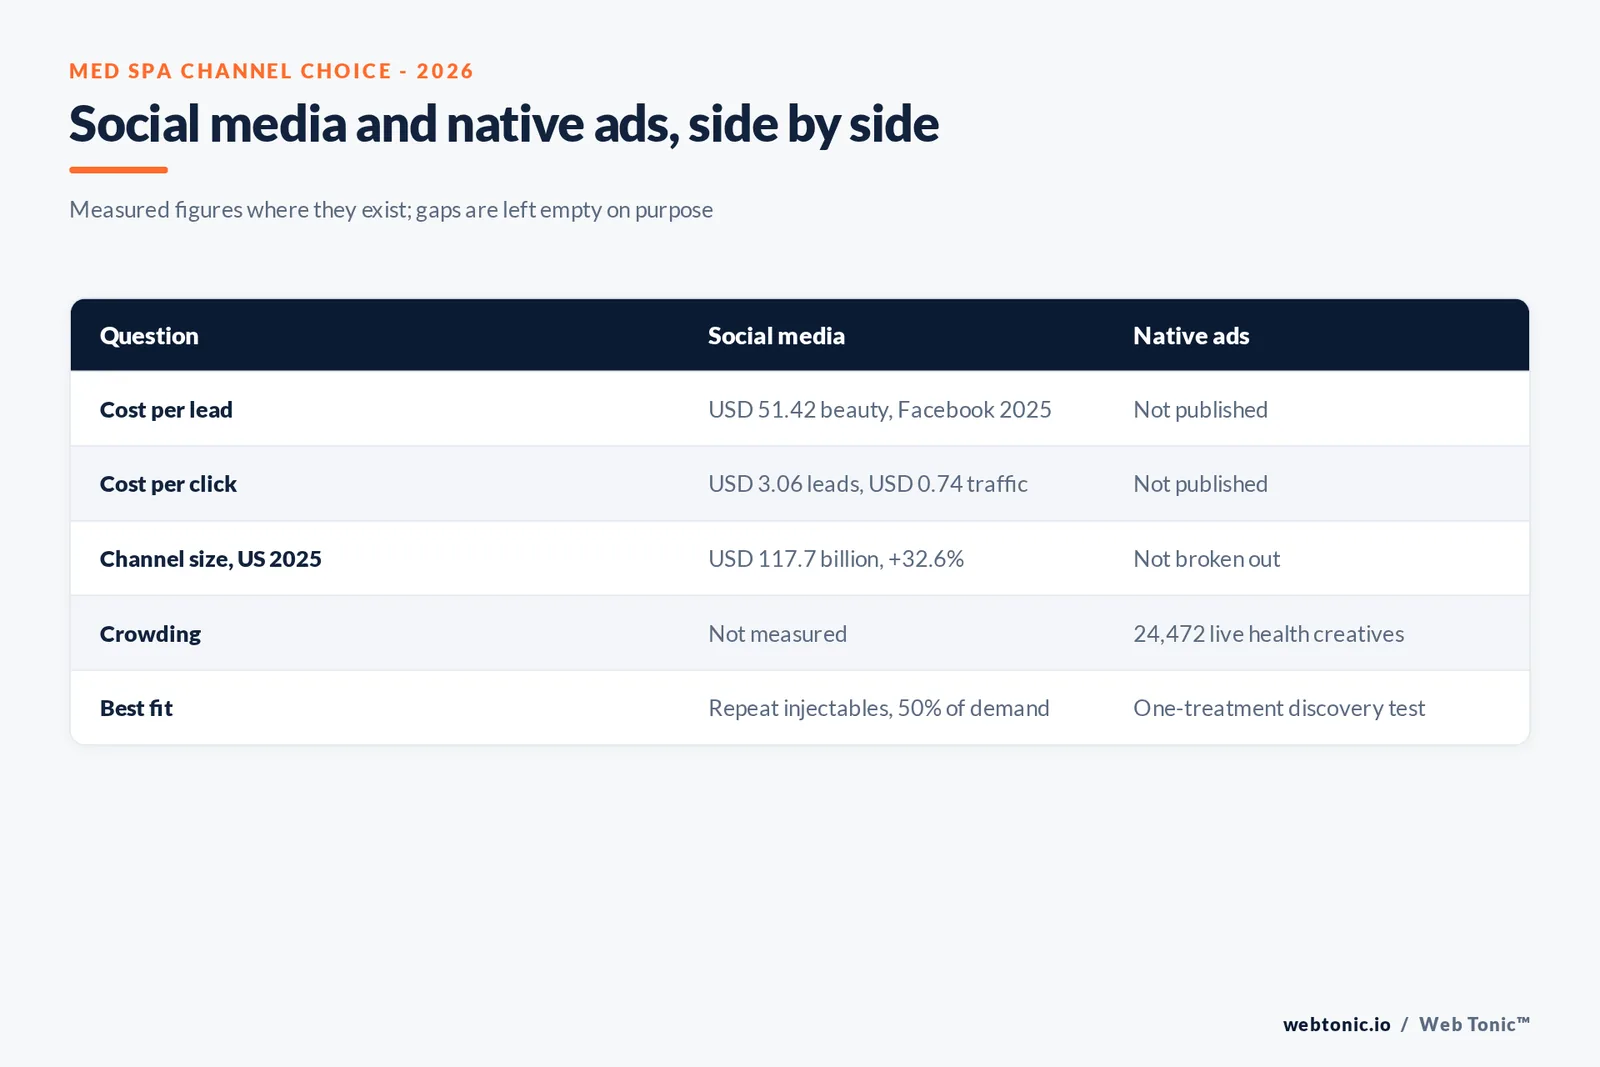
| What does a lead cost? | USD 51.42 (Beauty, Facebook leads, 2025) | Not published |
| What does a click cost? | USD 3.06 leads / USD 0.74 traffic | Not published for aesthetics |
| How big is the channel? | USD 117.7 billion US revenue, 2025 | Not broken out by IAB |
| Who sees it? | Half of US adults use Instagram | Readers of partner publisher sites |
| How crowded is it? | Not measured for beauty | 24,472 live health creatives |
Social benchmarks for beauty businesses
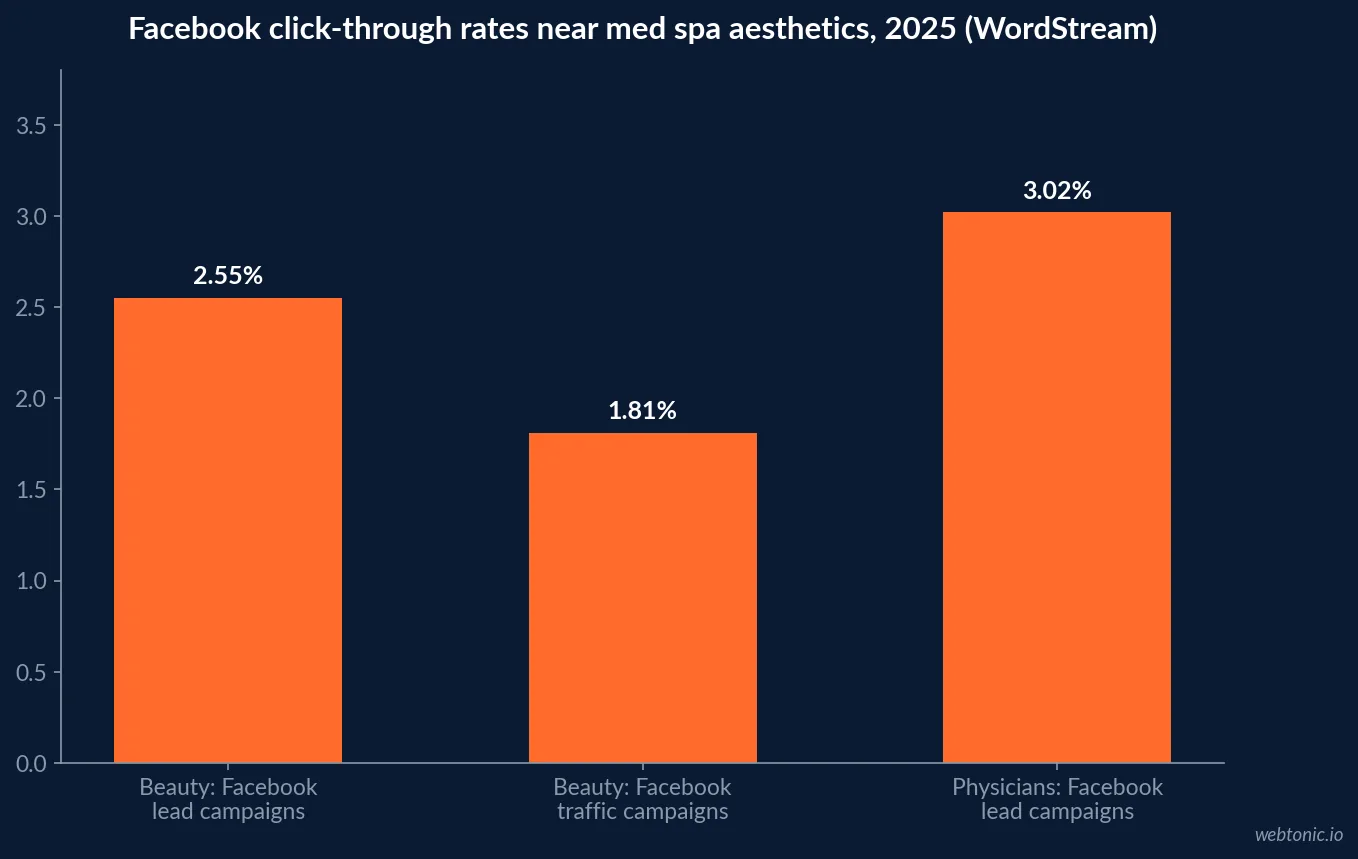
In WordStream's lead-campaign table, Beauty and Personal Care sits at a 2.55% click-through rate, USD 3.06 per click, a 5.29% conversion rate and USD 51.42 per lead. That cost per lead is the third-highest of the 15 industries, behind Dentists at USD 76.71 and Health and Fitness at USD 52.98, and almost twice the all-industry USD 27.66. Traffic campaigns are far cheaper per click: USD 0.74 at a 1.81% click-through rate.
Physicians and Surgeons, the category closest to physician-led practices, posted USD 47.47 per lead and a 3.02% click-through rate on lead campaigns.
| Facebook metric, 2025 median | Beauty and Personal Care | Physicians and Surgeons | All industries |
|---|---|---|---|
| Lead campaign CTR | 2.55% | 3.02% | 2.59% |
| Lead campaign CPC | USD 3.06 | USD 2.23 | USD 1.92 |
| Lead campaign conversion rate | 5.29% | 4.51% | 7.72% |
| Cost per lead | USD 51.42 | USD 47.47 | USD 27.66 |
| Traffic campaign CTR | 1.81% | 0.83% | 1.71% |
| Traffic campaign CPC | USD 0.74 | USD 0.82 | USD 0.70 |
Search as the third line
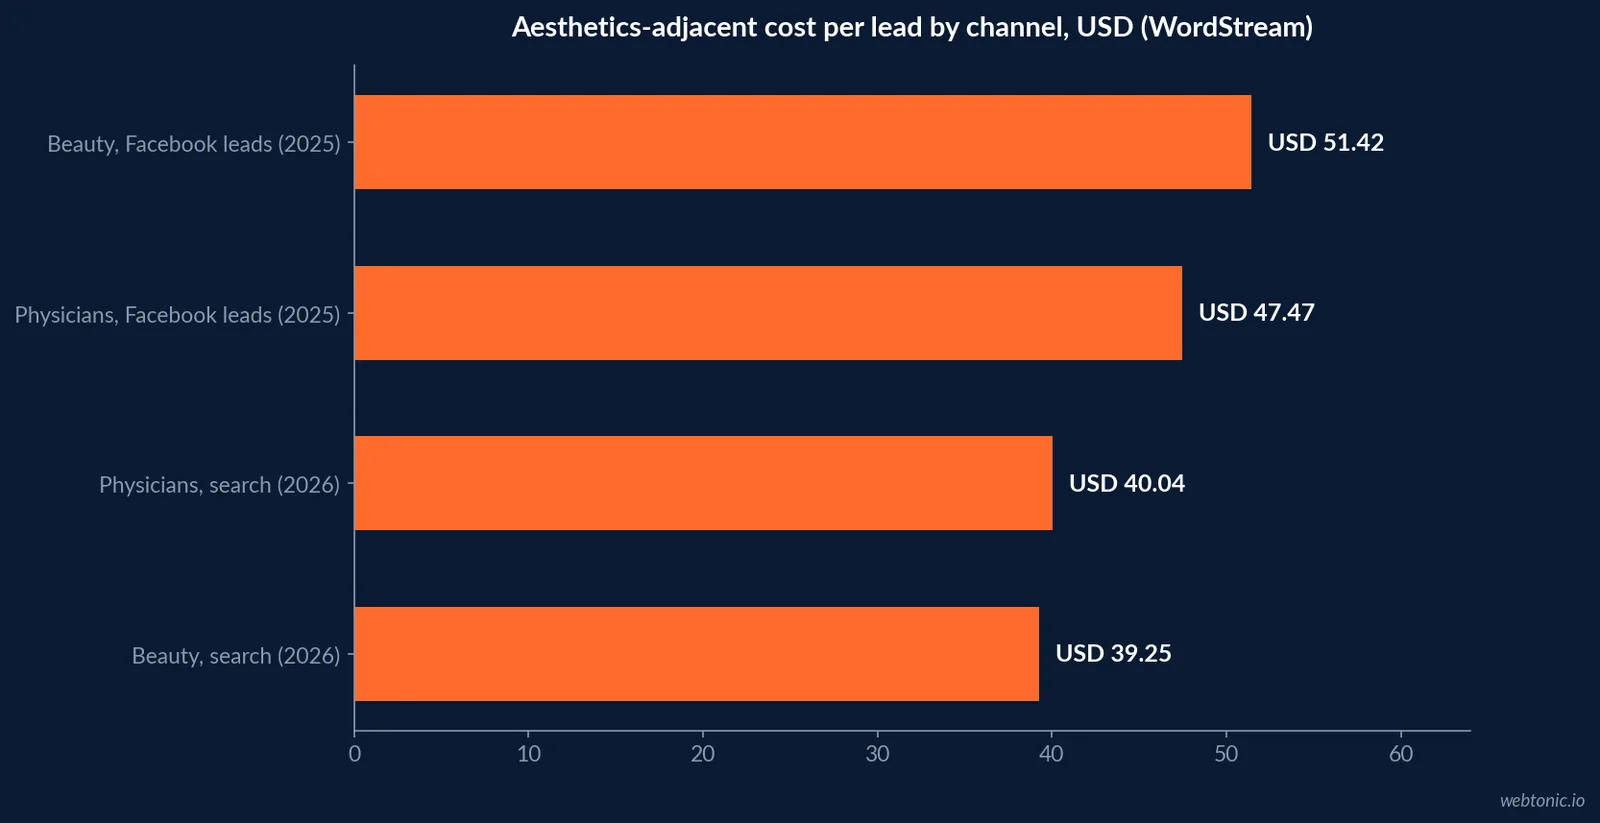
A social-versus-native choice ignores the channel where beauty leads are cheapest. WordStream's 2026 search benchmarks put Beauty and Personal Care at a 6.75% click-through rate, USD 4.62 per click, a 10.35% conversion rate and USD 39.25 per lead, below the Facebook lead figure. Physicians and Surgeons search leads cost USD 40.04, from a 6.61% click-through rate, USD 4.76 per click and a 12.43% conversion rate - the highest conversion rate of the aesthetics-adjacent lines on this page.
The ordering matters for a channel decision. On the measured figures, a beauty lead from search costs about USD 12 less than one from a Facebook lead form, and both are measured on samples that include many small local businesses like a med spa. The usual counter-argument is reach: search only captures people who already know the treatment they want, while social and native can reach people who have not searched yet. That is a reasonable hypothesis, but no published study quantifies it for aesthetics, so it should be tested with a separate discovery budget rather than funded by cutting the channel with the cheapest measured lead. A practice that does run a discovery test should keep the search line constant during the test window so any change in booked consultations can be read against a stable baseline.
Social is where the ad market is growing
IAB and PwC report US social media ad revenue of USD 117.7 billion in 2025, an increase of USD 29.0 billion or 32.6%, ahead of search at USD 114.2 billion (+11.0%) within a USD 294.6 billion market. The Pew Research Center social media fact sheet (November 2025) reports that YouTube and Facebook are the most widely used platforms and that half of US adults use Instagram - the before-and-after platform most aesthetics brands build on.
| US ad revenue line, 2025 (IAB/PwC) | Revenue | Year-on-year |
|---|---|---|
| Social media | USD 117.7 billion | +32.6% |
| Search | USD 114.2 billion | +11.0% |
| Total internet advertising | USD 294.6 billion | +13.9% |
| Native advertising | Not reported separately | - |
What patients are buying
The ASPS 2025 Procedural Statistics show where demand sits: neuromodulator injections accounted for 50 percent of minimally invasive treatments in 2025 and soft tissue or hyaluronic acid fillers for 30 percent, with facial fillers almost 70 percent of filler treatments, followed by lip fillers. In the face and neck group, facial fat grafting posted the largest increase, up 39 percent. AmSpa, the med spa trade association, cites USD 17 billion-plus in industry revenue.
For channel choice, that mix matters more than any benchmark: repeat injectable clients are a retention and remarketing problem, which favours owned social audiences, while new-patient discovery for a single treatment is where a content-led native test could be framed.
| Demand indicator (2025) | Figure | Source |
|---|---|---|
| Neuromodulators, share of minimally invasive | 50 percent | ASPS |
| HA fillers, share of minimally invasive | 30 percent | ASPS |
| Facial fillers, share of filler treatments | Almost 70 percent | ASPS |
| Facial fat grafting change | +39 percent | ASPS |
| Med spa industry revenue | USD 17 billion-plus | AmSpa |
What a native test would cost a med spa
The networks publish budget rules, not aesthetics results, so a test can be sized but not benchmarked. Taboola's Realize help centre recommends a daily budget of 10 times the CPA goal or at least USD 50. Google's Demand Gen guidance, the comparable Google format, asks for at least USD 100 a day on Maximize conversions. Applying the 10x rule to the beauty lead costs above gives the ceiling a full conversion-optimised campaign would demand - arithmetic from published numbers, not a benchmark.
| CPA goal a med spa might set | Basis | Daily budget under the 10x rule | 30-day total |
|---|---|---|---|
| Below USD 5 (proxy action) | Network floor applies | USD 50 | USD 1,500 |
| USD 39.25 | Beauty search median, 2026 | USD 392.50 | USD 11,775 |
| USD 51.42 | Beauty Facebook leads median, 2025 | USD 514.20 | USD 15,426 |
Most single-location med spas will sit in the first row: a fixed learning budget on a proxy action such as a consult-page visit, run for a set period and judged on booked consultations it assisted. Multi-location groups can afford the lead-level rows, but only once a tracked test shows the channel produces consults at all.
Who sells native inventory
Two companies dominate the open-web native market a med spa would buy from. Taboola's 2025 results show USD 1,912 million of revenue and USD 713.5 million of ex-TAC gross profit, up 6.9%, with about 2,200 Scaled Advertisers in the fourth quarter. Teads, combined with Outbrain since February 2025, reported USD 529.7 million of ex-TAC gross profit, up 124% mainly because of the acquisition. Both report company-wide; neither gives a beauty or aesthetics result. For a single clinic that means self-serve buying and an in-house creative and landing page - the network will not supply an aesthetics playbook.
The native side: crowded and compliance-heavy
OpenAdLibrary, a native-ad spy-tool vendor reporting on its own index of live native creatives, reports in its 2026 health benchmark that health is the largest native vertical with 24,472 live creatives in July 2026. It files skin, hair-regrowth and anti-aging angles under beauty but notes they "share health's funnel anatomy and compliance exposure". That is the neighbourhood a med spa advertorial lands in, next to direct-response offers with looser standards.
Claims rules that bind both channels
The FTC's Health Products Compliance Guidance states that health-related claims require substantiation in the form of "competent and reliable scientific evidence", and its native advertising guide requires that the ad be identifiable as one. The Endorsement Guides at 16 CFR Part 255 require disclosure of material connections - so a patient who received a free treatment for a testimonial must be disclosed as such, on Instagram or in a sponsored article.
Before-and-after content is the usual trigger: results that are not typical need context, whichever channel carries them.
Choosing between social and native
- Start where the benchmark is. Social and search have measured beauty costs; native does not.
- Use social for repeat injectables. Remarketing to past clients is a social and email job.
- Test native on one treatment. A single educational advertorial, labelled "Sponsored".
- Substantiate every claim. The FTC health standard applies to advertorial copy.
- Disclose patient connections. Free or discounted treatments must be stated.
- Compare on booked consults. Clicks are not comparable across channels.
Our native advertising statistics cover the channel overall, and our med spa enterprise SEO statistics cover the organic side.
What remains unmeasured
No source publishes a med spa share of native spend, an aesthetics native conversion rate or a social versus native cost per booked consultation. Practices that run both should report them back to their own dashboard; until a study appears, any quoted native-beats-social figure for aesthetics is unsupported. For the wider spend picture, our advertising statistics cover every major channel.
Frequently Asked Questions
Do native ads outperform social media for med spas?
No published data shows it either way. Meta results for beauty businesses are measured - WordStream's 2025 report puts Beauty and Personal Care lead campaigns at USD 51.42 a lead - but no network, association or study publishes a med spa or aesthetics native-ad cost per lead, click-through rate or conversion rate.
What do med spa social ads cost?
The closest published benchmark is WordStream's 2025 Facebook data for Beauty and Personal Care: a 2.55% click-through rate, USD 3.06 a click, a 5.29% conversion rate and USD 51.42 a lead on lead campaigns, and a 1.81% click-through rate at USD 0.74 a click on traffic campaigns. It is a category benchmark, not a med spa sample.
Which treatments should a med spa advertise?
Demand data points to injectables. ASPS reports that neuromodulator injections accounted for 50 percent of minimally invasive treatments in 2025 and hyaluronic acid fillers for 30 percent, with facial fillers almost 70 percent of filler treatments.
What FTC rules apply to aesthetics advertorials?
Two sets. The FTC's 2015 native advertising guidance requires the content to be identifiable as an ad. Its Health Products Compliance Guidance says health-related claims need competent and reliable scientific evidence, and the Endorsement Guides at 16 CFR 255 require material connections - a paid or discounted patient, for example - to be disclosed.
Is social ad spending still growing?
Yes. IAB and PwC report US social media ad revenue of USD 117.7 billion in 2025, up 32.6%, which now exceeds search at USD 114.2 billion. Native is not reported as its own format in that study.
Sources
WordStream - Facebook ads benchmarks 2025
WordStream - Google Ads benchmarks 2026
IAB/PwC - Internet Advertising Revenue Report FY2025
Pew Research Center - Social media fact sheet
ASPS - Plastic surgery statistics 2025
American Med Spa Association
OpenAdLibrary - Health advertising benchmarks 2026
Taboola - Full year 2025 results
FTC - Health products compliance guidance
FTC - Native advertising guide
eCFR - 16 CFR Part 255


