



Table of contents
Quick answer: Hook rate is 3-second views over impressions; hold rate is halfway views over 3-second views. Fatigue looks like both drifting down on an ad that used to perform, with frequency rising. A weak hook from launch is not fatigue — it is a bad ad.
Last verified: 2026-08-21
What the two metrics actually measure
Hook rate answers one question: did the opening stop the scroll? It is the share of impressions that produced at least a three-second view, and it is almost entirely a property of the first frame, the first spoken line and the thumbnail-level composition. Hold rate answers the next question: of the people who stopped, how many stayed to the halfway point? That is a property of pacing, payoff and whether the ad delivered on the promise it made.
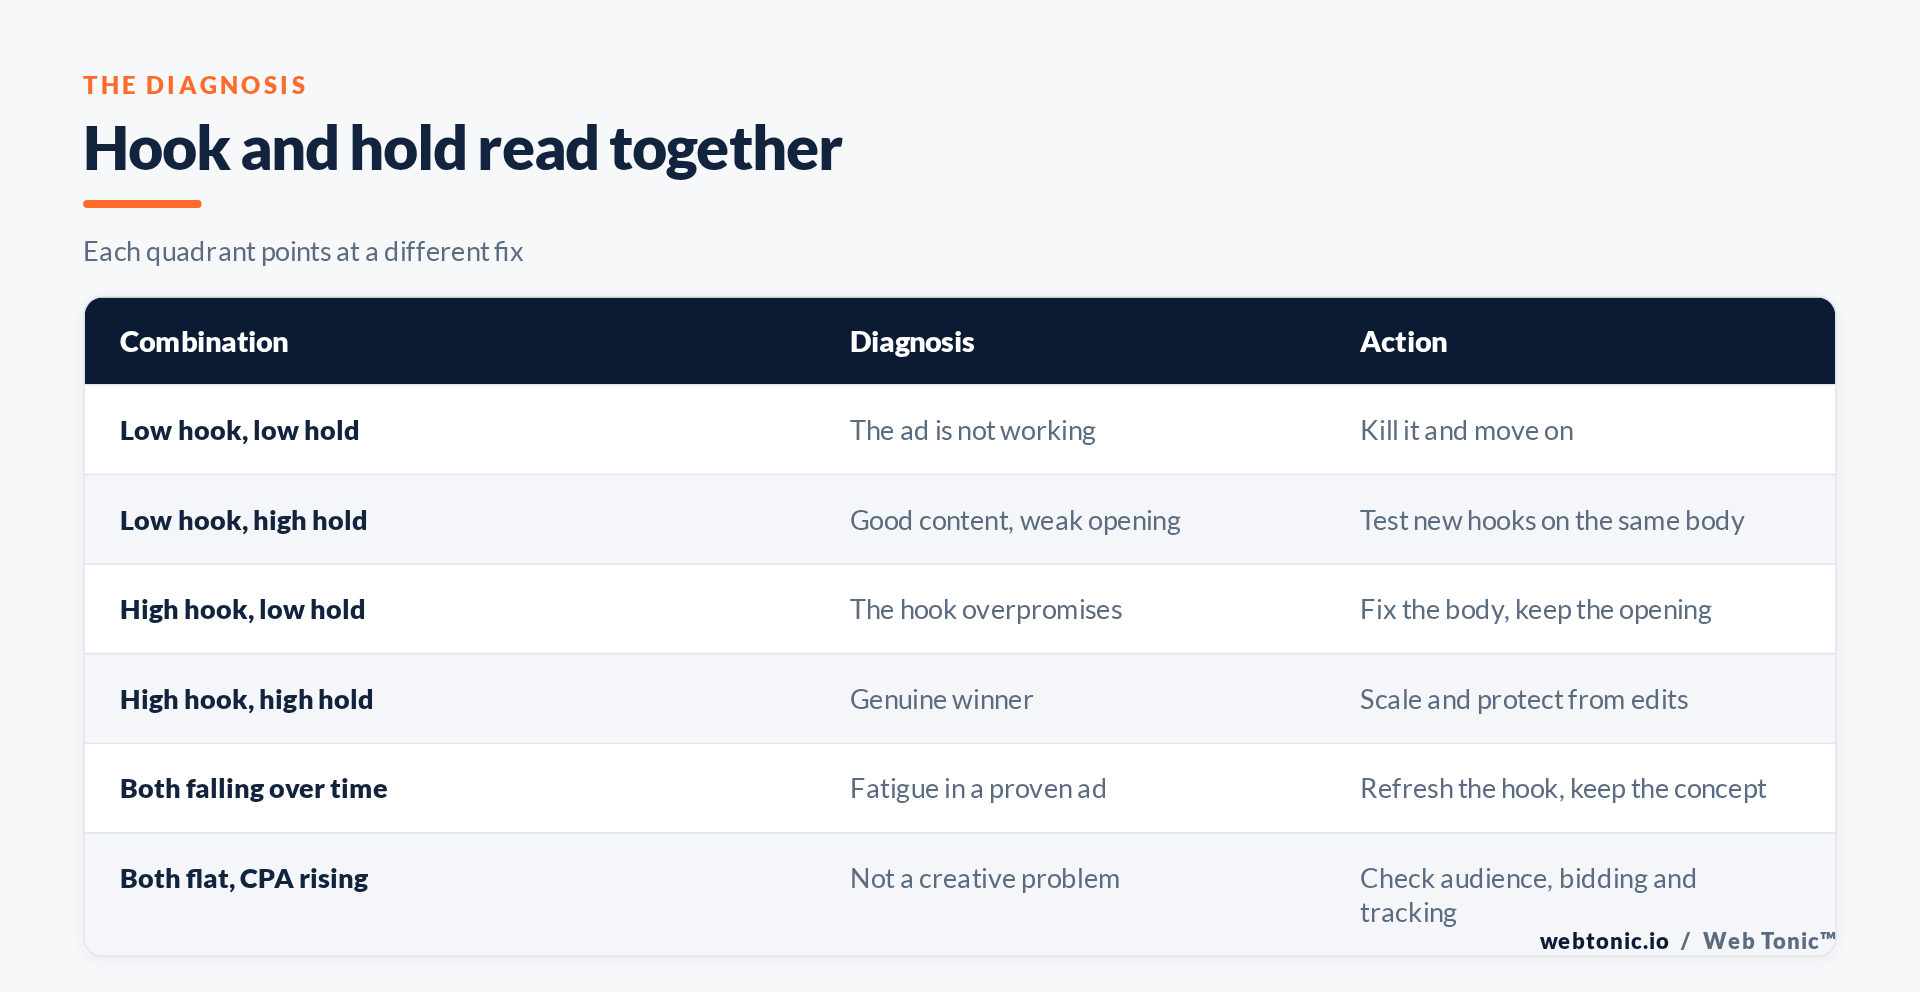
Read separately they are vanity metrics. Read together they localise the fault. An ad with a strong hook and a collapsing hold is not badly targeted — it is overpromising. An ad with a weak hook and a strong hold is a good ad wearing the wrong coat, and the cheapest fix in creative is re-cutting the first three seconds of something that already holds attention.
Both are ratios of engagement, not of outcomes. Neither predicts conversion on its own, which is why they belong beside cost per result rather than in place of it. Interpreting them without accurate conversion data attached is guesswork — see why event match quality drops for how measurement decay masquerades as creative decline.
Benchmarks worth using
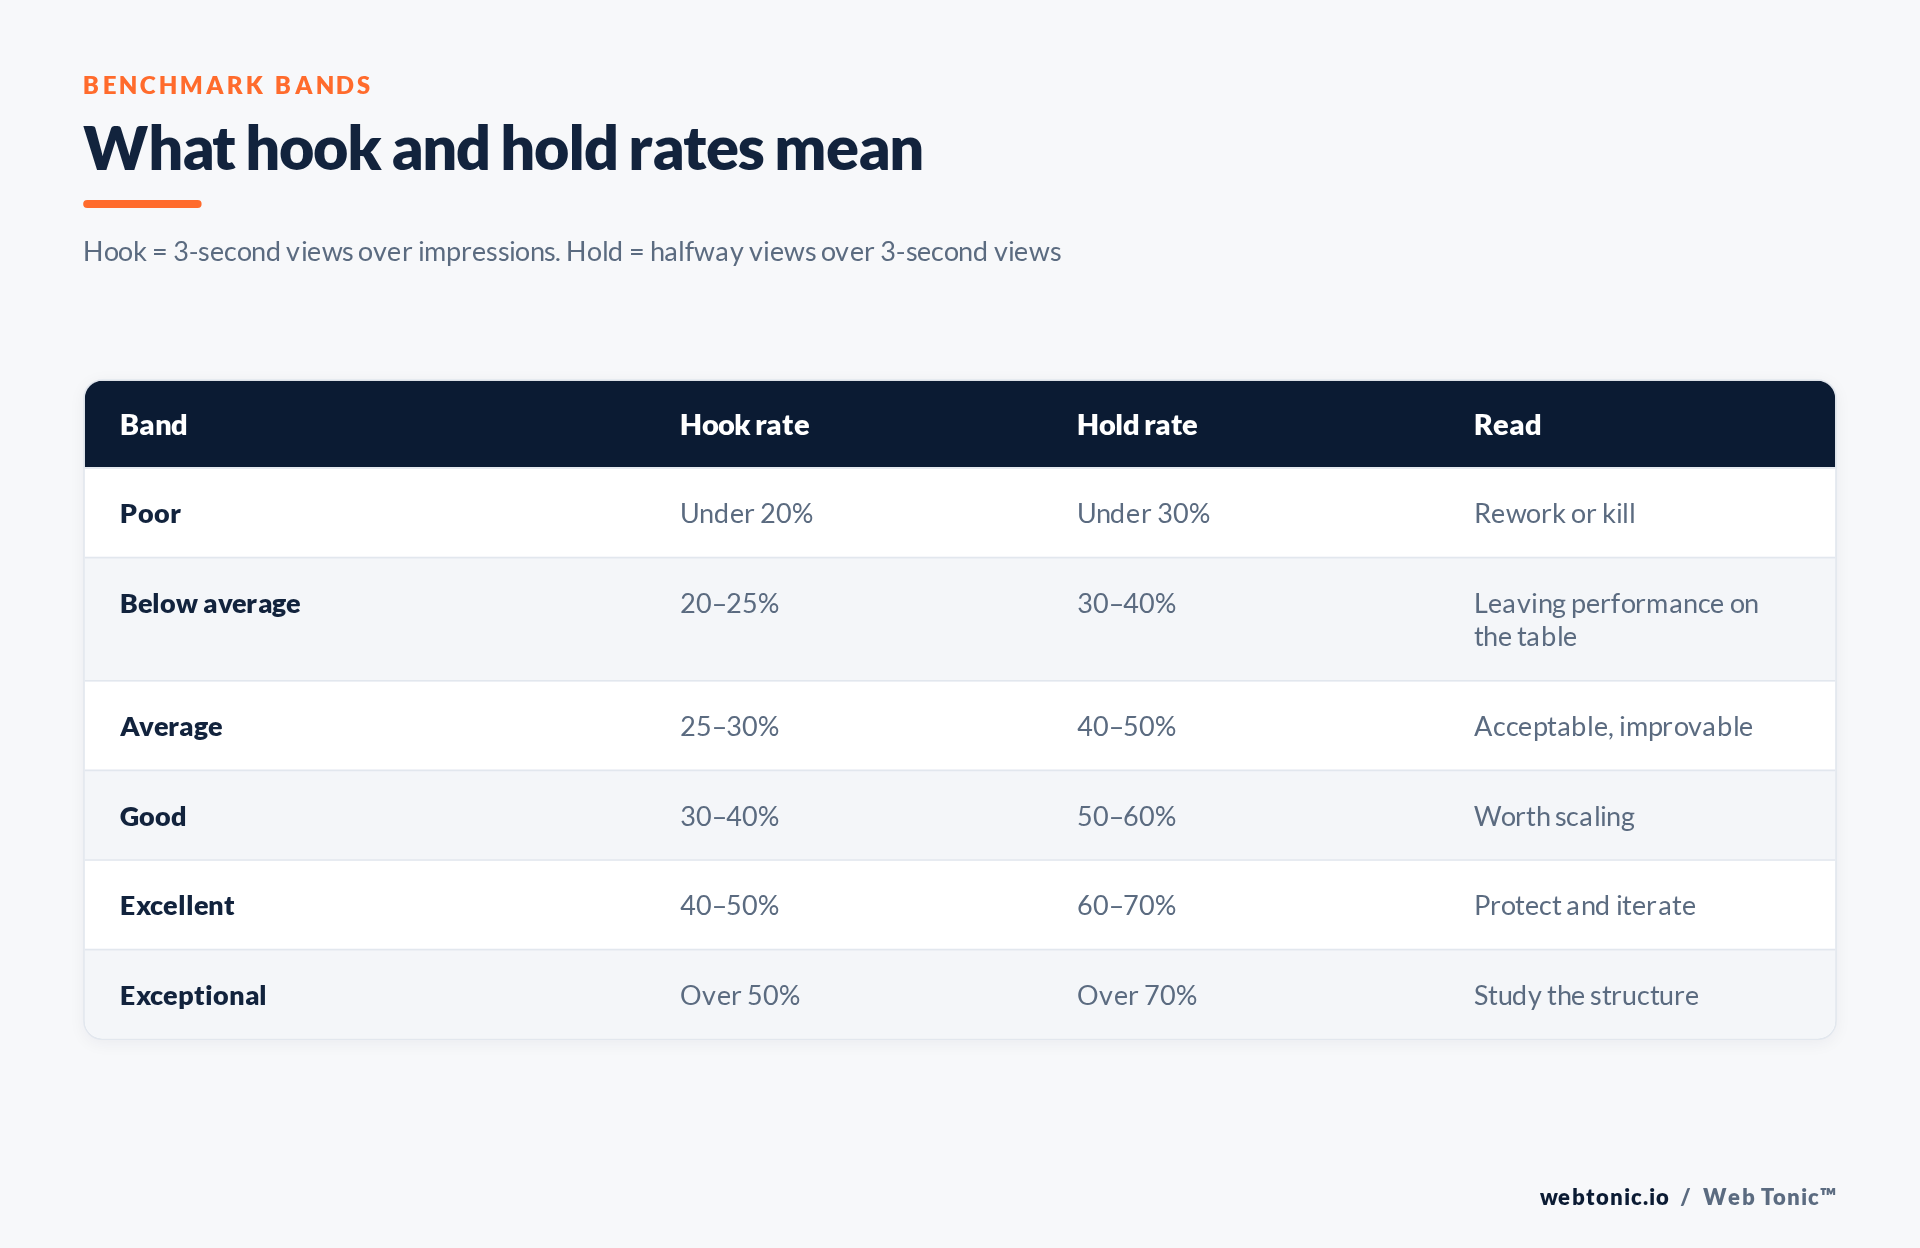
Typical hook rates cluster between 25% and 30%; above 40% is exceptional and below 20% means the opening is not working. Hold rates cluster between 40% and 50%, with 60%+ marking genuinely engaging content. Format shifts the baseline sharply: founder-to-camera and phone-shot UGC routinely reach 35–50% hook rates, while polished brand films sit at 15–25% and should not be judged against UGC numbers.
The comparison that matters is against the same ad's own history, not against a table. A 24% hook rate is unremarkable in the abstract and alarming if that ad ran at 38% three weeks ago.
Diagnosing fatigue in five steps
- Plot the ad's own trend, not a single week. Use a rolling average so that day-of-week and payday effects do not read as decline — the logic of a moving average applies directly here.
- Check frequency alongside it. Fatigue means the same people are seeing the ad repeatedly. Rising frequency with falling hook rate is the classic signature.
- Separate decline from regression. An ad that looked spectacular in its first two days and merely good afterwards may just be exhibiting regression toward the mean, not fatigue.
- Rule out non-creative causes. An audience change, a bidding edit, a budget jump or a broken conversion event all degrade results while hook and hold stay flat. If the engagement ratios are unchanged and the cost per result is not, the creative is innocent.
- Decide refresh versus retire. If hold is still strong, refresh the hook and keep the concept. If both are gone, retire it and bring the next concept forward.
| Signal | What it suggests | Next move |
|---|---|---|
| Hook falling, hold steady | The opening has worn out | New hook, same body |
| Hold falling, hook steady | Body no longer earns attention | Re-edit the middle, tighten pacing |
| Both falling, frequency rising | Genuine audience fatigue | Refresh the concept or widen the audience |
| Both flat, CPA rising | Not a creative problem | Check bidding, audience and tracking |
| Weak from day one | A bad ad, not a tired one | Kill quickly, do not nurse it |
| Strong hook, poor conversion | Mismatch with the landing page | Align the promise end to end |
Common misreadings
Comparing formats against one shared benchmark. A polished brand video judged against UGC hook rates will be cut for doing exactly what it was made to do. Benchmark within format.
Reacting to daily numbers. Small daily samples swing wildly; the concepts behind statistical significance apply to engagement ratios as much as to conversion tests. Judge on rolling windows.
Treating every dip as fatigue. A budget increase pushes delivery into weaker inventory and lowers engagement ratios without the creative changing at all. So does a fresh learning period — see what triggers a learning phase reset.
Assuming the numbers themselves are clean. Reporting is only as reliable as the plumbing behind it; the same discipline documented for reporting in analytics platforms and in the Google Ads reporting API applies to any platform's metrics. Verify before you act.
Diagnosing this properly is routine work in how we run performance creative and Meta Ads, and it leans on solid conversion tracking. More on the blog.
Frequently Asked Questions
What is a good hook rate?
Roughly 25–30% is average, 30–40% is strong and above 40% is exceptional — but only within the same format. Compare an ad most usefully against its own history.
How do I calculate hold rate?
Divide views to the halfway point of the video by three-second views. Reporting the same figure against impressions instead produces a much smaller number and a different meaning.
Do static ads have a hook rate?
Not a video-based one. For statics, use outbound click-through rate and cost per outbound click as the scroll-stopping proxy, and judge the body by conversion rate.
How often should hooks be refreshed on a high-spend ad?
Every two to three weeks is a reasonable cadence at meaningful spend, and sooner if frequency is climbing quickly. Refreshing the hook is far cheaper than replacing the concept.
Can an ad recover after being paused?
Sometimes, if the audience pool has refreshed, but recovery is usually partial and short-lived. Treat a rest period as a small bonus rather than a strategy.
Sources: moving average; regression toward the mean; statistical significance; Google Analytics reporting; Google Ads API reporting. Meta's own video metrics documentation was consulted directly for metric definitions. Last verified 2026-08-21.


