



Table of contents

No public dataset shows native ads driving most e-commerce checkout conversions. The networks do not publish checkout share, and the attribution tools stores use mostly reward the last click, so this page tests the title's claim against what the Census Bureau, Baymard, WordStream, Google and native ad-capture data actually measure in 2025 and 2026.
Key Takeaways
- 0 public datasets report native's share of e-commerce checkouts.
- US e-commerce reached USD 340.2 billion in Q2 2026, adjusted.
- That was 17.1% of total retail sales in the quarter.
- Online sales grew 12.2% year over year versus 6.7% for all retail.
- Baymard's average documented cart abandonment rate is 70.22% across 50 studies.
- OpenAdLibrary's June 2026 index holds 589,036 native creatives.
- Ecommerce is the fourth vertical there, with 13,872 creatives.
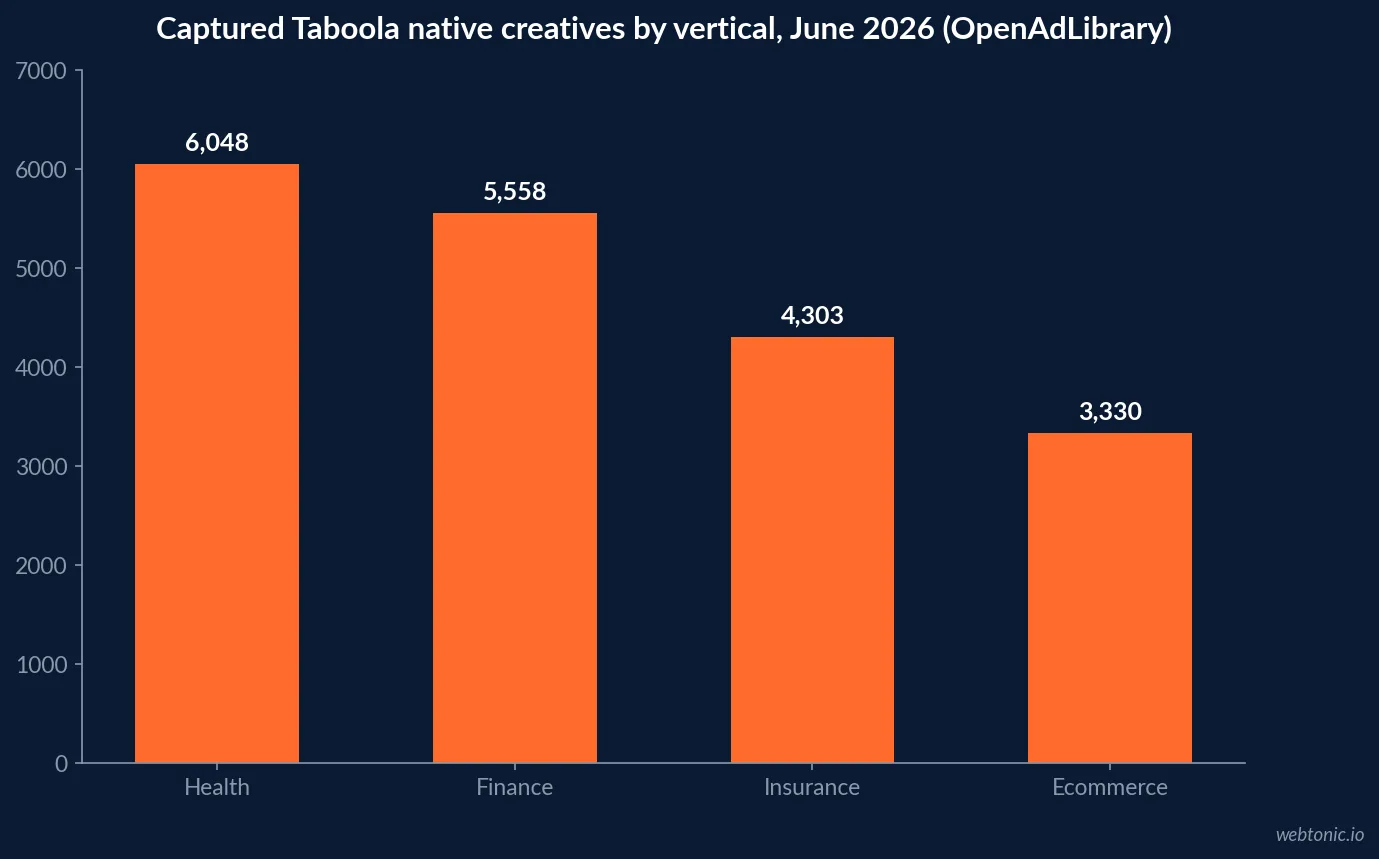
- On Taboola, ecommerce has 3,330 captured creatives, behind health at 6,048.
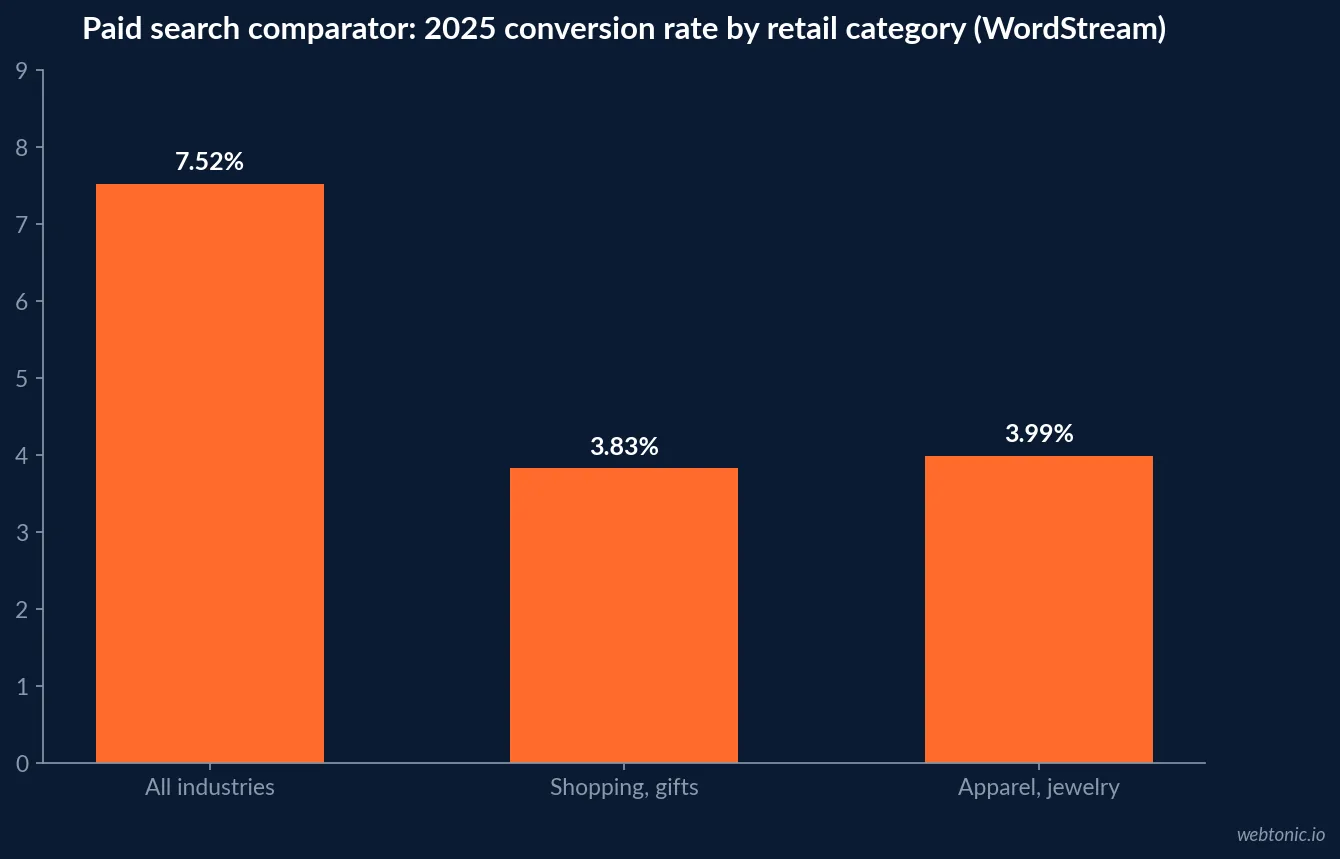
- Paid search shopping sites convert at 3.83% versus 7.52% across all industries (WordStream 2025).
- Taboola reported USD 713.5 million ex-TAC gross profit for 2025.
- GA4 retired 4 rules-based attribution models in November 2023.
Checkout evidence at a glance
Each row below is a figure a store can verify on the issuer's own page. None of them measures native's share of checkouts directly, which is the first finding: the claim in this page's title has no published denominator.
| Metric | Figure | Scope | Issuer |
|---|---|---|---|
| US retail e-commerce sales | USD 340.2 billion | Q2 2026, seasonally adjusted | US Census Bureau |
| E-commerce share of retail | 17.1% | Q2 2026, adjusted | US Census Bureau |
| Cart abandonment, average | 70.22% | 50 studies, updated Sept 22, 2025 | Baymard Institute |
| Ecommerce native creatives | 13,872 | June 2026 capture, 42 networks | OpenAdLibrary (vendor) |
| Native share of checkouts | Not published | Any period | No issuer |
Why the title claim cannot be confirmed
Checkout credit is decided by an attribution model, not by the ad format. Google Analytics 4 currently offers three models in its attribution reports: data-driven, paid and organic last click, and Google paid channels last click. Google's help page states that the first click, linear, time decay and position-based models are no longer available as of November 2023. Under either last-click model, a shopper who read a sponsored article on Monday and searched the brand on Thursday is credited to the search.
Native networks do not fill that gap with a public figure. OpenAdLibrary, a native-ad spy-tool vendor that captures public native ads across Taboola, Outbrain, MGID, Revcontent, Teads, MediaGo, Yahoo and MSN, writes that CPC, CPA, CTR and ROAS "all live inside an advertiser's ad account" and that nobody outside the account can see them. So the defensible version of the claim is narrower: native can start purchase paths, and only a store's own data-driven or incrementality test can say how many checkouts it closes.
The online pie native competes for
The Census Bureau quarterly e-commerce release of August 18, 2026 put adjusted US retail e-commerce at USD 340.2 billion for Q2 2026, up 3.8% from Q1 and up 12.2% from Q2 2025. Total retail was USD 1,986.5 billion, so online represented 17.1% of all retail sales. Census also notes the report was superseded on September 28, 2026 by revised estimates due in the November 19 release.
| Census series | Q2 2026 value | Change | Note |
|---|---|---|---|
| E-commerce sales, adjusted | USD 340.2 billion | +3.8% vs Q1 2026 | Not adjusted for price |
| E-commerce sales, year over year | USD 340.2 billion | +12.2% vs Q2 2025 | Margin of error ±0.9% |
| Total retail sales | USD 1,986.5 billion | +2.9% vs Q1 2026 | All channels |
| Total retail, year over year | USD 1,986.5 billion | +6.7% vs Q2 2025 | Margin of error ±0.5% |
| E-commerce share of retail | 17.1% | Adjusted basis | Unadjusted share 16.4% |
Who ecommerce shares the feed with
OpenAdLibrary's ecommerce study, a count from the native-ad spy-tool vendor's own index dated July 3, 2026, draws on an index of 589,036 distinct native creatives from 25,933 advertisers and 5.4 million observations across 42 networks as of June 2026. Ecommerce is the fourth-largest vertical in that corpus at 13,872 creatives. On Taboola, the largest network in the index at 157,727 creatives, ecommerce ranks fourth with 3,330, behind health (6,048), finance (5,558) and insurance (4,303). Outbrain shows the same order at smaller scale, with ecommerce at 1,479 creatives out of 84,252.
A later snapshot of the vendor's own index, published in its August 2026 conversion-rate note, counts 725,882 live creatives across 49 networks as of July 2026 and puts ecommerce at 19,368 classified creatives. The two counts differ because the index grew between June and July; quote each with its month. Both are counts of ads, not of sales.
| Network (June 2026) | Total captured creatives | Ecommerce creatives | Ecommerce rank |
|---|---|---|---|
| Taboola | 157,727 | 3,330 | 4th, behind health, finance, insurance |
| Outbrain (now Teads) | 84,252 | 1,479 | 4th, behind finance, insurance, health |
| All 42 networks | 589,036 | 13,872 | 4th vertical overall |
| All 49 networks (July 2026) | 725,882 | 19,368 | 4th, behind health, finance, insurance |
What a native click is worth at checkout
OpenAdLibrary's method note argues there is no trustworthy universal conversion rate for native ads, because a sweepstakes email submit and a USD 120 purchase are both counted as conversions. Its qualitative ranking places ecommerce purchase funnels in a low conversion class, above only high-ticket qualified actions. The note's replacement is arithmetic: breakeven conversion rate equals cost per click divided by allowable cost per acquisition. Its own worked example, a USD 0.48 click against a USD 24 allowable CPA, gives a 2% breakeven rate.
For a store, the allowable CPA comes from margin, not from a benchmark. A product with USD 30 of contribution margin bought through USD 0.48 clicks needs about 1.6% of native visitors to buy before the campaign stops losing money on a last-click view.
The paid search comparator
Search is the channel native is usually compared with at checkout, so its retail figures are the closest public yardstick. WordStream's 2025 Google Ads benchmarks (vendor data, 16,446 US campaigns from April 2024 to March 2025, medians) report an all-industry conversion rate of 7.52%. Retail categories sit well below that: shopping, collectibles and gifts convert at 3.83% and apparel, fashion and jewelry at 3.99%. These are search figures, labelled as such; they are not native rates.
| Search category, 2025 | CTR | CPC | Conversion rate | Cost per lead |
|---|---|---|---|---|
| All industries | 6.66% | USD 5.26 | 7.52% | USD 70.11 |
| Shopping, collectibles and gifts | 8.92% | USD 3.49 | 3.83% | USD 47.94 |
| Apparel, fashion and jewelry | 6.77% | USD 4.31 | 3.99% | USD 101.49 |
Where the sale is usually lost
Whatever brings the shopper in, most carts do not close. Baymard Institute calculates an average documented cart abandonment rate of 70.22% from 50 studies, last updated September 22, 2025. That figure is format-neutral: it applies to native, search and social visitors alike. It is also the clearest reason to judge native on assisted paths rather than on closed orders, because a native visitor who abandons and later returns through a branded search will rarely appear in native's last-click column.
How the two big networks describe their own scale
Vendor financials show money moving through open-web native, though not into checkouts specifically. Taboola reported 2025 ex-TAC gross profit of USD 713.5 million, against USD 667.5 million in 2024, and describes Realize as reaching over 600 million daily active users. Teads, the company formed when Outbrain acquired Teads in February 2025, reported 2025 revenue of USD 1,300.5 million, up 46%, "primarily due to the Acquisition". Both are company-reported figures. Neither company breaks out e-commerce checkouts.
| Company figure, FY2025 | Value | Prior year | What it does not tell a store |
|---|---|---|---|
| Taboola ex-TAC gross profit | USD 713.5 million | USD 667.5 million | Share earned from retail advertisers |
| Taboola daily active reach | 600 million-plus | Not stated | Share who shop after clicking |
| Teads revenue | USD 1,300.5 million | USD 889.9 million | Organic growth, since the rise is mostly the merger |
Native next to Google's feed formats
Stores weighing open-web native usually also look at feed formats inside the big platforms. Google's Demand Gen help page describes campaigns that run across YouTube including Shorts, Discover, Gmail, Maps and the Google Display Network and can reach up to 3 billion monthly active users, with product feeds available for shoppable creative. That reach figure is Google's own, for a comparator format. It shows the scale native competes against, not a conversion advantage for either side.
The broader market context is the IAB/PwC full-year 2025 report: US digital ad revenue reached nearly USD 300 billion, up 13.9% year over year. The public summary page does not break out native as its own line, so any native-share-of-spend figure for retail would have to come from elsewhere.
Disclosure rules for shoppable native
Product-led native formats sit close to editorial content, which is where the FTC draws its line. The FTC's guide for businesses states that an ad is deceptive if it promotes goods or services but is not readily identifiable to consumers as an ad, and that any necessary disclosure must be clear and prominent. The Enforcement Policy Statement on Deceptively Formatted Advertisements was issued on December 22, 2015 after a 4-0 Commission vote. Product reviews embedded in native units also fall under the Endorsement Guides at 16 CFR Part 255, revised at 88 FR 48102 on July 26, 2023, which define clear and conspicuous as difficult to miss and easily understandable.
| Rule | Requirement | Date | Issuer |
|---|---|---|---|
| Native ad identifiability | Ad must be identifiable as an ad before the click | Guide, 2015 | FTC |
| Deceptively formatted ads | Format cannot mislead about commercial nature | Dec 22, 2015 (4-0) | FTC |
| Endorsements and reviews | Material connections disclosed clearly and conspicuously | July 26, 2023 | FTC, 16 CFR 255 |
How to test the claim in your own store
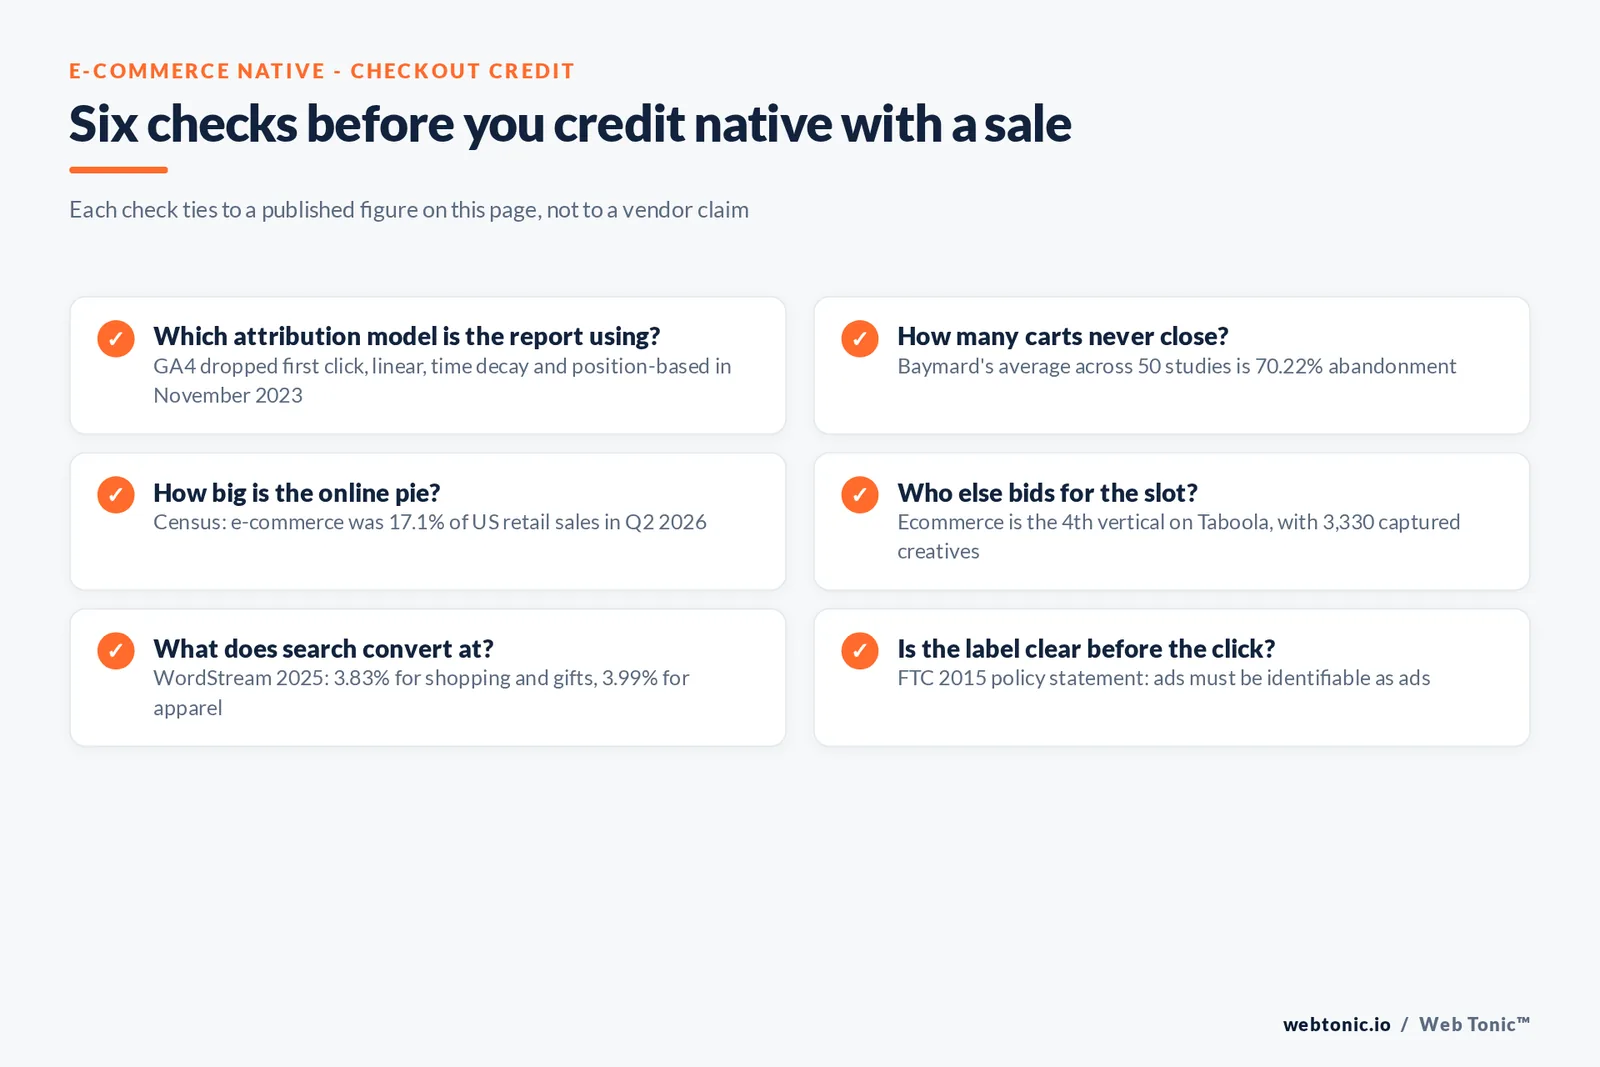
- Switch GA4 reporting to data-driven attribution before judging native, since last click gives upper-funnel clicks 0% credit.
- Run a geo or audience holdout for at least two purchase cycles and compare total orders, not native-attributed orders.
- Price native against breakeven: CPC divided by allowable CPA, using your margin.
- Count assisted checkouts separately from last-click checkouts in every report.
- Label every unit with "Ad" or "Sponsored" before the click, per the FTC guide.
For the cross-industry market picture, see our native advertising statistics. Search-side benchmarks for stores are in our e-commerce enterprise SEO data, and attribution setup is covered by our data intelligence team. Creative for native placements is briefed by our performance creative group.
Frequently Asked Questions
Do native ads drive most e-commerce checkout conversions?
No public dataset shows that. Native networks do not publish checkout share, OpenAdLibrary states that CPC, CTR, CPA and ROAS live inside advertiser accounts, and last-click reports usually credit the final search or direct visit. Treat the claim as a hypothesis to test in your own attribution data, not as a benchmark.
What conversion rate should an online store expect from native traffic?
There is no trustworthy universal figure. OpenAdLibrary's August 2026 method note says any single average native conversion rate misleads, and that ecommerce purchase funnels sit in a low conversion class. Compute breakeven instead: cost per click divided by allowable cost per acquisition. At USD 0.48 and USD 24 that is 2%.
How crowded is native inventory for e-commerce brands?
In OpenAdLibrary's June 2026 index of 589,036 creatives, ecommerce was the fourth-largest vertical with 13,872 creatives. On Taboola it ranked fourth with 3,330, behind health, finance and insurance, so stores compete for slots with high-margin lead-gen offers.
Which attribution model gives native fair credit?
Google Analytics 4 now offers data-driven, paid and organic last click, and Google paid channels last click; first click, linear, time decay and position-based were retired in November 2023. Data-driven attribution is the only GA4 option that can assign partial credit to an upper-funnel native click.
Do shoppable native ads need an Ad label?
Yes. The FTC's native advertising guide says an ad is deceptive if it is not readily identifiable as an ad, and any needed disclosure must be clear and prominent. The 2015 enforcement policy statement was approved 4-0 and remains the operative guidance.
Sources
US Census Bureau, Quarterly Retail E-Commerce Sales, Q2 2026
Baymard Institute, Cart Abandonment Rate Statistics (updated Sept 2025)
OpenAdLibrary, Native Ad Benchmarks for Ecommerce (July 2026)
OpenAdLibrary, Native Ads Conversion Rate Benchmarks (Aug 2026)
WordStream, Google Ads Benchmarks 2025
Google Analytics Help, attribution models
Google Ads Help, Demand Gen campaigns
Taboola, Q4 and full year 2025 results
Teads, Q4 and full year 2025 results
IAB/PwC Internet Advertising Revenue Report, full year 2025
FTC, Native Advertising: A Guide for Businesses
FTC, Enforcement Policy Statement on Deceptively Formatted Advertisements (2015)
eCFR, 16 CFR Part 255 Endorsement Guides


