



Table of contents
A pest control app costs USD 99 a year to list on the App Store and USD 25 once on Google Play; ASO tools add USD 15 to USD 549 a month at list price. Those are the only published cost lines. Before any of them, most pest firms should ask whether customers would install an app at all.
Key Takeaways
- Apple's Developer Program costs USD 99 per membership year.
- Google Play charges a USD 25 one-time registration fee.
- MobileAction lists plans at USD 15, 69 and 239 a month, billed monthly.
- AppTweak lists USD 79, 299 and 549 a month, billed monthly.
- 16,565 US pest control firms operated in 2025 (NPMA).
- 81.4% of them run one or two locations.
- Industry service revenue reached USD 13.416 billion in 2025, up 6%.
- Apple Ads all-category CPA was USD 2.51 in 2025 (MobileAction).
Who in pest control would budget for an app
NPMA, citing Specialty Consultants, reports USD 13.416 billion of structural pest control service revenue in 2025, a 6% increase on 2024's USD 12.654 billion, from 16,565 firms. It adds that 81.4% ran one or two locations, that the industry employed about 109,384 service technicians, and that 36.8% of respondents said growth was constrained by a shortage of technicians.
That profile explains the app landscape. The apps that matter most in this trade are technician-facing field-service tools, supplied by software vendors, not consumer apps searched in the store. A branded customer app is realistic only for large route-based operators with recurring service plans.
| Industry fact (NPMA 2025) | Figure | Budget implication |
|---|---|---|
| Structural pest control service revenue | USD 13.416 billion | Large market, mostly local buyers |
| Growth on 2024 | 6% | Demand is rising, not app demand specifically |
| Pest control firms | 16,565 | Few will each justify an app |
| Firms with one or two locations | 81.4% | Web booking usually beats an app |
| Service technicians | 109,384 | Field apps serve this audience |
| Firms constrained by technician supply | 36.8% | Tech tools may earn more than consumer ASO |
Technician apps and customer apps are different budgets
When pest control operators talk about "our app", they usually mean the field-service software their technicians carry: routes, service tickets, chemical logs, photos and invoices. Those apps are bought as part of a software subscription, distributed to staff, and never need to rank in a store search. Their budget line is the software licence, and no amount of App Store optimization changes it.
A customer app is a separate decision. It only earns an ASO budget when customers have a reason to open it between visits, for example to reschedule a quarterly treatment, approve an add-on service, pay an invoice or read the technician's notes. Firms that sell one-off treatments usually get the same result from a web portal and text reminders, with no store fees and no listing to maintain.
| App type | Who installs it | How it is paid for | Does ASO apply |
|---|---|---|---|
| Technician field-service app | Staff | Software subscription | No, distributed internally |
| White-label customer portal app | Existing customers | Often bundled with software | Only the app name and icon |
| Branded customer app | Existing and new customers | Store fees plus build and upkeep | Yes, brand and service terms |
| Web portal with text reminders | Existing customers | Website and messaging costs | No store listing at all |
Fixed store fees: the unavoidable lines
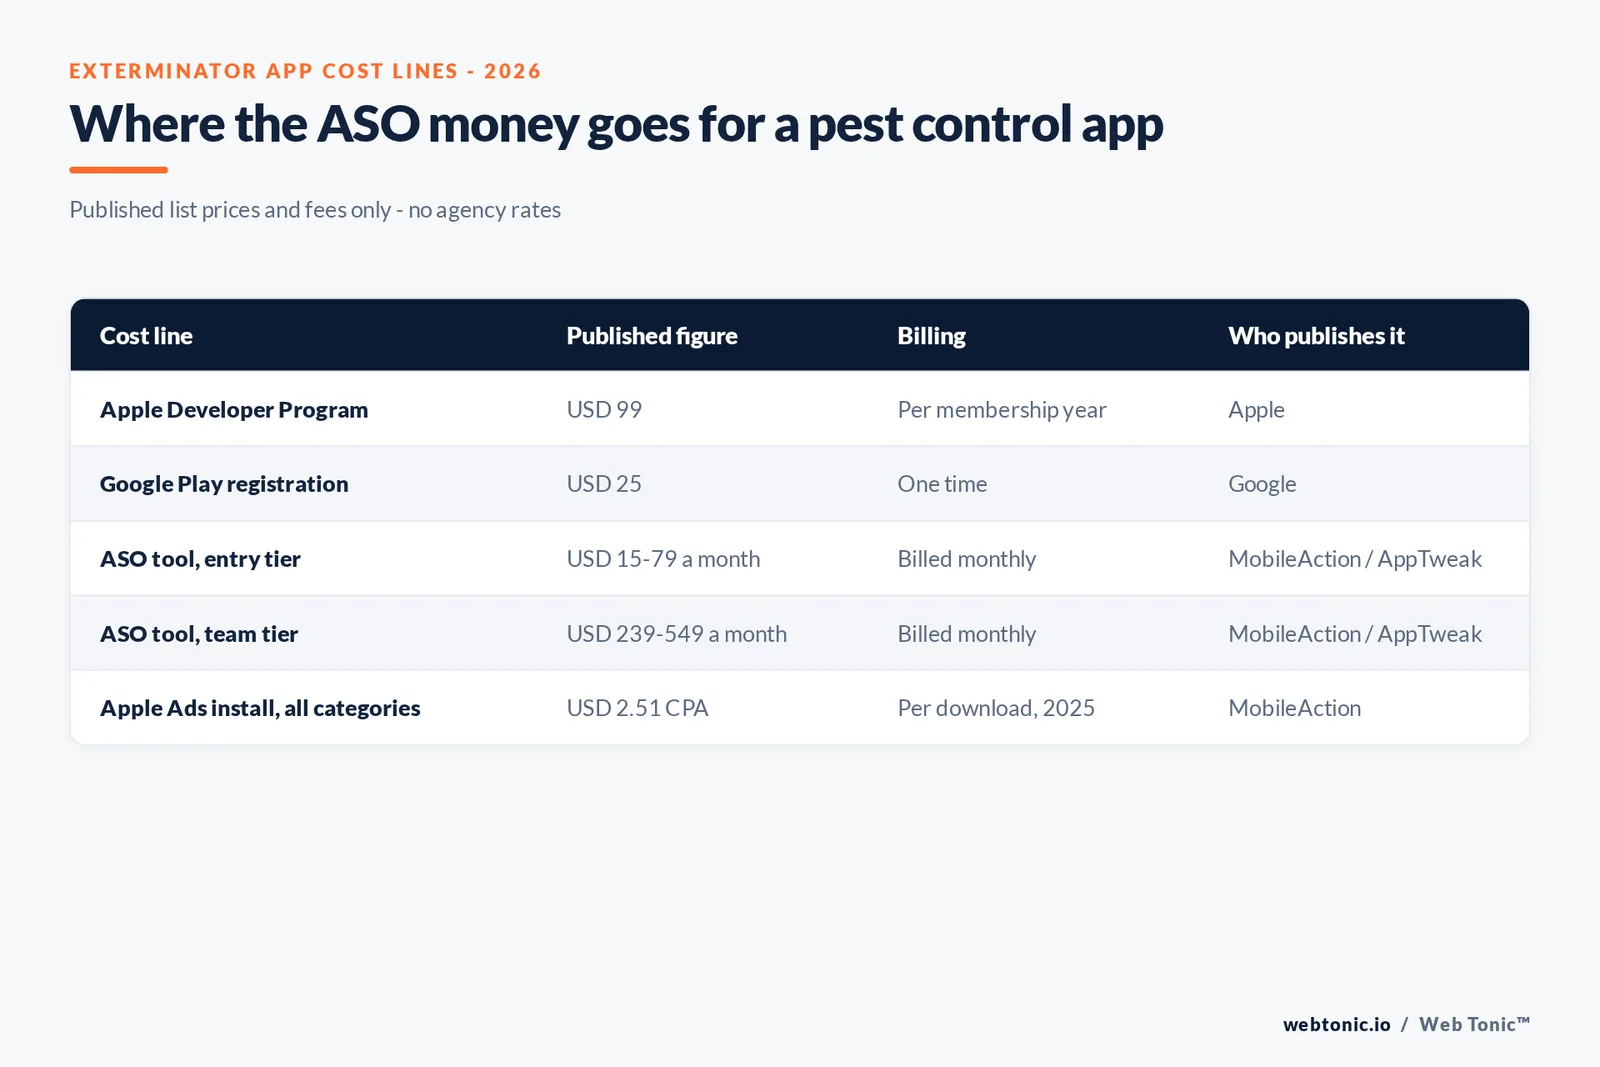
Apple's Developer Program is USD 99 per membership year, and Apple states commission on the sale of digital goods and services separately. Pest control is a physical service, so a customer paying for a treatment inside the app is not buying a digital good. Google Play charges a US$25 one-time registration fee.
Together those come to USD 124 in year one and USD 99 a year after. They are the only costs every pest control app shares.
| Store cost line | Published amount | Billing | Issuer |
|---|---|---|---|
| Apple Developer Program | USD 99 | Per membership year | Apple |
| Google Play developer registration | USD 25 | One time | |
| Year-one total, both stores | USD 124 | Sum of the two | Calculated from the above |
| Each later year | USD 99 | Apple renewal only | Calculated from the above |
ASO tool list prices, from vendor pages
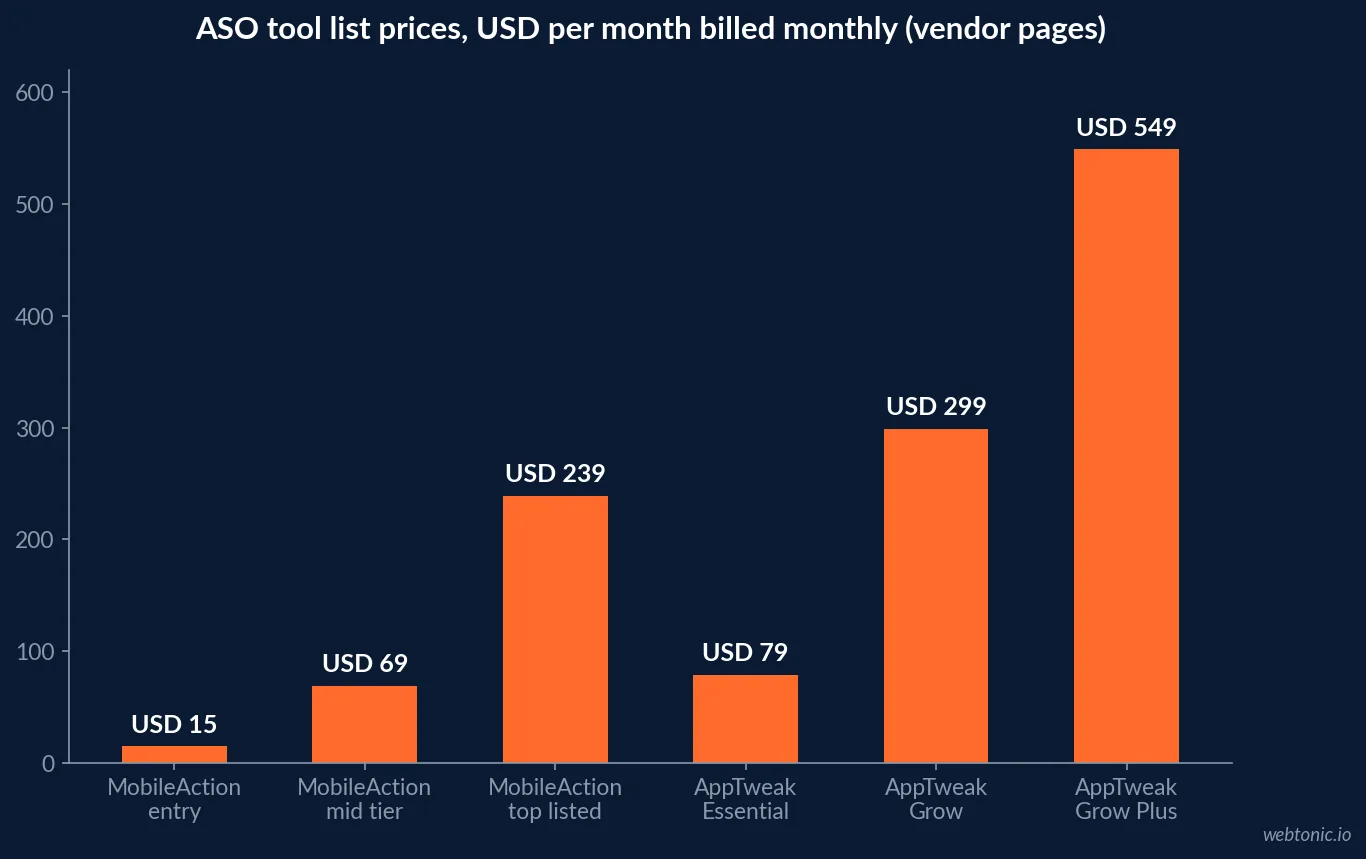
Tools are optional for a single app with mostly branded traffic, but they are the next budget line most teams look at. On its pricing page, MobileAction lists plans at USD 15, USD 69 and USD 239 a month billed monthly, with lower monthly equivalents on annual billing. AppTweak's pricing page lists Essential at USD 79, Grow at USD 299 and Grow Plus at USD 549 a month billed monthly, or USD 949, USD 3,590 and USD 6,590 billed annually.
| Tool and plan | Monthly, billed monthly | Billed annually | Fit for a pest control app |
|---|---|---|---|
| MobileAction entry plan | USD 15 | Lower monthly equivalent | Keyword tracking for one app |
| MobileAction mid plan | USD 69 | Lower monthly equivalent | Adds competitor watching |
| MobileAction top listed plan | USD 239 | Lower monthly equivalent | Rarely needed for one service app |
| AppTweak Essential | USD 79 | USD 949 a year | Individuals, one app |
| AppTweak Grow | USD 299 | USD 3,590 a year | Startups and growing teams |
| AppTweak Grow Plus | USD 549 | USD 6,590 a year | Teams scaling several apps |
Twelve-month tool cost at list price
Annualised from the monthly list prices above, an entry plan runs USD 180 a year on MobileAction's USD 15 tier or USD 948 on AppTweak's USD 79 tier billed monthly, which is why AppTweak's USD 949 annual price is effectively the same as paying monthly for Essential. A top-listed plan runs USD 2,868 (MobileAction, 12 x USD 239) to USD 6,588 (AppTweak, 12 x USD 549). For a pest firm, those upper tiers only make sense if the app is a real acquisition channel, which the data above suggests is rare.
Paid App Store search: labelled comparators
No source publishes pest control Apple Ads costs. The closest labelled figures come from vendors' client bases. MobileAction's 2026 benchmark puts the all-category search results CPA at USD 2.51 in 2025, with quarterly CPA of USD 2.12, 2.11, 2.53 and 3.28. SplitMetrics reports a USD 2.25 average cost per tap and USD 3.76 CPA across its top 15 categories in 2025.
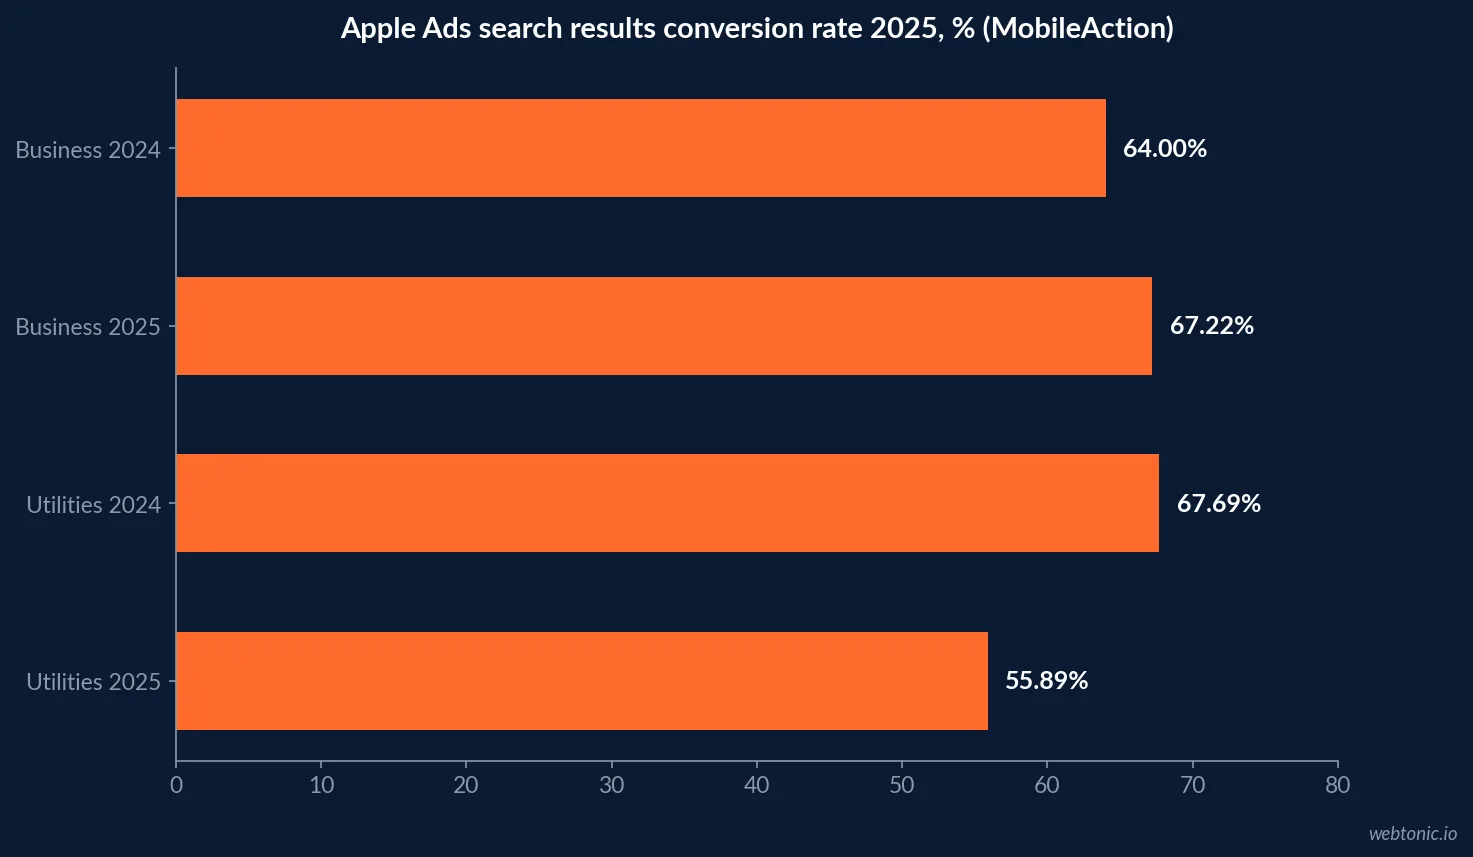
Service-business apps are usually filed under Business, Utilities or Lifestyle. MobileAction's conversion data shows Business rising to 67.22% from 64.00% and Utilities falling to 55.89% from 67.69% between 2024 and 2025.
| Apple Ads comparator, 2025 | Figure | Scope | Vendor |
|---|---|---|---|
| Search results CPA, all categories | USD 2.51 | Client base | MobileAction |
| Search results CPA, Q4 | USD 3.28 | Client base | MobileAction |
| Cost per tap, top 15 categories | USD 2.25 | Client base | SplitMetrics |
| CPA, top 15 categories | USD 3.76 | Client base | SplitMetrics |
| Business conversion rate | 67.22% | Category | MobileAction |
| Utilities conversion rate | 55.89% | Category | MobileAction |
Free testing features that replace some tool spend
Both stores include testing at no charge. Apple's product page optimization tests up to three alternate treatments, and Google Play's store listing experiments A/B test graphics and localized text. For an app with a small audience, these built-in features may be all the testing budget that is justified. The limit is traffic rather than features: a test needs enough product page visitors to reach a result, and a local service app with a few hundred visitors a month may wait the full 90-day window Apple uses for its duration estimate before any treatment can be called.
Reach numbers that frame the spend
Apple's 2025 Transparency Report lists 2,172,472 apps and 463,575,966 weekly searching accounts, and Apple Ads says almost 65% of downloads happen after a search. In a store that crowded, a local pest brand is found almost only by customers who already know its name, which is another reason to keep the tool budget small.
Budgeting for two stores or one
Statcounter puts US mobile share at 60.68% iOS and 39.29% Android in August 2026, and the Pew Research Center reports that 91% of US adults own a smartphone. Shipping on only one store saves the USD 25 Play fee but leaves roughly two in five customers' phones out. For a customer app the saving is rarely worth it; the real cost of the second store is testing and maintaining a second listing.
What the budget cannot buy: published benchmarks
No tool plan comes with a pest control benchmark, because none is published. We found no study giving an app conversion rate, ranking or install volume for this industry. Budget for measurement of your own funnel in App Store Connect and the Play Console rather than for comparison against a number that does not exist.
In practice that means the most useful spend is often not a tool at all but a few hours of set-up: tagging the links in service reminders and invoices so App Store Connect and the Play Console show which messages produce installs, and connecting the app's bookings to the field-service software so reschedules and add-on approvals can be counted. Once those numbers exist, a team can judge whether a paid keyword tool would add anything. Without them, even the cheapest plan is paying to watch rankings for searches that a local pest brand's customers rarely make, since most of them will look up the company by name.
A lean budget order for a pest control app
- Confirm the use case: recurring-plan customers who reschedule, pay and read service notes.
- Pay the store fees: USD 99 a year and USD 25 once.
- Use free testing on both stores before buying any tool.
- Add an entry-tier tool only if you track non-brand keywords.
- Treat Apple Ads CPA figures as comparators, and cap brand-term bids.
- Review after 90 days against your own baseline.
For cross-industry store data, see our app store optimization statistics. If paid channels are the bigger question, compare them with our pest control CTV advertising data, or contact us about growth marketing.
Frequently Asked Questions
What does it cost to list a pest control app?
The fixed store fees are small. Apple's Developer Program is USD 99 per membership year and Google Play charges a USD 25 one-time registration fee. The larger costs are building and maintaining the app itself, which no neutral source prices for this industry, plus optional ASO tools and paid search.
How much do ASO tools cost?
On their own pricing pages, billed monthly: MobileAction lists plans at USD 15, USD 69 and USD 239 a month, and AppTweak lists Essential at USD 79, Grow at USD 299 and Grow Plus at USD 549 a month, with annual billing cheaper. A single-app pest firm rarely needs more than an entry tier, if it needs one at all.
Do pest control companies need a customer app?
Most do not. NPMA counts 16,565 US pest control firms in 2025, with 81.4% running one or two locations. The apps common in this trade are technician and field-service tools supplied by software vendors. A customer app makes sense mainly for large route-based operators with recurring plans, where scheduling, invoices and service notes justify an install.
What does paid App Store search cost for a service app?
There is no pest-specific benchmark. Labelled vendor data for 2025: MobileAction measured an all-category Apple Ads CPA of USD 2.51, and SplitMetrics a USD 3.76 top-15-category average. Business apps converted taps to downloads at 67.22% and Utilities at 55.89% in MobileAction's 2025 data. Use them as comparators only.
Is there a published pest control app conversion rate?
No. We found no study that publishes an app store conversion rate, ranking or install benchmark for pest control apps, and we do not estimate one. Measure your own product page views and downloads in App Store Connect and the Play Console instead.
Sources
NPMA - US pest control industry grows 6% in 2025
Apple - Developer Program pricing and fees
Google Play - Developer account registration
MobileAction - Pricing
AppTweak - Pricing
MobileAction - Apple Ads 2026 benchmark, CPA
MobileAction - Apple Ads 2026 benchmark, conversion rate
SplitMetrics - Apple Ads cost benchmarks 2025
Apple - Product page optimization
Apple - App Store Transparency Report 2025
Apple Ads - App Store
Statcounter - US mobile OS share
Pew Research Center - Mobile fact sheet


