



Table of contents
Fitness brands using X (Twitter) ads face a median CPC of $0.74 and engagement rates of 2.2% for fitness creators — making it one of the most cost-efficient paid social channels available. Here is every stat you need to benchmark your fitness X ads strategy in 2026.
Key Takeaways
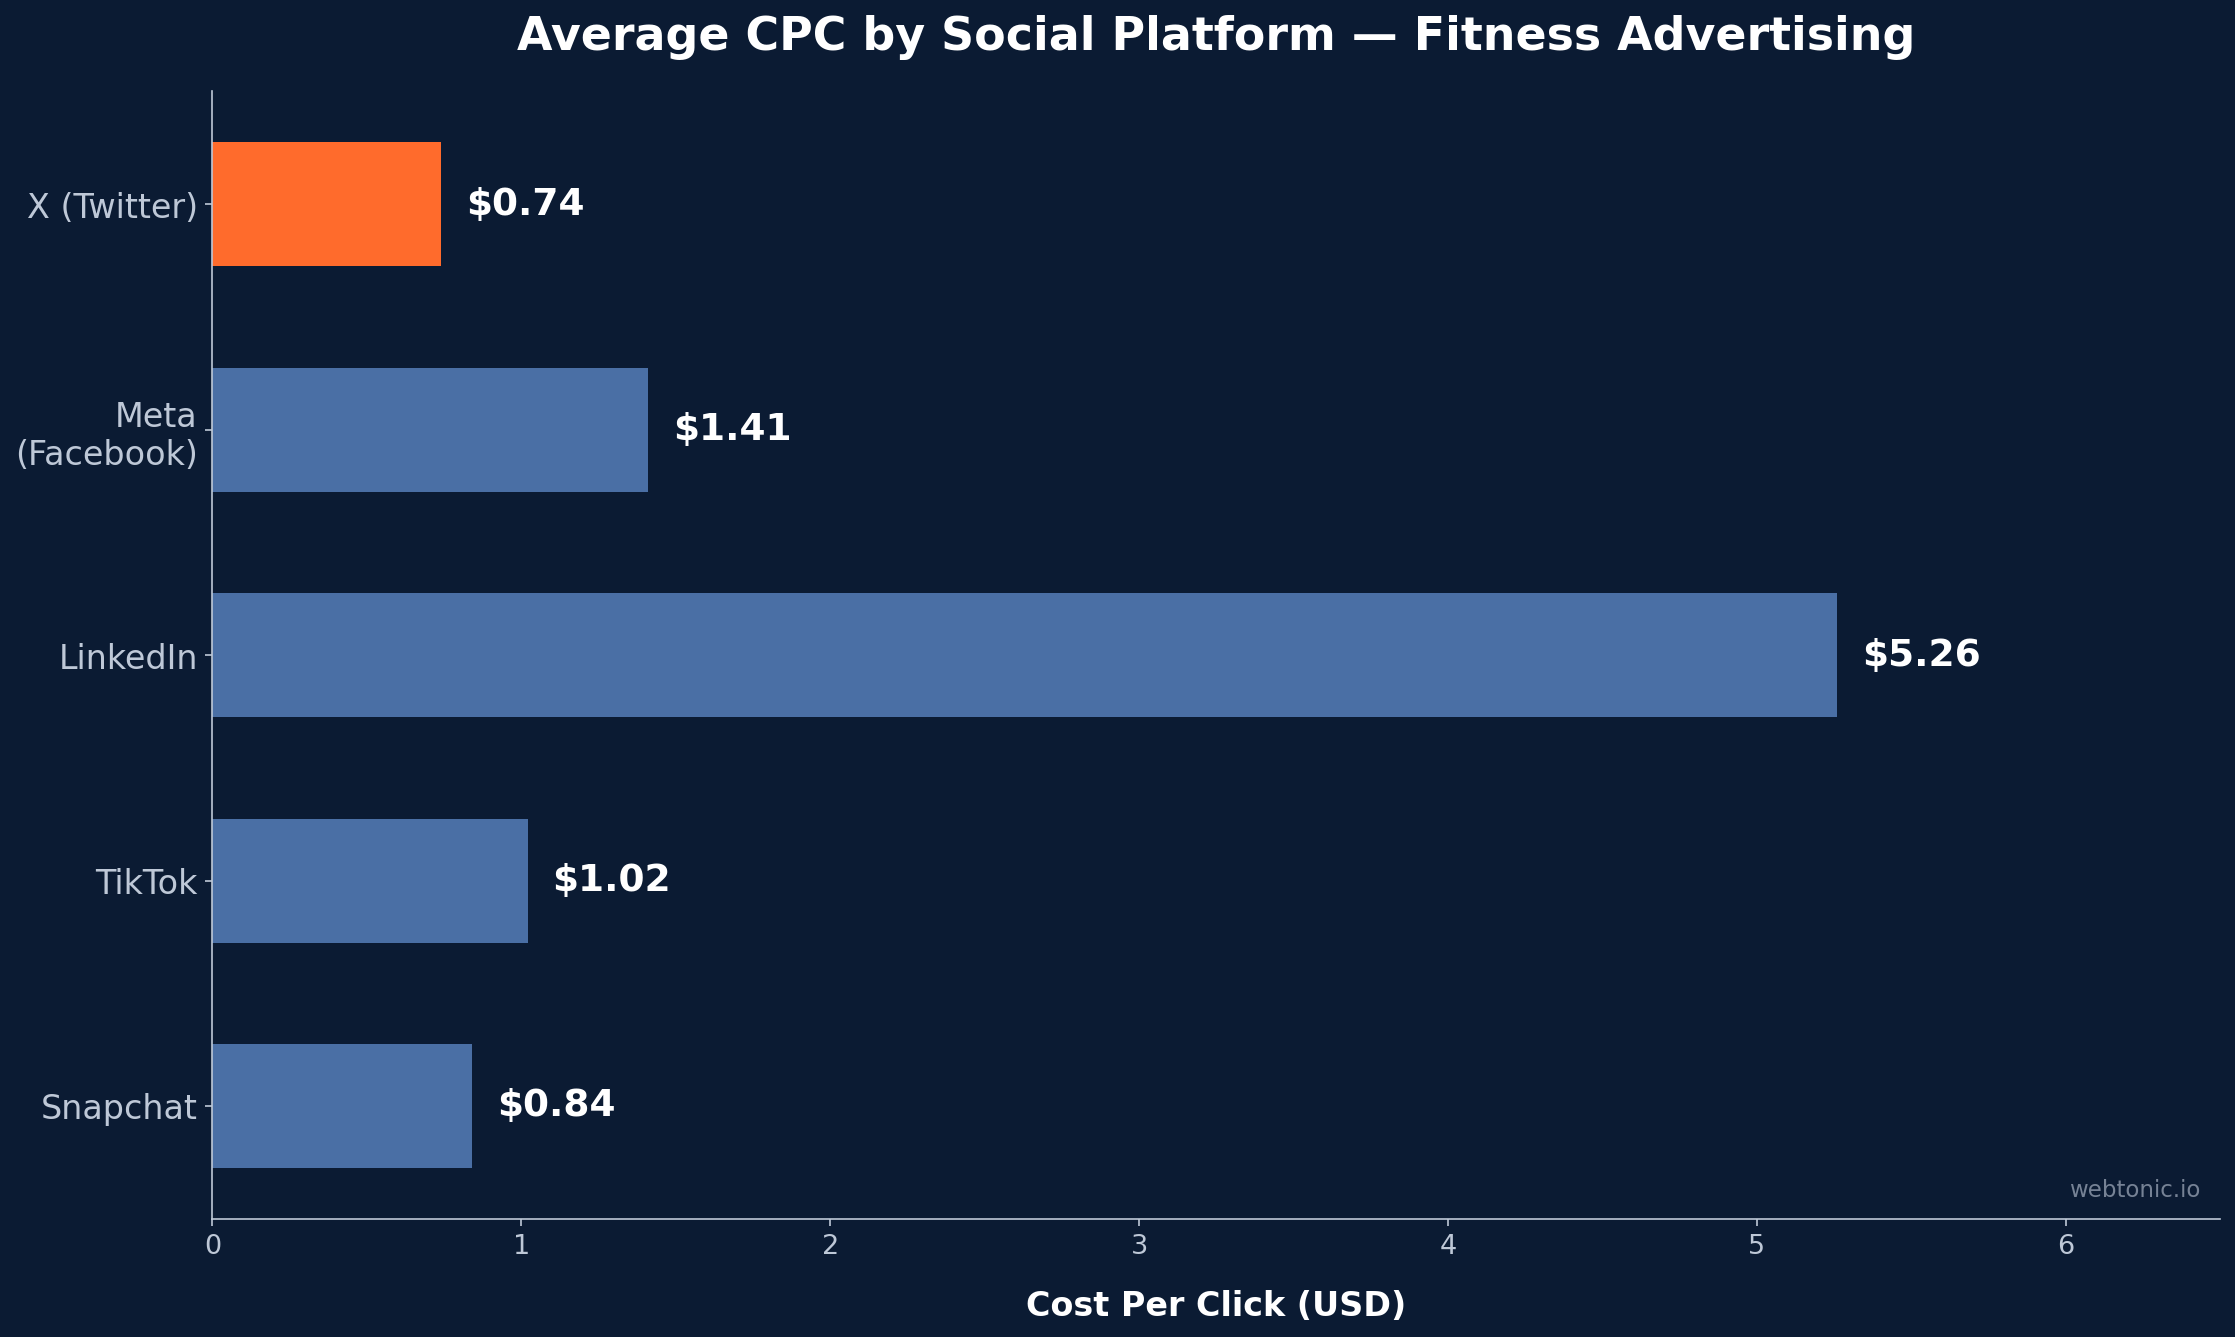
- X ads deliver a median CPC of $0.74, roughly 47% cheaper than Meta's $1.41 CPC (Hootsuite).
- Fitness creators average a 2.2% engagement rate on X, more than 5× the platform-wide 0.39% average (UseSnippet, SocialNexis).
- Every $1 spent on X ads returns an average of $2.70, nearly 40% above the cross-channel median (X / Spiralytics).
- X reached 611 million monthly active users in 2026, with 37.5% in the 25-34 age bracket — the prime gym-going demographic (SocialNexis).
- Micro-influencers in the fitness niche achieve a 7.2% engagement rate, the highest of any vertical on the platform (WorldMetrics).
X (Twitter) Ads Cost Benchmarks for Fitness Brands
Understanding how much fitness brands pay per click, impression, and engagement on X is the starting point for any campaign budget. These benchmarks combine platform-wide medians with fitness-specific adjustments reported across multiple studies in 2025 and early 2026.
| Metric | X Ads Benchmark | Meta Ads Comparison | Source |
|---|---|---|---|
| Median CPC | $0.74 | $1.41 | Hootsuite |
| Median CPM | $2.09–$5.65 | $2.53 | Hootsuite / SearchLab |
| Median CPE | $0.13 | N/A | EnrichLabs |
| Cost per Follow | $2.50–$3.50 | N/A | IntelligentHQ |
| Average CPL | $41.00 | $44.50 (fitness) | SearchLab / CuFinder |
| Promoted First Action | $0.26–$0.50 | Varies | WebFX |
| Avg. Campaign Spend | $385/mo | Varies | EnrichLabs |
At $0.74 per click, X offers fitness brands a cost advantage of nearly 47% over Meta's average CPC of $1.41. The platform's $2.09 CPM similarly undercuts Meta's $2.53, though the range can extend to $5.65 depending on targeting. For fitness brands with limited budgets, X's $385 average monthly campaign spend makes it one of the most accessible paid social entry points — significantly lower than the typical Meta or Google Ads starting budget. The $41 cost per lead also compares favorably to the fitness industry's broader $44.50 CPL benchmark (CuFinder).
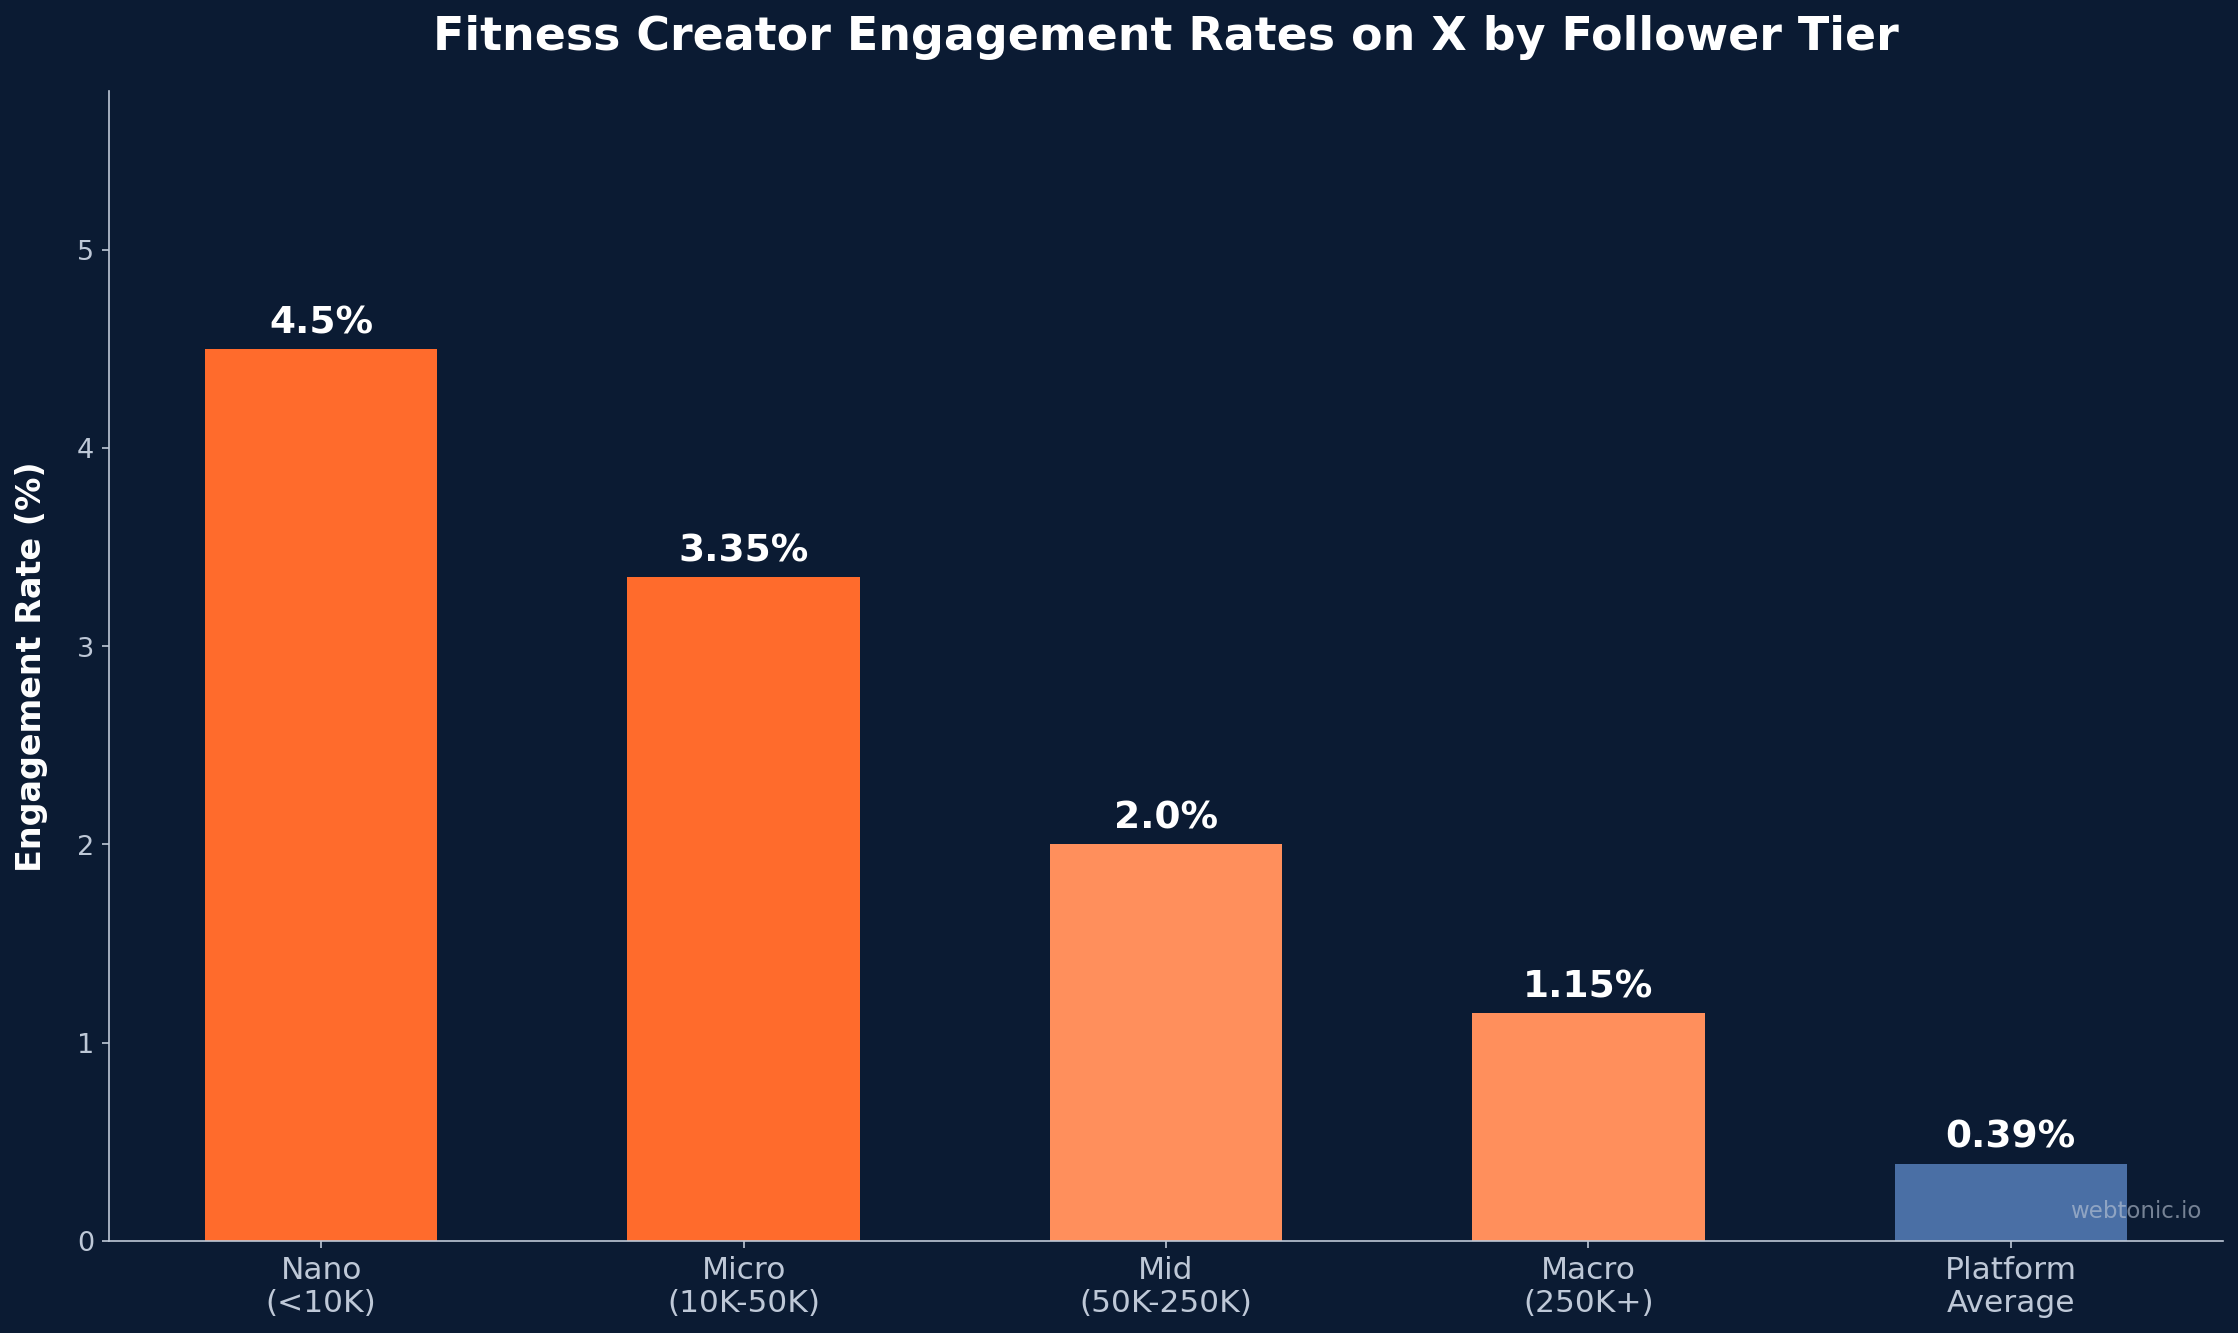
Fitness Creator Engagement Rates on X
Engagement is where X stands apart for fitness marketers. While the platform-wide average sits at just 0.39% per post (SocialNexis), fitness-specific content performs dramatically better — fueled by real-time workout threads, challenge hashtags, and community-driven conversations around nutrition, training splits, and competition prep.
| Creator Tier | Engagement Rate | Avg. Likes/Tweet | Sponsored Post Cost |
|---|---|---|---|
| Nano (<10K) | 3.0–6.0% | 104 | $195–$500 |
| Micro (10K–50K) | 2.2–4.5% | 282 | $500–$1,170 |
| Mid (50K–250K) | 1.5–2.5% | 450+ | $1,200–$3,500 |
| Macro (250K+) | 0.8–1.5% | 700+ | $3,500–$10,000+ |
| Platform Average | 0.39% | — | — |
The gap between fitness nano-influencers and the platform average is nearly 15×. Micro-influencers in the fitness niche specifically achieve a 7.2% engagement rate, the highest for any vertical on X (WorldMetrics). This makes X a particularly cost-efficient channel for influencer collaborations in the gym and wellness space. The 2.7× difference in engagement between micro-influencers (282 likes per tweet) and nano-influencers (104 likes) demonstrates that reaching the 10K–50K follower tier unlocks disproportionate engagement gains (Twitter10K).
X Ads ROI and Conversion Performance
Return on ad spend is the metric that ultimately determines whether X deserves a share of a fitness brand's media budget. Current data shows every $1 invested in X ads returns an average of $2.70, roughly 40% higher than the cross-media investment baseline (Spiralytics / X). For context, the average social media ad ROI in fitness is 2.8× (ZipDo), making X's return competitive with Meta and TikTok.
Fitness-specific conversion data paints a nuanced picture. X's platform-wide conversion rate sits at 0.02% — notably low compared to search ads. However, this metric captures direct-click conversions and underrepresents X's role in multi-touch attribution. The $0.13 CPE means brands generate substantial awareness at minimal cost, building the brand familiarity that drives downstream conversions on other channels. Twitter polls on fitness trends generate 3× more responses from users over 35 than younger demographics, making X a strong channel for reaching established fitness consumers with higher purchasing power (Gitnux).
Paid social ads for fitness have a cost per acquisition ranging from $45 to $65, with TikTok ads running $55–$75 and Instagram at $40–$60 (ZipDo). X's $41 average cost per lead positions it at the lower end of this spectrum, offering a tangible cost advantage for lead-generation campaigns targeting gym memberships, personal training consultations, and supplement sales.
X Platform Statistics Relevant to Fitness Advertisers
Understanding the X user base helps fitness brands evaluate whether the platform aligns with their target audience. With 611 million monthly active users globally, X remains a significant reach channel — though its demographics skew differently from Instagram or TikTok.
| Metric | Value | Relevance to Fitness |
|---|---|---|
| Monthly Active Users | 611M | Large enough reach for any fitness vertical |
| Gender Split | 63.7% male / 36.3% female | Aligns with strength-training demographics |
| Top Age Bracket | 25-34 (37.5%) | Prime gym membership age group |
| 18-29 US Usage | 38% | Strong millennial and Gen Z reach |
| Q1 2026 Ad Revenue | $752M (+17% YoY) | Platform ad business stabilizing |
| 2025 Total Ad Revenue | ~$2.3B | Partial recovery from post-acquisition dip |
X's 63.7% male user base is a natural fit for gym and weightlifting brands, supplement companies, and combat sports marketing. The concentration of 37.5% of users in the 25-34 bracket overlaps directly with the highest-spending gym membership demographic. For fitness brands targeting women, X remains less efficient than Instagram or TikTok, but the growing Wellness Twitter community — particularly around yoga, pilates, and mental health — is expanding the female fitness audience on the platform.
Best Practices for Fitness X Ad Campaigns
Data from successful fitness advertisers reveals several patterns that separate high-performing X campaigns from wasted spend. These strategies apply whether you are managing campaigns in-house or working with a social media advertising agency.
- Leverage promoted posts with authentic creator content. Fitness brands using real trainer or athlete content in promoted format achieve 1.8% CTR — compared to the platform average of 0.59% (WorldMetrics, Hootsuite). Authentic workout footage outperforms polished studio creative.
- Target the 25-34 male demographic first. This cohort represents 37.5% of all X users and over-indexes for gym memberships and supplement purchases. Layer interest targeting for fitness, bodybuilding, CrossFit, and MMA to narrow reach (SocialNexis).
- Use video and image posts over text-only. Photo posts achieve 0.41% engagement versus 0.13% for link posts on X (SocialNexis). Short workout clips under 15 seconds and before-after transformation images generate the highest completion and save rates.
- Partner with micro-influencers for maximum ROI. Fitness micro-influencers cost $500–$1,170 per sponsored post but generate engagement rates 5–10× higher than macro accounts, at a fraction of the cost (Elev8or).
- Run polls and Twitter Spaces for audience building. Fitness polls generate 3× more responses from 35+ users, and Spaces debates on nutrition topics peaked at over 1,000 concurrent listeners for fitness brands (Gitnux).
- Allocate 10-15% of your social budget to X. At $385/month average campaign spend, X is the most affordable test channel for fitness brands exploring paid social beyond Meta and TikTok (EnrichLabs).
How Fitness Compares to Other Industries on X
Fitness outperforms most verticals on X for engagement but trails e-commerce for direct conversions. Understanding where fitness sits relative to other sectors helps brands set realistic KPI targets and justify X spend allocation to stakeholders.
| Industry | Avg. Engagement Rate | Avg. CPC | Avg. ROI |
|---|---|---|---|
| Fitness / Wellness | 2.2% | $0.74 | 2.8× (social) |
| E-commerce | 1.1% | $0.50–$2.00 | Fastest returns |
| Consumer Goods | 0.8% | $0.50–$2.00 | 3× (video ads) |
| B2B Services | 0.5% | $1.68–$10.00 | Long-term value |
| All Industries Avg. | 0.39% | $0.74 | $2.70 per $1 |
X Ad Format Performance for Fitness Brands
X offers several ad formats, and each performs differently for fitness campaigns. Understanding format-specific costs and performance helps allocate creative budgets effectively across the platform.
Promoted Tweets cost $0.26–$0.50 per first action and account for the majority of fitness ad spend. These work best for workout tips, challenge announcements, and transformation content. Promoted Accounts run $2.50–$3.50 per follow, making them suitable for gyms building a local fitness community. Promoted Trends, at $100,000–$250,000 per day, are reserved for major fitness events like New Year resolution campaigns, supplement launches, or brand partnerships with professional athletes (WebFX, SearchLab).
Video content on X achieves 0.41% engagement per post, matching photo posts and significantly outperforming text-only updates at 0.13% (SocialNexis). For fitness brands, short workout clips under 15 seconds generate the highest completion rates, while longer tutorial-style videos work best as organic content amplified through promoted tweets. Consumer goods brands using video ads on X see 3× higher returns than static formats (AdWeek), and fitness-specific video content follows the same pattern when featuring real trainers and authentic gym environments.
Fitness Hashtag and Community-Building Performance
Hashtag campaigns remain central to fitness marketing on X and serve as a cost-effective complement to paid ads. Accounts with 10,000+ followers increase brand hashtag usage by 35% when launching challenge-style campaigns (WorldMetrics). X has 50% of fitness brands using it specifically for real-time updates, making it the go-to channel for live event coverage, workout challenges, and community engagement (WorldMetrics). This community layer differentiates X from purely transactional platforms and makes it valuable for long-term brand-building creative strategies.
The combination of low ad costs and high community engagement makes X particularly effective for top-of-funnel awareness campaigns. While direct conversions lag behind Meta and Google, X's CPE of $0.13 means brands can generate thousands of touchpoints for a fraction of the cost of competing platforms. For fitness businesses focused on building authority and community before conversion, X provides the highest engagement-per-dollar ratio of any major social platform.
X Ads Budget Allocation for Fitness Brands
Determining the right budget allocation for X within a broader fitness media mix requires understanding how the platform fits alongside Meta, TikTok, and Google. Based on current benchmarks, fitness brands should consider X as a cost-efficient supplementary channel rather than a primary conversion driver.
With 53% of businesses spending between $101 and $500 per month on X advertising (WebFX), the platform sits well below the typical Meta or Google budget. This low barrier to entry makes X ideal for fitness startups testing paid social for the first time, or established gyms looking to diversify beyond Instagram and Facebook without committing significant budget. The $385 average monthly spend on X campaigns (EnrichLabs) represents roughly 10-15% of what most fitness brands invest in Meta, yet delivers competitive engagement metrics.
For multi-location gym chains, X's Promoted Trends at $100,000–$250,000 per day represent a premium brand-awareness play that few fitness brands leverage — but major supplement companies and equipment manufacturers use them during peak seasons like January (New Year resolutions) and September (back-to-school fitness). These high-visibility placements drive massive reach but require significant creative investment to convert awareness into measurable downstream actions.
The optimal X allocation for most fitness brands falls between 8% and 15% of total social ad spend, focused on community building, brand hashtag campaigns, and micro-influencer collaborations. Brands spending under $20,000 per month on total social media advertising should allocate $300–$500 monthly to X for testing, scaling to $1,000–$3,000 once they identify winning creative formats and audience segments.
Seasonal Trends in Fitness X Advertising
Fitness advertising on X follows predictable seasonal patterns that smart brands can exploit for lower costs and higher engagement. January sees the highest fitness ad volume across all platforms as resolution-driven campaigns flood the market — but X's lower advertiser density means CPCs remain 20-30% cheaper than Meta during the same peak period.
Summer months (June–August) see increased engagement with outdoor fitness, running, and bodyweight workout content, while September–October brings a surge in gym membership campaigns targeting the back-to-routine audience. The Q4 holiday period typically sees fitness brand CPCs decrease as retail and e-commerce advertisers consume the majority of premium inventory on other platforms, creating an opportunity for fitness brands to capture attention on X at below-average costs.
Fitness brands that align their X ad calendar with these seasonal patterns — front-loading January community campaigns, maintaining summer engagement content, and capitalizing on Q4 cost efficiency — can stretch their X budget significantly further than those running flat monthly spend without seasonal adjustment.
Frequently Asked Questions
How much do X ads cost for fitness businesses?
The median CPC for X ads is $0.74, with fitness-specific campaigns typically ranging from $0.50 to $2.00 per engagement. The median cost per engagement is just $0.13, and the average monthly campaign spend is $385 — making X one of the most affordable paid social options for gyms and personal trainers (Hootsuite, EnrichLabs).
What engagement rate should fitness brands expect on X?
Fitness creators on X average a 2.2% engagement rate, well above the platform-wide 0.39%. Micro-influencers in the fitness niche can reach 7.2% engagement — the highest rate of any vertical on the platform (UseSnippet, WorldMetrics).
Is X advertising worth it for gym marketing?
X offers strong ROI for fitness marketers, returning $2.70 for every $1 spent on average. Its male-skewing demographics (63.7% male) and 25-34 age concentration align well with strength-training and gym-membership audiences. The platform excels at community building and brand awareness rather than direct-response conversions. For gyms already running Meta ad campaigns, X serves as a cost-effective supplementary channel (Spiralytics, SocialNexis).
How does X compare to TikTok and Meta for fitness ads?
X is significantly cheaper per click ($0.74 vs. $1.41 on Meta) and per impression ($2.09 CPM vs. $2.53 on Meta). However, TikTok and Instagram deliver higher conversion rates for direct-response fitness campaigns. X works best as a complementary awareness and community channel alongside conversion-focused Meta and TikTok campaigns (Hootsuite, ZipDo).
What is the best X ad format for fitness brands?
Promoted Tweets with video or image content outperform text-only ads, achieving 0.41% engagement vs. 0.13%. Fitness brands see the best results using authentic creator content in promoted-post format, combined with micro-influencer partnerships costing $500–$1,170 per sponsored post (SocialNexis, Elev8or).
Sources
Hootsuite — X (Twitter) Ads Guide 2025
SocialNexis — X (Twitter) Statistics 2026
SearchLab — X (Twitter) Statistics 2026
EnrichLabs — Twitter/X Benchmarks 2025
UseSnippet — Fitness Twitter Engagement Benchmarks
WorldMetrics — Marketing in the Fitness Industry 2026
Spiralytics — X Advertising Stats 2025
Elev8or — Twitter Fitness Influencers 2026
The Global Statistics — X Advertising Statistics 2026
CuFinder — Fitness and Wellness Benchmarks 2026


