



Table of contents

No survey publishes what software companies spend on enterprise SEO specifically, so this page prices it from the parts that are public: 2026 marketing budget shares, vendor list prices and search traffic data. Treat it as a budget worksheet for a tech CMO, not as a benchmark of what peers spend.
Key Takeaways
- B2B product companies put 7.0% of revenue into marketing in 2026.
- B2B services companies put 10.1% of revenue into marketing.
- Overall marketing spend grew only 1.7% over the prior 12 months.
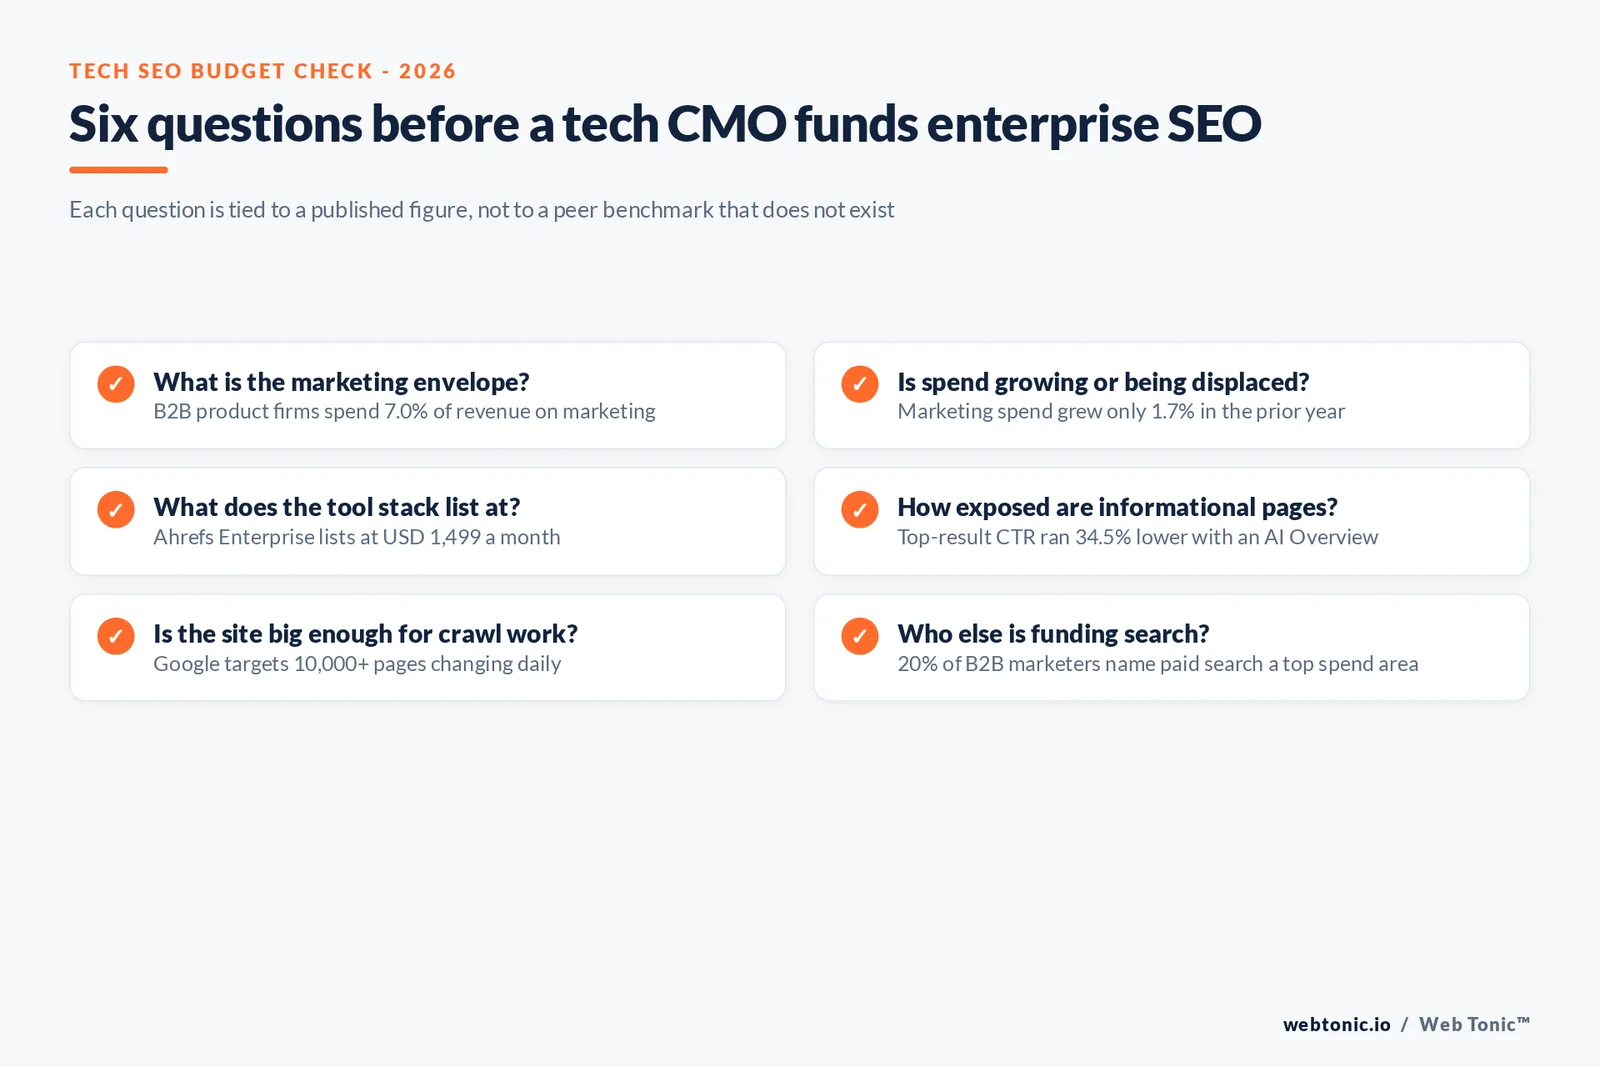
- 16% of B2B marketers name SEO a top spend area; 20% name paid search.
- Ahrefs Enterprise lists at USD 1,499 a month on an annual commitment.
- Screaming Frog costs USD 279 per user a year, or USD 235 at 20+ seats.
- Technology sites drew 59.8% of traffic from organic search in BrightEdge's 2019 study.
- AI summaries cut result clicks to 8% of visits from 15% (Pew, 2025).
Start from the marketing budget, not the SEO line
The CMO Survey 2026 (n=308, 20.4% of respondents from tech, software and platform companies) puts marketing at 9.0% of revenue and 9.6% of company budgets overall, the lowest share in several years. The split by economic sector matters for a SaaS CFO: B2B product companies report 7.0% of revenue and B2B services companies 10.1%. Overall marketing spending grew just 1.7%, the smallest increase since 2021.
That is the envelope enterprise SEO competes inside. A tech company at USD 50 million revenue with a 7.0% marketing ratio has roughly USD 3.5 million to split across people, media, events and tools; the SEO budget is a slice of that, not an independent number.
| 2026 budget measure | Figure | Source | What it means for SEO |
|---|---|---|---|
| Marketing share of revenue, all firms | 9.0% | The CMO Survey 2026 | The total envelope |
| B2B product companies | 7.0% of revenue | The CMO Survey 2026 | Typical for packaged software |
| B2B services companies | 10.1% of revenue | The CMO Survey 2026 | Typical for IT services |
| Marketing spend growth, prior 12 months | 1.7% | The CMO Survey 2026 | SEO gains share only by displacing |
| Tech share of survey sample | 20.4% | The CMO Survey 2026 | Largest single industry group |
Where B2B marketers say the money goes
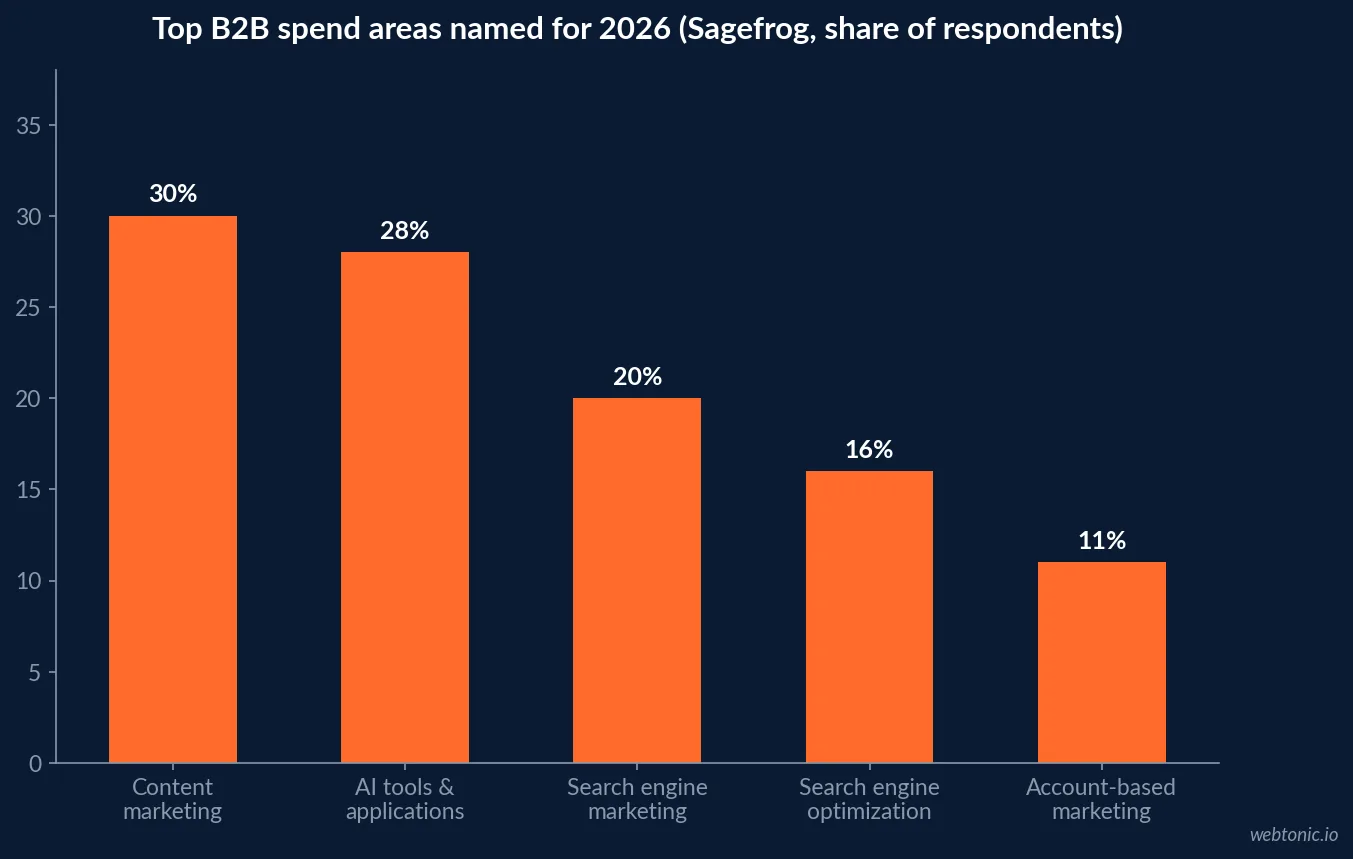
Sagefrog's 2026 B2B Marketing Mix Report asks which areas take the most spend. Content marketing leads at 30%, AI tools and applications follow at 28%, customer experience at 26%, and search engine marketing ties public relations at 20%. Search engine optimization is named by 16%, level with paid social. The same report finds 34% using AI for SEO work.
Read those as shares of respondents naming a spend area, not shares of budget. They still show the pattern most tech CMOs recognise: paid search is funded as media, while SEO is often funded through content and tooling lines that do not carry its name.
Published list prices for the SEO tool stack
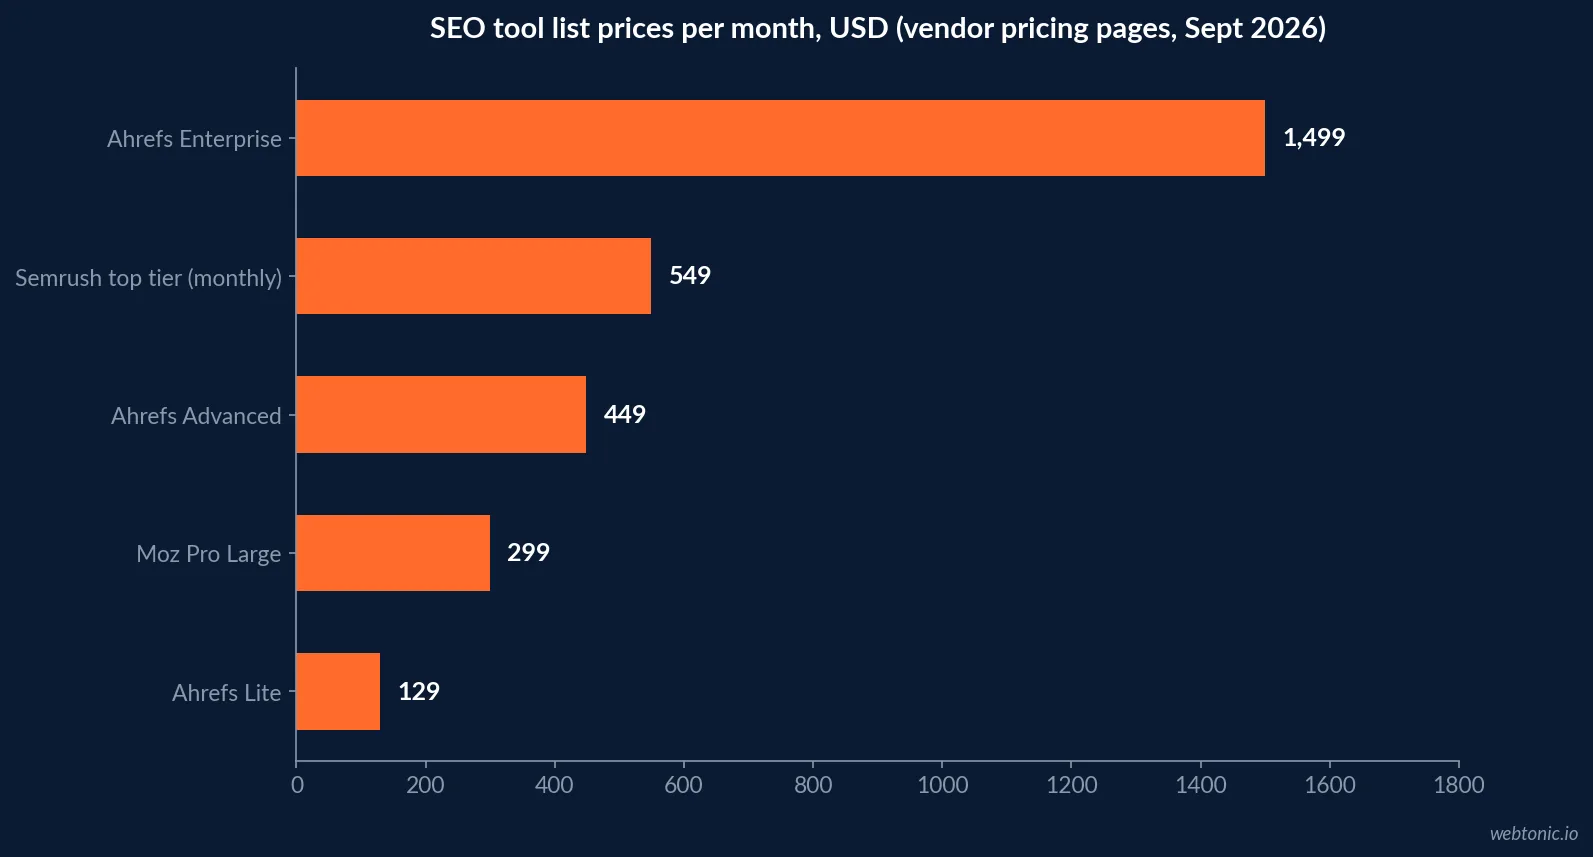
Tooling is the one enterprise SEO cost with public numbers. Ahrefs lists Lite at USD 129, Standard at USD 249 and Advanced at USD 449 a month, with Enterprise at USD 1,499 a month on an annual commitment. Semrush lists four tiers from USD 139 to USD 549 a month on monthly billing, lower when billed annually. Moz Pro lists Standard, Medium and Large at USD 99, 179 and 299 a month. Screaming Frog's SEO Spider costs USD 279 per user per year, with a 20-plus licence price of USD 235.
Enterprise platforms built for large sites, including BrightEdge, Conductor, Botify and seoClarity, publish no prices on their sites, so any figure for them would be a guess. Budget them as a quote to be obtained.
| Tool (list price, Sept 2026) | Entry tier | Top published tier | Billing note |
|---|---|---|---|
| Ahrefs | USD 129 a month (Lite) | USD 1,499 a month (Enterprise) | Enterprise needs annual commitment |
| Semrush | USD 139 a month | USD 549 a month | Up to 17% off billed annually |
| Moz Pro | USD 99 a month (Standard) | USD 299 a month (Large) | About 20% off billed yearly |
| Screaming Frog SEO Spider | USD 279 per user a year | USD 235 per user at 20+ seats | Per-user licences |
| BrightEdge / Conductor / Botify | Not published | Not published | Quote only |
A worked annual tool budget for a tech team
Using only those list prices, a five-person SEO and content team on Ahrefs Enterprise (one seat included) plus five Screaming Frog licences comes to USD 17,988 for Ahrefs and USD 1,395 for the crawler, before extra Ahrefs users and add-ons. Ahrefs lists additional users on its lower tiers at USD 40 to 80 a month each, and add-ons such as its report builder at USD 99 a month.
The arithmetic makes one point clearly: software licences are rarely the big number. People, engineering time for technical fixes and content production are where an enterprise SEO budget actually goes, and none of those have a public benchmark for tech companies.
| Line in the worked example | Calculation | Annual list cost | Source |
|---|---|---|---|
| Ahrefs Enterprise | USD 1,499 x 12 | USD 17,988 | Ahrefs pricing page |
| Screaming Frog, 5 users | USD 279 x 5 | USD 1,395 | Screaming Frog licence page |
| Moz Pro Large (alternative) | USD 299 x 12 | USD 3,588 | Moz pricing page |
| Semrush top tier (alternative) | USD 549 x 12 | USD 6,588 | Semrush pricing page |
| Enterprise platform | Quote | Not published | Vendor sales teams |
What organic search returned for tech sites
The last channel split BrightEdge published by vertical is from its 2019 channel report, built on thousands of domains and tens of billions of sessions in May 2019 with direct traffic excluded. It found organic search at 59.8% of trackable traffic for technology sites against 9.7% from paid search, and 64.1% organic for B2B against 12.3% paid. On revenue, organic accounted for 58.8% in technology and 52.7% in B2B.
Those figures are seven years old and pre-date AI Overviews, so use them as the historical baseline that SEO budgets were justified on, not as today's share.
The AI-search discount on that baseline
Pew Research Center tracked the browsing of 900 US adults in March 2025. Users who saw an AI summary clicked a traditional result in 8% of visits, against 15% when no summary appeared, and clicked a link inside the summary in just 1% of visits. About 18% of searches in the study produced a summary. Ahrefs compared 300,000 keywords and found an AI Overview correlated with a 34.5% lower click-through rate for the top-ranking page.
For a SaaS site whose organic traffic leans on informational "what is" and "how to" queries, that is the budget risk to price: rankings can hold while clicks fall.
Which search engines the budget is really for
Statcounter puts Google at 86.1% of US search engine market share in August 2026, Bing at 8.92%, Yahoo at 2.74% and DuckDuckGo at 1.7%. For most tech companies that means the enterprise SEO budget is a Google budget with a Bing check, which matters because Bing also feeds several AI assistants.
| Engine | US share, Aug 2026 | Budget implication | Source |
|---|---|---|---|
| 86.1% | Primary optimisation target | Statcounter | |
| Bing | 8.92% | Verify indexing in Bing Webmaster Tools | Statcounter |
| Yahoo! | 2.74% | Served largely by Bing results | Statcounter |
| DuckDuckGo | 1.7% | No separate budget needed | Statcounter |
| Yandex | 0.34% | Relevant only for specific markets | Statcounter |
When site size turns into a budget line
Google's crawl budget guide is written for sites with 1 million+ unique pages that change about weekly, or 10,000+ pages that change daily, and Google notes these are rough estimates, not thresholds. A typical SaaS marketing site never reaches either. Documentation portals, integration and template marketplaces, community forums and localized help centers do, and that is where log analysis and crawl tooling earn their cost.
The practical test is to count what your templates can generate, not what your navigation shows. A product with 400 integrations, 12 languages and versioned docs can publish tens of thousands of URLs without anyone writing a page, and each one competes for the same crawl attention as your pricing and product pages. The table maps common tech site sections against Google's published scale markers.
| Tech site section | How it scales | Google marker it can cross | Budget line it triggers |
|---|---|---|---|
| Marketing site | Tens to hundreds of pages | Neither marker | Content and on-page work |
| Product documentation | Versions x languages | 10,000+ pages changing daily | Crawl and log analysis tooling |
| Integration directory | One page per partner | 10,000+ with frequent updates | Template QA and structured data |
| Community forum | User-generated threads | 1 million+ unique pages | Indexing controls and pruning |
| Programmatic templates | Keyword x attribute pages | 1 million+ unique pages | Quality review against spam policies |
What the data does not tell a tech CMO
No published source gives an organic cost per lead, an organic conversion rate or a share of pipeline from SEO for software companies, and we have not invented one. Sagefrog reports where marketers spend, BrightEdge reported where traffic came from in 2019, and vendors publish tool prices. Anything beyond that, such as headcount or agency fees for enterprise SEO, has to come from your own quotes and your own attribution.
Two further gaps are worth naming. First, the 2019 BrightEdge split predates the rollout of AI Overviews, so there is no current, issuer-published figure for how much organic traffic a technology site should expect to keep. Second, the Pew and Ahrefs click studies are cross-industry; neither isolates software queries, and the Ahrefs comparison covers informational keywords only. A tech company that wants a defensible forecast has to build it from its own Search Console data, segmented by query intent, before it asks finance for money.
How to build the budget request
- Anchor on the marketing envelope: 7.0% or 10.1% of revenue depending on model.
- Price tools from list pages; a full enterprise seat can start at USD 17,988 a year.
- Model AI Overview exposure on informational pages using the 34.5% CTR gap as a stress test.
- Only fund crawl-budget work if templates push you toward 10,000+ fast-changing pages.
- Report SEO next to paid search, which 20% of B2B marketers already fund as a top area.
For the cross-industry picture see our enterprise SEO statistics, compare paid benchmarks in what Google Ads costs, or ask our data and analytics team to build the attribution that makes an SEO budget defensible. You can also contact us.
Frequently Asked Questions
How much should a tech company budget for enterprise SEO?
No survey publishes an enterprise SEO line item for software companies, so start from the total. The CMO Survey 2026 puts B2B product companies at 7.0% of revenue on marketing and B2B services at 10.1%, and Sagefrog's 2026 report finds 16% of B2B marketers naming SEO as a top spend area against 20% for search engine marketing. Tooling is the only part with public prices: a single Ahrefs Enterprise seat lists at USD 1,499 a month on an annual commitment.
What do enterprise SEO tools cost at list price?
On their own pricing pages in September 2026: Ahrefs lists Lite, Standard and Advanced at USD 129, 249 and 449 a month and Enterprise at USD 1,499; Semrush lists four tiers from USD 139 to USD 549 a month on monthly billing; Moz Pro lists USD 99, 179 and 299 a month; Screaming Frog's SEO Spider is USD 279 per user per year, falling to USD 235 at 20 or more licences. Platforms such as BrightEdge, Conductor and Botify do not publish prices.
Does organic search still justify budget for SaaS and tech?
The most recent issuer-published channel split is dated: BrightEdge's 2019 study found organic search at 59.8% of trackable traffic for technology sites and 64.1% for B2B, against 9.7% and 12.3% from paid search. Newer data shows the ceiling moving: Pew Research found users clicked a result in 8% of visits when an AI summary appeared versus 15% without one.
When does crawl budget become a real cost for a software site?
Google's crawl budget guide is aimed at sites with 1 million or more unique pages that change about weekly, or 10,000 or more pages that change daily, and Google calls those numbers rough estimates. Most SaaS marketing sites sit far below that; documentation hubs, integration directories and programmatic template pages are where tech companies cross it.
Should AI search visibility get its own budget line?
The CMO Survey 2026 reports 41.5% of marketers using AI for generative engine optimization, and Ahrefs measured a 34.5% lower click-through rate for the top result when an AI Overview appears. That argues for measuring AI visibility inside the SEO budget rather than for a separate, unpriced line.
Sources
The CMO Survey - Highlights and Insights Report 2026
Sagefrog - 2026 B2B Marketing Mix Report
Ahrefs - Pricing
Semrush - Prices
Moz Pro - Pricing
Screaming Frog - SEO Spider licence
BrightEdge - Channel Report 2019
Pew Research Center - AI summaries and clicks, 2025
Ahrefs - AI Overviews reduce clicks by 34.5%
Google - Crawl budget management
Statcounter - US search engine market share


