



Table of contents
Short answer: no published study measures the return on App Store optimization for B2B SaaS, so any headline ROI figure you see is unsourced. What the data can do is price the inputs and show where the listing matters. Apple's search ads in the Business category converted taps to downloads at 67.22% in 2025 according to MobileAction's 2026 benchmark, a vendor dataset, while ASO software lists from USD 15 to USD 549 a month. Whether that is worth it depends on one question: do your customers use the mobile app every week, or does the deal close on a desktop demo?
Key Takeaways
- No study publishes an ASO return figure for B2B SaaS; 0 named benchmarks exist.
- Business-category search-ad conversion rose to 67.22% in 2025 from 64.00% (MobileAction, vendor).
- Productivity cost per tap climbed to USD 1.64 from USD 0.94.
- Productivity cost per acquisition rose to USD 2.84 from USD 1.49.
- Productivity tap-through rate slipped to 6.98% from 9.57%.
- SplitMetrics puts the 2025 average cost per acquisition at USD 3.76 (vendor).
- Apple's Developer Program costs 99 USD a year; commission is 30% or 15%.
- Zoom Workplace shows 3.2M ratings and Salesforce 353K on the US App Store.
Why "worth it" is the wrong first question
For a consumer app, the store is the storefront: people search, compare screenshots and install. For most B2B software, the buying decision happens before anyone opens the App Store. A company signs a contract, IT provisions accounts, and employees are told to install the app. In that sequence the listing does not generate demand; it confirms a decision already made and shapes the first impression of a product people have been told to use.
So the useful framing is not return on ASO but cost of a weak listing. A mobile companion app with a poor rating, outdated screenshots or a name that does not match the product brand creates support tickets and doubts at the exact moment a new customer is onboarding. That cost is real but it is not measured in any published dataset, which is why this page sticks to the numbers that are.
What it costs to have a listing at all
The fixed costs are small. Apple's Developer Program is 99 USD per membership year, and Apple's commission on digital goods and services sold through the store is 30%, or 15% for developers in its small business programme. Most B2B SaaS apps sell subscriptions on the web and use the app for access, which keeps that commission out of the picture.
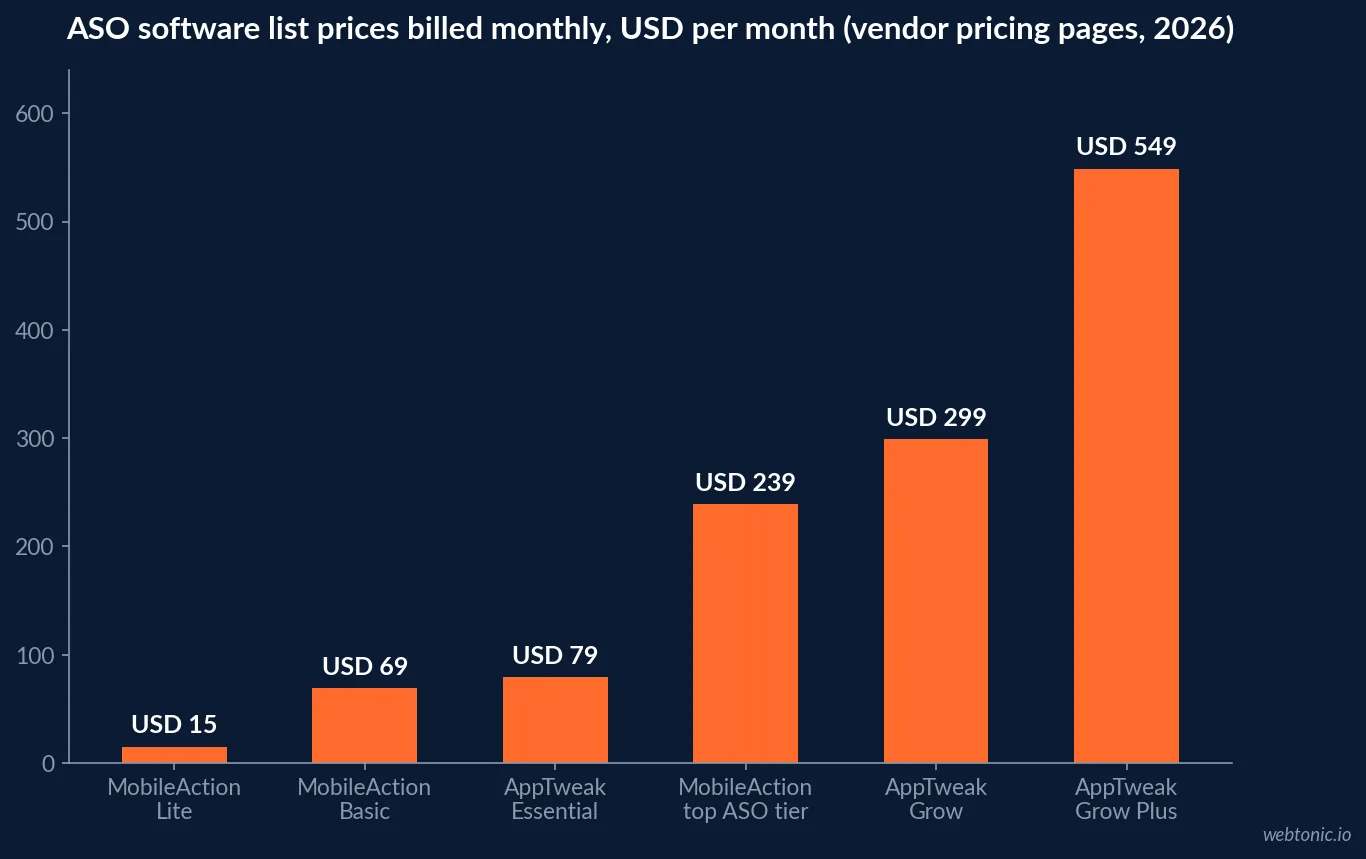
The variable costs are tooling and time. AppTweak's pricing page lists USD 79, 299 and 549 a month billed monthly for its Essential, Grow and Grow Plus plans. MobileAction lists USD 15, 69 and 239 a month billed monthly for its ASO tiers. These are list prices on the vendors' own pages, checked in September 2026.
| Cost line | Published price | Source | Needed for a B2B app? |
|---|---|---|---|
| Apple Developer Program | 99 USD per year | Apple | Yes, for any App Store listing |
| App Store commission on digital sales | 30% (15% small business) | Apple | Only if you sell in-app |
| AppTweak Essential / Grow / Grow Plus | USD 79 / 299 / 549 a month | AppTweak | Optional |
| MobileAction ASO tiers | USD 15 / 69 / 239 a month | MobileAction | Optional |
| Private custom app distribution | No extra fee listed | Apple | For client or employee-only apps |
Business and Productivity search-ad benchmarks
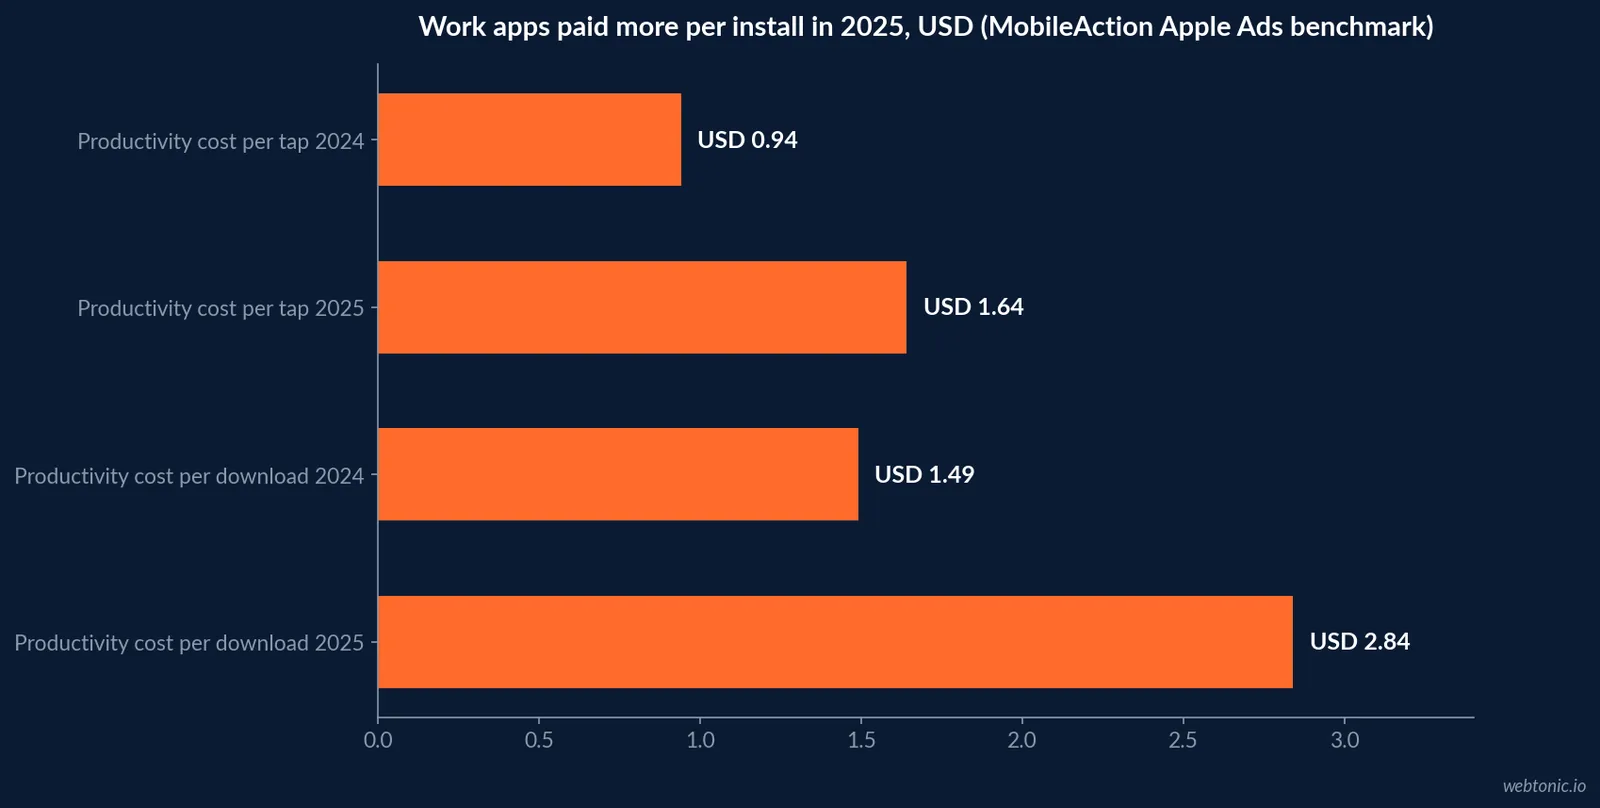
Category data exists only on the paid side. MobileAction's report, compiled from its own and SearchAds.com tools on 2025 Apple Ads campaigns, shows the Business category's search-results conversion rising to 67.22% from 64.00% in 2024; the vendor attributes that to searchers having a defined objective. Productivity is where costs moved: cost per tap rose from USD 0.94 to USD 1.64 (CPT data) and cost per acquisition from USD 1.49 to USD 2.84 (CPA data), which MobileAction links to rising competition among subscription-led apps.
Productivity's tap-through rate fell to 6.98% from 9.57%, one of the larger declines in the report. Taken together, work apps in 2025 paid more per tap and got fewer taps per impression, while the taps they did get kept converting well.
| Apple Ads search results (MobileAction 2026, vendor) | 2024 | 2025 | Change |
|---|---|---|---|
| Business - conversion rate | 64.00% | 67.22% | +3.22 points |
| Productivity - cost per tap | USD 0.94 | USD 1.64 | +74% |
| Productivity - cost per acquisition | USD 1.49 | USD 2.84 | +91% |
| Productivity - tap-through rate | 9.57% | 6.98% | -2.59 points |
| All categories - conversion rate | 66.70% | 65.82% | -0.88 points |
A cross-vendor check on install costs
A second vendor gives a sense of range. SplitMetrics reports an average Apple Ads cost per tap of USD 2.25 across the top 15 categories in 2025 and an average cost per acquisition of USD 3.76, with Finance at USD 6.06 per tap and USD 13.28 per acquisition. MobileAction's all-category cost per acquisition for search results was USD 2.51. The two datasets use different client bases and category mixes, so the gap is a reminder to treat any single vendor number as a band, not a price.
For a B2B team, a paid install only has value if it becomes an activated seat. None of these datasets track that; they stop at the download.
| Install cost reference (2025 data) | Value | Scope | Publisher |
|---|---|---|---|
| Productivity cost per acquisition | USD 2.84 | Apple Ads search results | MobileAction (vendor) |
| All-category cost per acquisition | USD 2.51 | Apple Ads search results | MobileAction (vendor) |
| Average cost per acquisition | USD 3.76 | Top 15 categories | SplitMetrics (vendor) |
| Average cost per tap | USD 2.25 | Top 15 categories | SplitMetrics (vendor) |
| Finance cost per acquisition | USD 13.28 | Finance category | SplitMetrics (vendor) |
How established business apps present on the store
The public listings set the bar a buyer sees. On the US App Store on 30 September 2026, Zoom Workplace showed 3.2M ratings averaging 4.7 and ranked #4 in Business. Salesforce showed 353K ratings at 4.8. Slack showed 53K ratings at 4.1 and ranked #18 in Business. All three are listed in the Business category.
These are snapshots that change daily. The point is the scale gap: a mid-market SaaS companion app with a few hundred ratings sits next to category leaders with hundreds of thousands, and the rating count is visible to every prospect who checks the listing during a trial.
| Business app (US App Store) | Ratings shown | Average | Business chart position |
|---|---|---|---|
| Zoom Workplace | 3.2M | 4.7 | #4 |
| Salesforce | 353K | 4.8 | Not shown in top charts |
| Slack | 53K | 4.1 | #18 |
Private distribution: when the public store is irrelevant
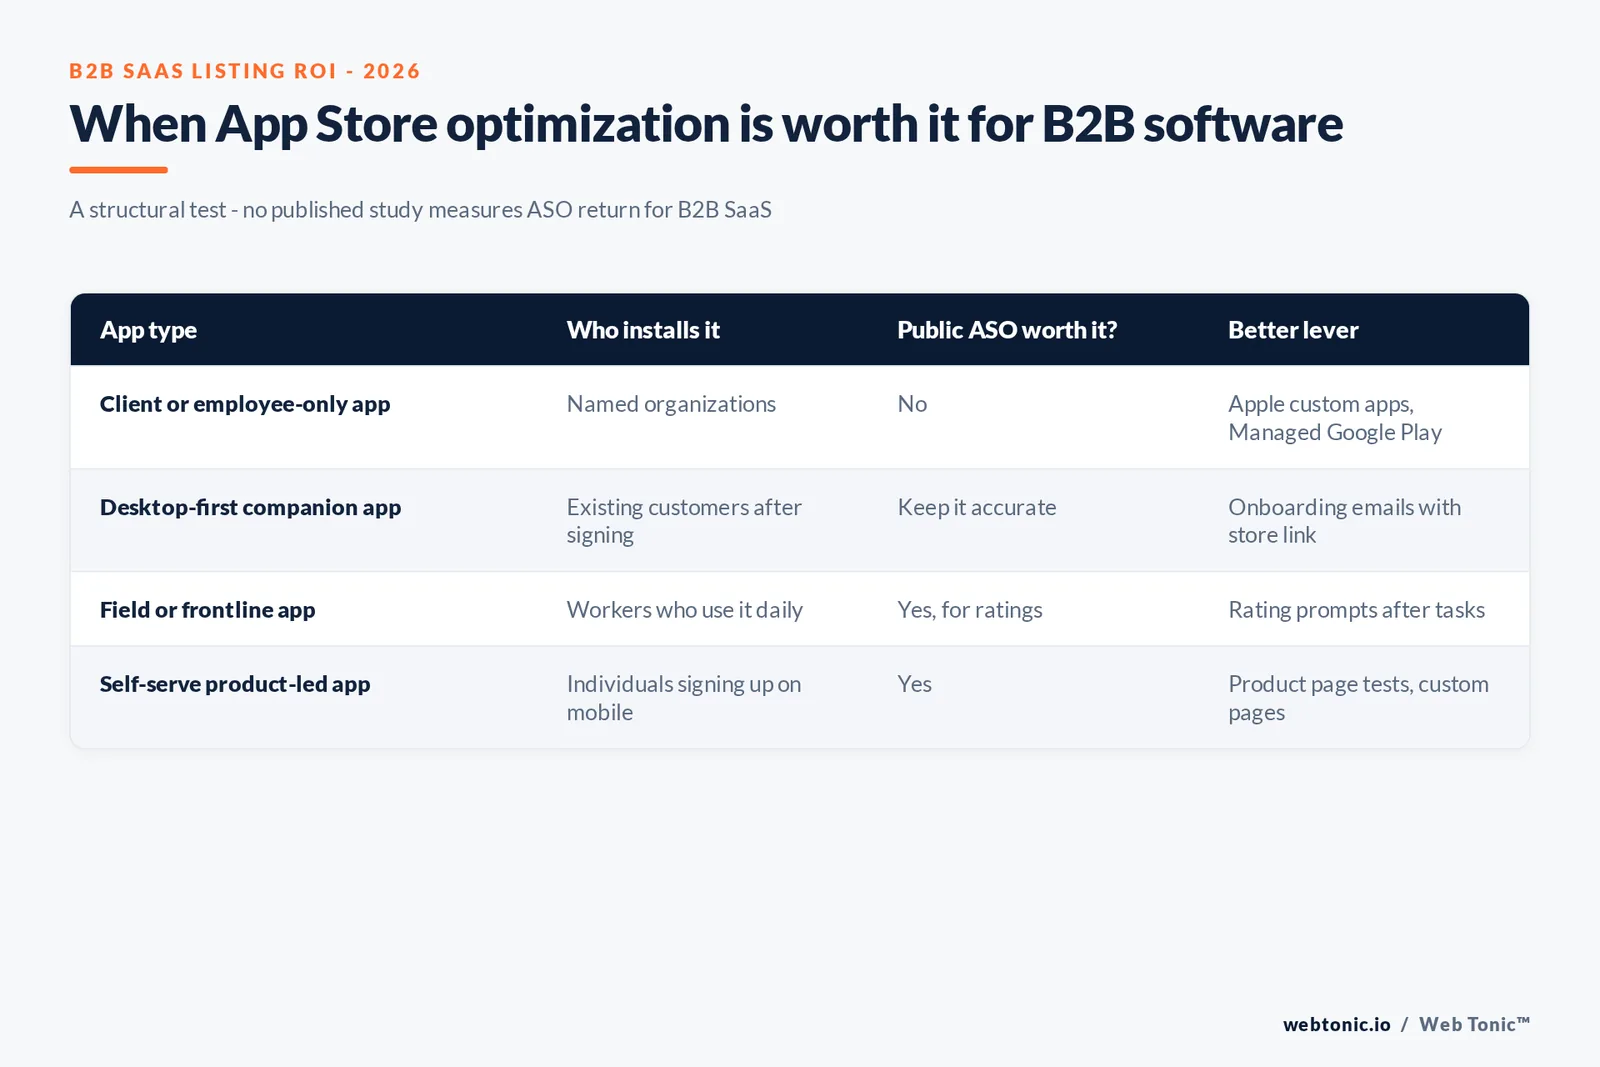
Many B2B apps never need public ASO. Apple's custom apps programme lets a developer make an app available only to specific organizations - Apple explicitly lists clients, dealers, franchises and employees - through Apple Business or Apple School Manager, distributed by mobile device management or redemption codes. The option must be chosen before the app is approved.
On Android, Managed Google Play lets a developer publish private apps from the Play Console that are only available to users in an organization, then distribute them through the company's device management console. If your app exists for a handful of enterprise customers, private distribution is the better answer than optimizing a public listing.
When the listing does earn attention
Three situations change the answer. First, product-led growth: if individuals can sign up on mobile without a sales call, the listing is an acquisition page and Apple's custom product pages (up to 70) and Google Play's custom store listings (up to 50) let you match pages to use cases or industries. Second, field and frontline apps where the mobile app is the product. Third, brand defence: when a competitor bids on your name in Apple Ads, your organic listing is what answers the search.
Apple's 2025 Transparency Report counts 463,575,966 accounts searching the store each week. A small share of them search for work tools by name, and that branded demand is what a B2B listing should convert.
What the top 1,000 apps do with their listings
If a B2B team does invest, the leaders' habits are documented. AppTweak's 2025 ASO trends report, covering the top 1,000 US apps, found 54% updated their App Store screenshots twice or more in 2025 (46% on Google Play), making screenshots the most-refreshed element, and 35% ran two or more screenshot tests on the App Store against 42% on Google Play. Around 90% never tested their icon.
On the paid side, AppTweak tracked roughly 2,800 US Apple Ads advertisers and found apps using custom product pages converted taps at 58.7% against 55.5% on the default page, yet 61% of apps ran none. For a SaaS app that serves several industries or roles, a custom page per use case is the cheapest test available.
| Listing habit (AppTweak 2025, top US apps) | App Store | Google Play | B2B takeaway |
|---|---|---|---|
| Updated screenshots twice or more | 54% | 46% | Refresh after each major product release |
| Ran two or more screenshot tests | 35% | 42% | Test before redesigning |
| Custom product page tap-to-install rate | 58.7% vs 55.5% default | n/a | One page per role or industry |
| Apple Ads advertisers running no custom pages | 61% of apps | n/a | An easy gap to close |
A simple way to decide
- Check how many of your active users log in from mobile each week. If it is a small minority, keep the listing accurate and stop there.
- If users are told to install the app during onboarding, update screenshots to match the current product and the brand name used in sales material.
- If you sell self-serve on mobile, run a product page optimization test before paying for installs.
- If a handful of enterprise customers use the app, move it to private distribution.
- If you do buy installs, measure activated seats, not downloads; no benchmark covers that step.
What the data does not cover
AppTweak's conversion benchmarks put the average US App Store conversion rate at 8.56% and Google Play at 16.15% across all categories, with wide variation by category. None of the vendors publishes a B2B SaaS segment, an organic keyword-rank benchmark for business software, or a link between listing changes and revenue. Anyone quoting a SaaS ASO ROI multiple is quoting their own client data or a guess; ask for the method before using it.
Related reading
For store-wide context see our app store optimization statistics. SaaS teams comparing organic channels can read B2B SaaS and tech SEO statistics and B2B SaaS connected TV advertising statistics. For measurement set-up, see our data intelligence services.
Frequently Asked Questions
Is App Store optimization worth it for B2B SaaS?
Only when the mobile app is part of what customers use every week. No published study measures the return on ASO for B2B software, so the honest test is structural: if users install the app after the company buys the product, the listing is a conversion and reputation surface worth maintaining; if the product is desktop-first and sold by a sales team, store rankings will not move pipeline.
What does it cost to be on the App Store and Google Play?
Apple's Developer Program is 99 USD per membership year, and Apple takes a 30% commission on digital goods and services sold through the App Store, or 15% for developers enrolled in its small business programme. ASO software adds list prices of USD 79, 299 or 549 a month at AppTweak and USD 15, 69 or 239 a month at MobileAction, billed monthly.
How much do Apple search ads cost for business apps?
MobileAction's 2026 benchmark, based on 2025 data from its own tools, puts Productivity cost per tap at USD 1.64 (from USD 0.94) and cost per acquisition at USD 2.84 (from USD 1.49). SplitMetrics reports an average cost per acquisition of USD 3.76 across its top 15 categories in 2025. Both are vendor datasets for paid installs, not organic results.
Can a B2B app skip the public App Store?
Yes. Apple lets developers distribute a custom app privately to specific organizations through Apple Business or Apple School Manager, for clients, dealers, franchises or employees. Managed Google Play lets a developer publish private apps visible only to users in a given organization. Private distribution removes public ASO from the equation entirely.
Which metric should a SaaS team watch on its listing?
Branded search conversion and rating volume. Business-category search-ad conversion was 67.22% in 2025 according to MobileAction, which reflects searchers with a defined objective. Rating counts on major business apps range from 53K for Slack to 3.2M for Zoom Workplace, so a listing with a few dozen ratings will read as unestablished to a buyer who checks.
Sources
MobileAction - Apple Ads 2026 Benchmark, conversion rate by category
MobileAction - Apple Ads 2026 Benchmark, CPA by category
SplitMetrics - Apple Search Ads cost 2025
AppTweak - Pricing
AppTweak - Average app conversion rate per category
AppTweak - ASO trends and benchmarks report 2025
Apple Developer - Program membership and fees
Apple Developer - Custom apps and volume purchase
Managed Google Play Help - Publish private apps
Apple - App Store Transparency Report 2025
Apple App Store - Zoom Workplace listing


