



Table of contents
A manufacturer can run app store optimization for USD 124 in first-year platform fees, or spend USD 6,590 a year on a single ASO tool licence - the right number depends on whether the app is public at all. No study publishes a manufacturing app conversion rate or ranking benchmark, so this page prices the work from list prices and official documentation, and uses category-level vendor data only where it is labelled as such.
Key Takeaways
- The Apple Developer Program costs USD 99 a year.
- Google Play charges a USD 25 one-time registration fee.
- The Apple Developer Enterprise Program for internal distribution costs USD 299 a year.
- AppTweak's ASO plans list at USD 79, 299 and 549 a month billed monthly.
- Billed annually, AppTweak lists USD 949, 3,590 and 6,590.
- MobileAction lists USD 15, 69 and 239 a month billed monthly.
- Apple Ads search results cost per acquisition averaged USD 2.51 in 2025 (MobileAction, vendor data).
- The Business category converted taps to downloads at 67.22% in the same dataset.
- Utilities fell to 55.89% from 67.69%.
- Apple allows up to 70 additional custom product pages per app.
- The US has more than 239K manufacturers employing 12.6 million people (NAM).
- 53.3% of US manufacturing establishments had fewer than 10 employees in 2023 (Census CBP).
- 77% of industrial buyers get pricing or lead times from self-serve digital tools (Kula Partners, n=263).
Most manufacturers do not have a consumer app
Start with the market structure. The National Association of Manufacturers counts more than 239K manufacturers employing 12.6 million people. The Census Bureau's County Business Patterns 2023 file lists 284,452 manufacturing establishments, and 53.3% of them had fewer than 10 employees. Only 26,027 establishments had 100 or more.
A plant with eight people rarely ships a public app. Where manufacturers do build one, it is usually a dealer ordering tool, a field-service or warranty app, a product configurator, a spec-sheet library or a connected-equipment companion app. Those apps serve a narrow, known audience, which changes what ASO is worth. We could find no published organic conversion rate, click-through rate or ranking benchmark for manufacturing apps, and we do not estimate one here.
| Market fact | Figure | Source and year | What it means for app budgets |
|---|---|---|---|
| US manufacturers | 239K+ | NAM facts page, 2026 | A large base, few with public apps |
| Manufacturing employment | 12.6 million | NAM facts page, 2026 | Large technician and plant workforce |
| Manufacturing establishments | 284,452 | Census CBP 2023 | Unit count behind the firm count |
| Establishments under 10 employees | 53.3% | Census CBP 2023 | Most cannot staff an app team |
| Establishments with 100+ employees | 26,027 | Census CBP 2023 | The realistic pool for owned apps |
The fixed platform fees
Every public listing starts with two fees. Apple's Developer Program costs USD 99 a year, and the Apple Developer Enterprise Program, for organizations distributing proprietary apps directly to employees, costs USD 299 a year. Google Play charges a USD 25 one-time registration fee.
That puts the floor for a two-store public presence at USD 124 in year one and USD 99 in each year after. Nothing in that floor buys visibility; it only buys the right to be listed.
| Platform fee | List price | Billing | Who needs it |
|---|---|---|---|
| Apple Developer Program | USD 99 | Per year | Any public or unlisted iOS app |
| Apple Developer Enterprise Program | USD 299 | Per year | Internal-only distribution to employees |
| Google Play developer registration | USD 25 | One time | Any public or private Android app |
| Two-store public floor, year one | USD 124 | Apple plus Google | A dealer or field app on both stores |
| Two-store public floor, later years | USD 99 | Apple renewal only | Ongoing listing upkeep |
ASO tool list prices in 2026
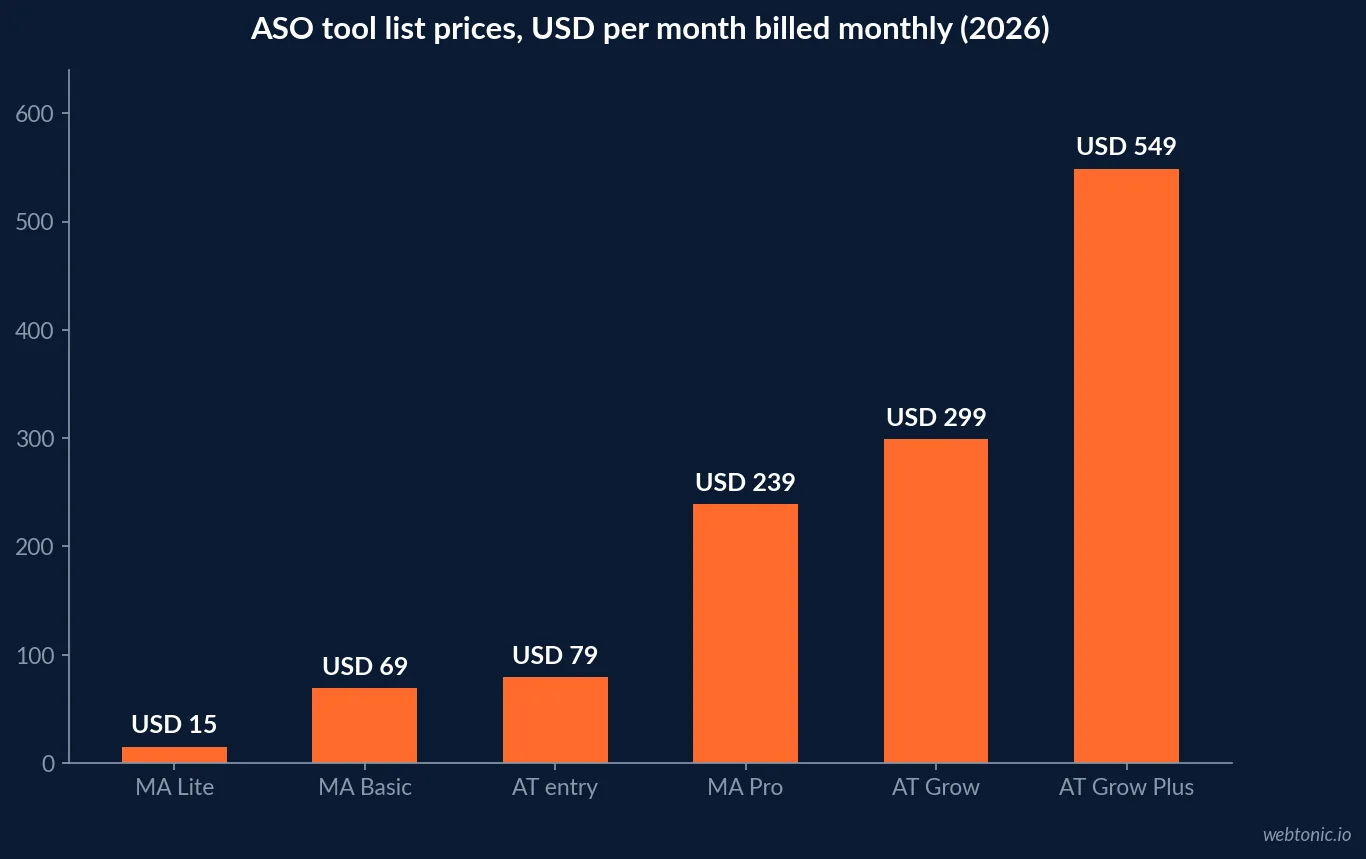
Keyword tracking, competitor monitoring and review management sit in paid tools. AppTweak's pricing page lists its ASO plans at USD 79, USD 299 and USD 549 a month billed monthly, or USD 949, USD 3,590 and USD 6,590 billed annually. MobileAction lists Lite at USD 15, Basic at USD 69 and Pro at USD 239 a month billed monthly, with yearly billing at USD 12.50, USD 59 and USD 199 a month.
The gap between USD 15 and USD 549 is mostly keyword volume, number of tracked apps and competitors, and seats. MobileAction's Lite plan covers 100 keywords and 5 apps; its Pro plan covers 1,500 keywords, 10 apps and 3 seats. A single industrial app tracked in one market rarely needs more than the entry tier.
| Tool plan (2026 list) | Billed monthly | Billed annually | Annual cost at monthly billing |
|---|---|---|---|
| MobileAction Lite | USD 15 a month | USD 12.50 a month | USD 180 |
| MobileAction Basic | USD 69 a month | USD 59 a month | USD 828 |
| MobileAction Pro | USD 239 a month | USD 199 a month | USD 2,868 |
| AppTweak entry ASO plan | USD 79 a month | USD 949 a year | USD 948 |
| AppTweak Grow | USD 299 a month | USD 3,590 a year | USD 3,588 |
| AppTweak Grow Plus | USD 549 a month | USD 6,590 a year | USD 6,588 |
Ad-management tooling is priced on spend, not seats
The same vendors price their Apple Ads management layers differently. AppTweak lists its Apple Ads tool as free up to USD 25,000 of monthly ad spend and 4% of spend above that. MobileAction's free Apple Ads tier covers up to USD 10,000 of monthly ad spend. For an industrial app spending a few hundred dollars a month on ads, both are effectively free, which means the tool budget is almost entirely the ASO seat.
What paid discovery costs on the App Store
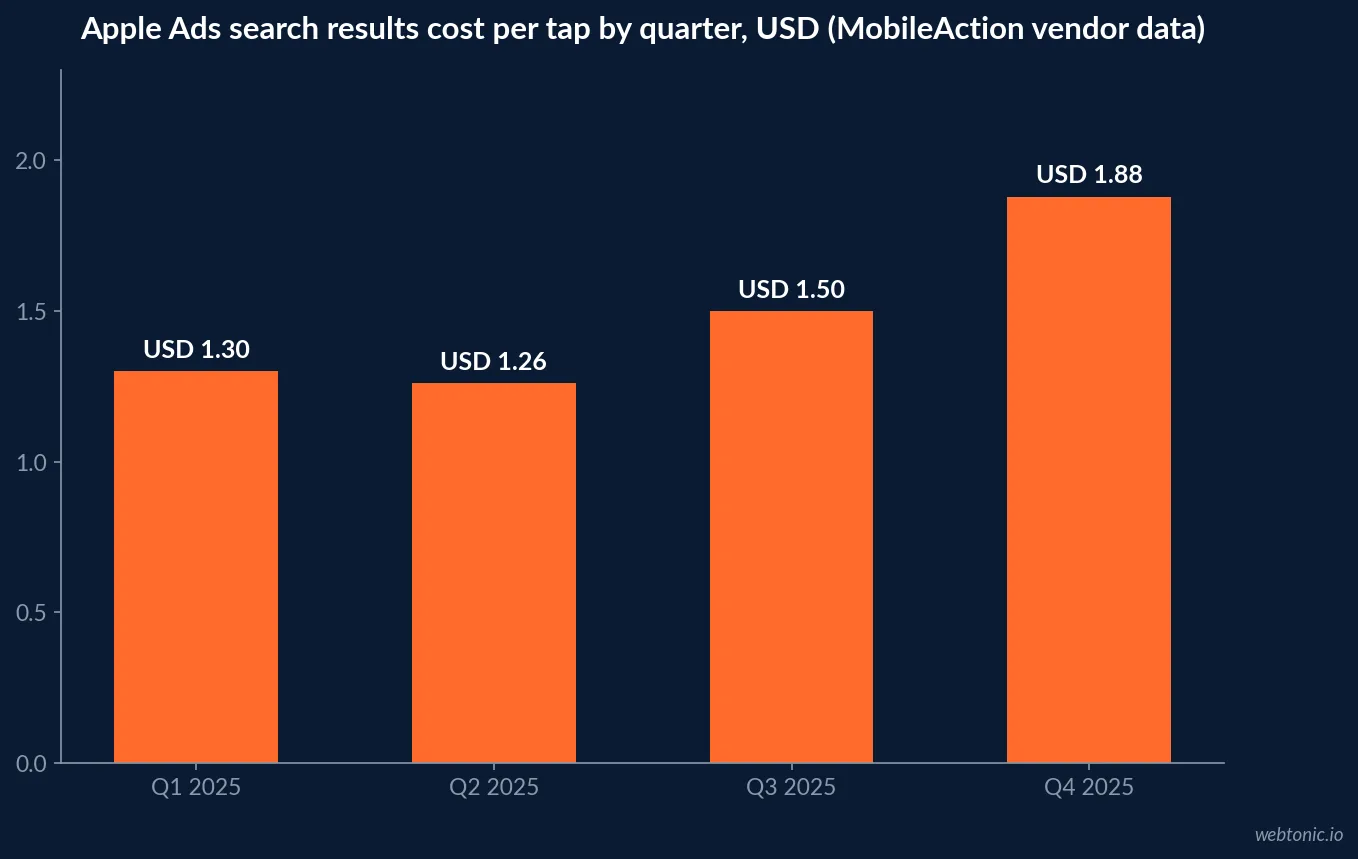
If a public dealer or end-user app needs installs faster than organic search delivers, Apple Ads is the lever. The only broad benchmark we could verify is vendor data: the MobileAction Apple Ads 2026 benchmark report, built on 2025 campaigns on its platform. It reports a search results cost per acquisition of USD 2.51, a conversion rate of 65.82% against 66.70% in 2024, and cost per tap climbing from USD 1.26 in Q2 to USD 1.88 in Q4.
At category level, the same report puts Business at 67.22% (from 64.00%) and Utilities at 55.89% (from 67.69%). Manufacturer apps usually list under Business, Utilities or Productivity; these are category figures, not manufacturing figures.
| Apple Ads metric (MobileAction, 2025 data) | Figure | Comparison | Read it as |
|---|---|---|---|
| Search results cost per acquisition | USD 2.51 | All categories | Paid install reference point |
| Search results conversion rate | 65.82% | 66.70% in 2024 | Taps that become downloads |
| Cost per tap, Q2 2025 | USD 1.26 | Low of the year | Cheapest quarter to test |
| Cost per tap, Q4 2025 | USD 1.88 | High of the year | Year-end competition |
| Business category conversion rate | 67.22% | 64.00% in 2024 | Closest category to dealer apps |
| Utilities category conversion rate | 55.89% | 67.69% in 2024 | Closest category to tool apps |
Private distribution is the budget line most manufacturers need
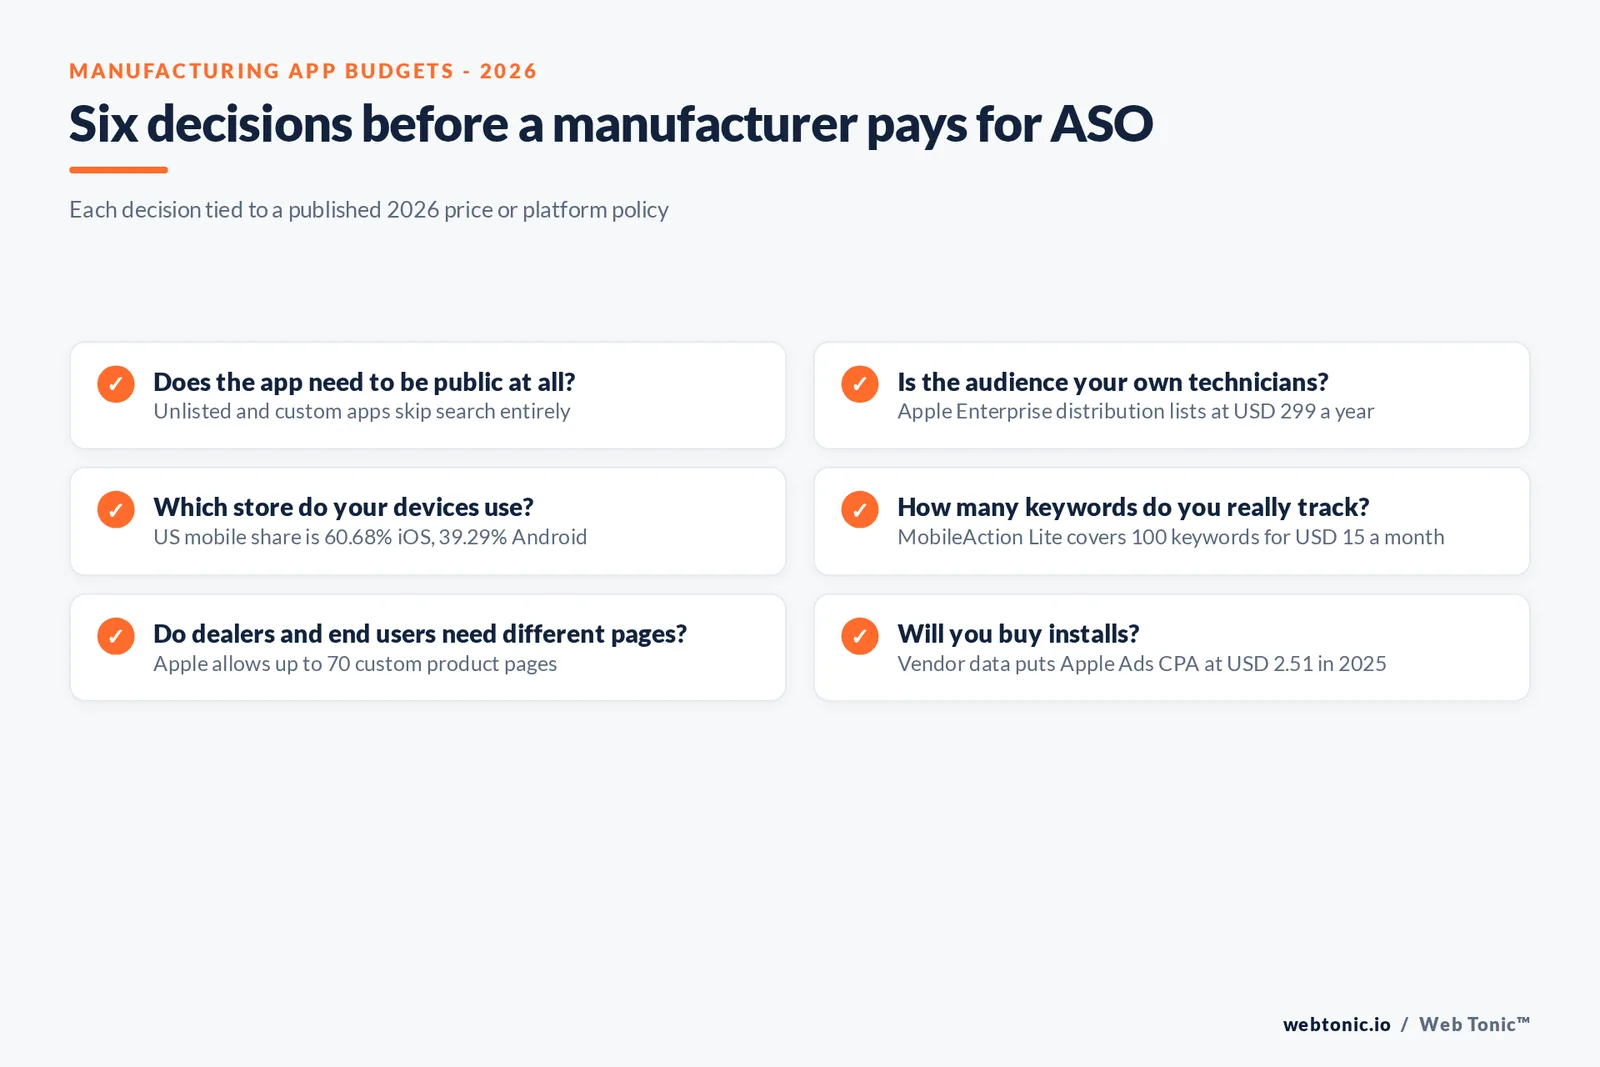
For a technician or dealer app, the cheapest ASO decision is to skip public search. Apple's unlisted app distribution keeps an app out of App Store categories, recommendations, charts and search results, reachable only by direct link, and names partner sales tools and employee resources as good candidates. Apple's custom apps go to specific organizations through Apple Business Manager. Google's managed Google Play publishes private apps to an organization from the Play Console.
In each case the listing work shrinks to accurate screenshots and release notes. There is no keyword to rank for, so an ASO tool licence would be spend with no measurable return.
Store features that cost nothing extra
Public apps can segment audiences without buying anything. Apple lets developers publish up to 70 additional custom product pages, each with its own URL, screenshots and promotional text - one for dealers, one for field technicians, one for end users. Product page optimization tests up to three treatments against the original for up to 90 days.
On the discovery side, Apple Ads states that 70% of App Store visitors use search to discover apps and that almost 65% of downloads happen directly after a search. Those are store-wide figures, but they explain why title, subtitle and keyword fields matter even for a niche industrial app.
Which store to fund first
Statcounter puts US mobile operating system share at 60.68% iOS and 39.29% Android in August 2026, and Pew Research Center reports that 91% of US adults own a smartphone. Those are consumer-wide measures. Field fleets often run on company-issued rugged Android devices, so audit the devices your technicians and dealers actually carry before splitting budget by market share.
| Budget scenario | Line items (2026 list prices) | Year-one total | Fits |
|---|---|---|---|
| Private field app | Apple USD 99 for custom apps or USD 299 Enterprise, plus Google USD 25 | USD 124 to 324 | Technician and warranty apps |
| Public app, no tool | Apple USD 99 plus Google USD 25 | USD 124 | Spec libraries with branded search only |
| Public app, entry tool | Fees plus MobileAction Lite at USD 180 a year | USD 304 | One app, one market |
| Public app, mid tool | Fees plus AppTweak entry at USD 949 a year | USD 1,073 | Dealer app across a few markets |
| Public app, full tool | Fees plus AppTweak Grow Plus at USD 6,590 a year | USD 6,714 | Several apps and countries |
Why buyer behaviour still argues for a good listing
Industrial buyers research before they talk. Kula Partners' Industrial Buyer Pulse Q3 2025 (n=263 North American decision-makers, fielded with InnovateMR) found 82% shortlist suppliers before speaking with them, 77% obtain pricing or lead-time information through self-serve digital tools, 80% would place an e-commerce order of 50K or more, and 85% use AI to research suppliers.
The survey does not measure apps specifically. What it does show is that self-serve tooling is expected, so a public ordering or configurator app with a thin, outdated listing works against a buyer who has already decided to research alone.
What the data does not show
No source we opened reports an organic App Store conversion rate, ranking share or cost per install for manufacturing apps, and category benchmarks from vendors cover their own customers only. Read the Business and Utilities figures above as the nearest labelled reference, not as a target. Our cross-industry app store optimization statistics collect the store-wide figures, and our growth marketing team can help decide whether an industrial app should be public at all. For measurement across web and app, see our data and analytics work or contact us.
Frequently Asked Questions
How much should a manufacturer budget for app store optimization?
Start with what the app is for. A public dealer, field-service or product-configurator app needs the fixed platform fees (USD 99 a year for the Apple Developer Program and a USD 25 one-time Google Play registration) plus, if you want keyword and competitor data, an ASO tool. Published 2026 list prices run from USD 15 a month for MobileAction Lite to USD 549 a month for AppTweak Grow Plus. An internal-only app distributed privately needs no ASO tool at all.
Do manufacturers even need ASO?
Many do not. Apple lets developers distribute unlisted apps that do not appear in App Store categories or search results, and custom apps delivered to specific organizations through Apple Business Manager. Google offers private apps through managed Google Play. If the audience is your own technicians or a closed dealer network, discoverability in search is irrelevant and the budget should go to the app itself.
What does Apple Ads cost for business apps?
No published benchmark isolates manufacturing apps. MobileAction's Apple Ads 2026 benchmark report, a vendor dataset of 2025 campaigns, puts the all-category search results cost per acquisition at USD 2.51 and the Business category conversion rate at 67.22%, with quarterly cost per tap rising from USD 1.26 in Q2 to USD 1.88 in Q4. Treat those as category-level reference points, not manufacturing figures.
Is iOS or Android more important for an industrial app?
Statcounter puts US mobile operating system share at 60.68% iOS and 39.29% Android in August 2026. That is a consumer-wide measure, so check your own technician and dealer fleet before choosing where to spend first. Many field fleets run on company-issued Android devices, which would reverse the priority.
Which store features cost nothing extra?
Apple lets you publish up to 70 additional custom product pages and run product page optimization tests with up to three treatments for up to 90 days, both inside App Store Connect at no added fee. These let one app speak separately to dealers, field technicians and end users without a second listing.
Sources
AppTweak - Pricing
MobileAction - Pricing
MobileAction - Apple Ads 2026 Benchmark Report
Apple - Developer Program
Apple - Unlisted app distribution
Apple - Custom product pages
Apple Ads - App Store
Google Play Console Help - Developer account
Managed Google Play - Private apps
NAM - Facts about manufacturing
US Census Bureau - County Business Patterns datasets
Kula Partners - Industrial Buyer Pulse Q3 2025
Statcounter - US mobile OS share
Pew Research Center - Mobile fact sheet


