


Table of contents

Key Takeaways
- Meta's advertising ecosystem reaches 3.58 billion daily active users, providing enormous scale for digital marketing campaigns
- Facebook advertising CTR benchmarks range from 0.80% to 4.13% depending on industry, with proper benchmarking against your specific vertical being essential for accurate performance assessment
- Advantage+ AI-powered campaigns consistently outperform manual campaigns by 22% in ROAS, with 35% of U.S. retail ad spend now utilizing these automation features
- Mobile optimization is non-negotiable, with 94.1% of ad impressions occurring on mobile devices and mobile campaigns generating 62% higher engagement
- Video content, particularly Reels, drives superior engagement with 2.7% average engagement rates and 55% higher conversion rates for brands
- For businesses managing complex multi-platform advertising strategies, partnering with performance marketing specialists who understand these benchmarks can significantly improve campaign efficiency and ROI
What Are Meta Statistics?
Meta statistics encompass the quantitative performance data, user metrics, and advertising benchmarks across Meta Platforms' ecosystem of applications, including Facebook, Instagram, WhatsApp, Messenger, and Threads. These data points provide advertisers and marketers with critical insights for campaign planning, budget allocation, and performance optimization.
Pew Research Center's 2025 social media report confirms that YouTube and Facebook remain the most widely used social media platforms in the United States, with half of U.S. adults reporting social media usage, particularly Instagram usage. This research foundation establishes Meta's platforms as essential channels for digital marketing strategies.
For mid-market and enterprise businesses, understanding Meta statistics translates directly to competitive advantage. With over 10 million active advertisers using Meta's platforms monthly, the companies that leverage accurate performance benchmarks consistently outperform those operating on assumptions. The difference between knowing your industry's average cost-per-click and guessing can mean thousands of dollars in wasted ad spend or missed opportunities when considering market capitalization.
Meta Platform User Statistics 2025-2026
The scale of Meta's ecosystem continues to expand, creating massive advertising reach for businesses of all sizes.
Family of Apps Daily Active Users
Meta's Q4 2025 earnings report reveals that the company's family daily active people, including Facebook users, reached 3.58 billion by December 2025, representing a 7% year-over-year increase. This metric encompasses users across Facebook, Instagram, WhatsApp, and Messenger who engage with at least one platform daily.
| Platform | Monthly Active Users (2025) | Daily Engagement Rate |
|---|---|---|
| 3.07 billion | 68.7% | |
| 2 billion | 84% | |
| 2 billion | 90%+ | |
| Threads | 320 million | Growing |
Geographic Distribution
India leads global Facebook usage with 383.5 million users, followed by the United States at 196.9 million. For Instagram, India similarly dominates with approximately 472.6 million users, and there’s a good chance the United States is in second place at 179.9 million.
Regional advertising reach varies significantly. North America holds the highest penetration rate globally at 82.3%, followed by Latin America and the Caribbean at 77.8%. Europe sits at 67.6% penetration, while Asia-Pacific represents the fastest-growing region with a global penetration rate of 1.04 billion users. In our experience running campaigns across these regions, the cost efficiency in Asia-Pacific often surprises advertisers who assume North American audiences deliver the best returns.
Age Demographics Breakdown
Statista's 2025 Instagram demographics report shows that approximately 33.3% of global Instagram audiences fall between ages 25-34, with 29.7% of social media users between 18-24 years. Facebook's largest user segment similarly comprises the 25-34 age bracket at 31.1%.
On Facebook, the age distribution skews slightly older: 18-24 year-olds make up 18.4% of users, while the dominant 25-34 bracket holds 31.1%. The 35-44 range accounts for 17.5%, with 45-54 at 12.8%, 55-64 at 10.2%, and 65+ rounding out at 10.0%. Instagram trends younger, particularly appealing to younger audiences, with 18-24 year-olds comprising 29.7-31.7% of users and 25-34 year-olds at 30.6-33.3%. The 35-44 bracket drops to 15.7-17.4%, while users 45 and older make up less than 17% combined.
Meta Advertising Revenue Statistics
Meta's advertising business drives the vast majority of the company's revenue, and 2025 marked another record-breaking year.
2025 Financial Performance
Meta closed 2025 with $201 billion in total revenue, Macrotrends data confirms, marking a 22.17% year-over-year increase. The Q4 2025 quarter alone generated $59.9 billion, up 24% annually, contributing significantly to the company’s dividend yield. Advertising continues to dominate the revenue mix, generating over $195 billion (97.3% of total). Net income reached $60.5 billion, while operating income climbed 20% year-over-year to $83.3 billion.
Advertising Revenue Growth
Ad impressions increased 18% in Q4 2025 and 12% for the full year, while average price per ad rose 6% quarterly and 9% annually. This dual growth in both volume and pricing demonstrates Meta's strengthening position in digital advertising, along with improvements in the valuation ratios like the P/E ratio.
The annual revenue run rate for Meta's AI-powered ad solutions, including the Advantage+ suite, has surpassed $60 billion, contributing significantly to Meta's market cap. Marketing Dive's Q3 2025 analysis attributes this growth to improved ad targeting and creative optimization capabilities.
Revenue by Region
| Region | Ad Revenue (2025) | YoY Growth |
|---|---|---|
| North America | $87.5 billion | 21% |
| Europe | $26.4 billion | 3.9% |
| Asia-Pacific | $42.6 billion | 7.1% |
| Rest of World | $36.5 billion | 5.2% |
Facebook Advertising Benchmarks 2026
Understanding current Facebook advertising performance metrics enables more accurate campaign planning and realistic goal-setting, ultimately boosting brand awareness. But here's what catches most advertisers off guard: benchmarks vary wildly by industry, and comparing your performance to platform-wide averages often leads to poor decisions.
Click-Through Rate (CTR) Benchmarks
TheeDigital's 2026 Facebook Ads Benchmarks report shows Meta CTRs in 2026 average around 1.4%, with some industries achieving rates up to 1.7%.
Lead generation campaigns consistently outperform other objectives at 2.53% CTR, which is 61% higher than traffic campaigns. Traffic campaigns average 1.57-1.71%, while conversion campaigns land at 1.45-1.59% (showing a modest +0.14% year-over-year improvement). Reach campaigns trail at 0.85-0.92%.
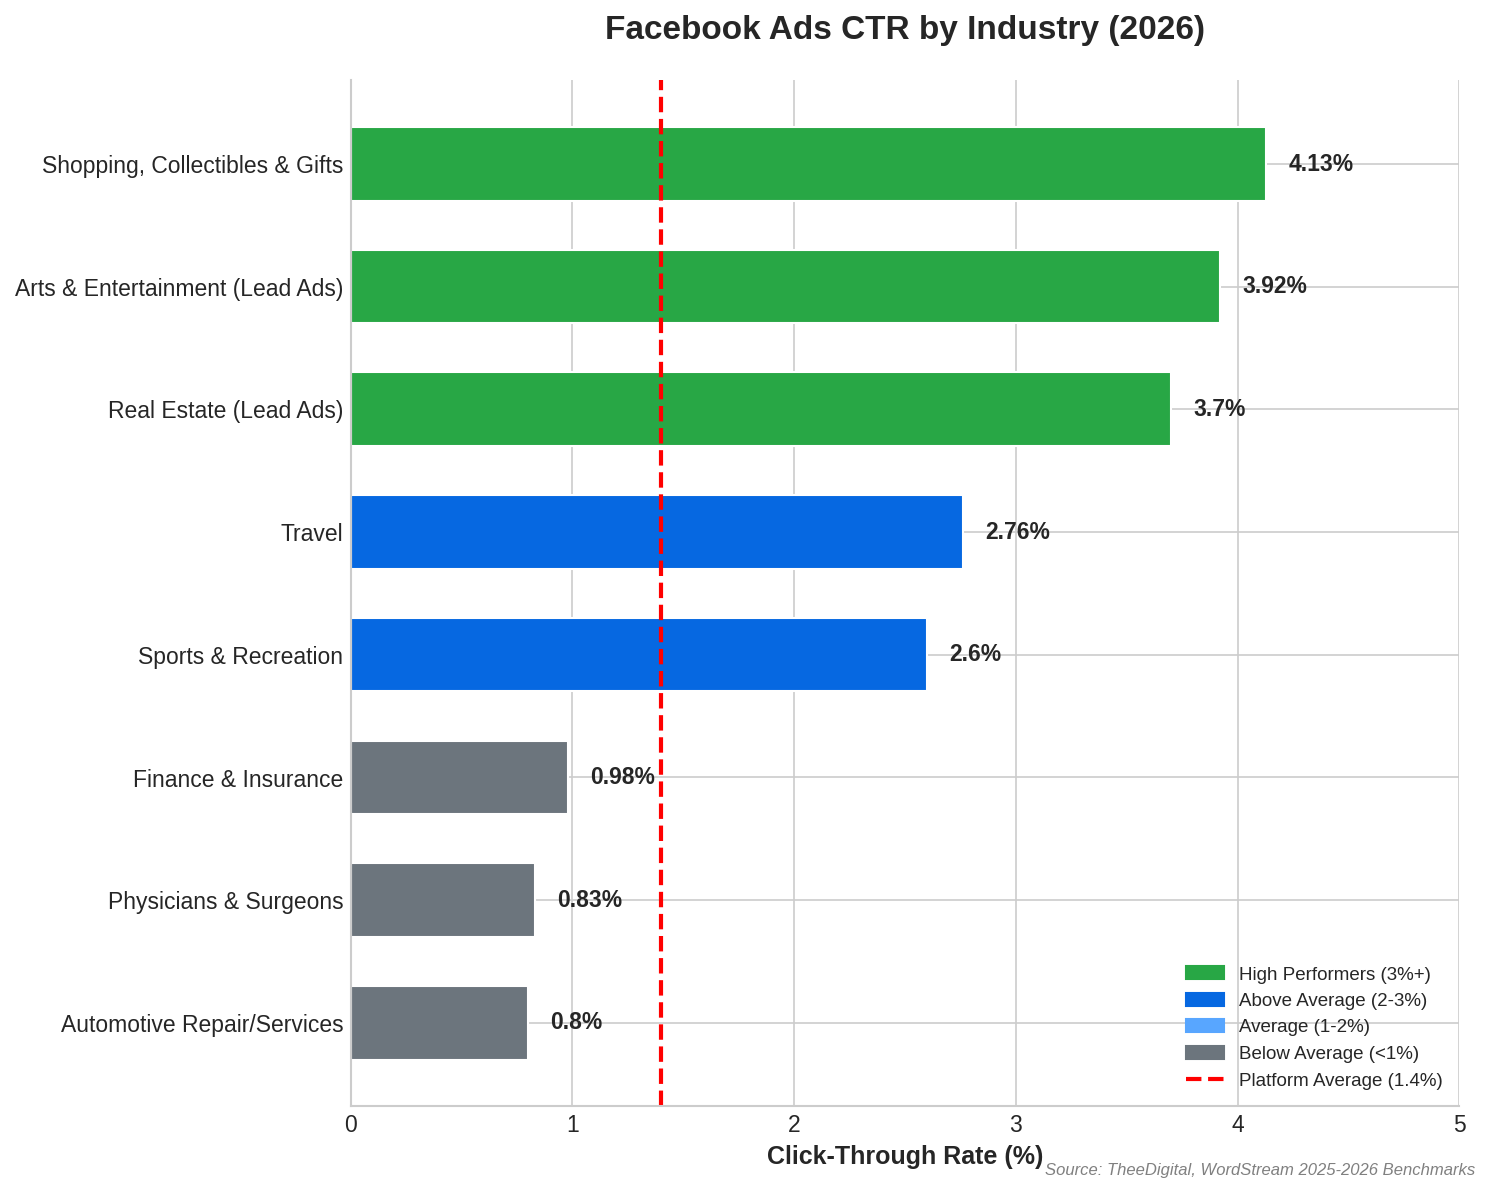
Shopping, collectibles, and gift advertisers dominate CTR performance at 4.13%, nearly triple the platform average. Travel follows at 2.76%, with sports and recreation at 2.60%. For Lead Ads specifically, arts and entertainment reaches 3.92% and real estate hits 3.70%. On the lower end, automotive repair and services averages just 0.80% CTR, physicians and surgeons at 0.83%, and finance and insurance at 0.98%. The 0.80% rate in automotive services might look disappointing on paper. But for high-ticket services like transmission repairs or brake replacements, even modest click volumes can drive significant revenue.
Cost Per Click (CPC) Benchmarks
WordStream's 2025 Facebook Ads Benchmarks report found the average CPC for traffic campaigns across all industries is $0.70, down from $0.77 the previous year and may affect the company's share price. That's good news for advertisers watching budgets closely.
Traffic campaigns now cost $0.70 per click on average, a 6.7% decrease year-over-year. Lead generation runs higher at $1.92 (a slight increase from $1.88), while conversion campaigns fall between $1.05-$1.15.
| Industry | Average CPC |
|---|---|
| Finance and Insurance | $1.22 |
| Personal Services | $1.00 |
| Home and Home Improvement | $0.99 |
| Restaurants and Food | $0.74 |
| Career and Employment | $0.86 |
| Sports and Recreation | $1.07 |
Conversion Rate (CVR) Benchmarks
Facebook Lead Ads maintain strong performance with an average conversion rate of 7.72%. Conversion rates vary significantly by industry and targeting strategy.
For prospecting campaigns, health and beauty leads with 2.1-2.5% CVR, followed by food and drinks at 2.0-2.3%, pet supplies at 2.0%+, and clothing and accessories at 1.05%. Retargeting campaigns tell a different story: food and drink jumps to 3.88% (the highest), health and beauty reaches 2.8%, while home and garden struggles at just 0.66%.
Cost Per Lead (CPL) Benchmarks
The average cost per lead for Facebook Lead Ads across all industries is $27.66. Industries using in-app lead forms experience reduced CPL, with small businesses averaging $8.20 per lead, a 16% improvement year-over-year.
Instagram Advertising Benchmarks 2026
Instagram's visual-first format creates distinct performance patterns compared to Facebook, requiring platform-specific optimization strategies for Facebook posts. And this is where we see many advertisers make mistakes: they apply Facebook creative directly to Instagram and wonder why performance suffers.
Instagram CTR Benchmarks
WebFX's 2026 Meta Marketing Benchmarks report shows Instagram CTRs are generally lower than Facebook due to its visual-first format and more passive user scrolling behaviour.
Feed ads average 0.22-0.88% CTR, Story ads range from 0.33-0.54%, and Reels ads achieve approximately 1.25%. A CTR above 0.88% indicates strong Feed ad performance, while rates below 0.3% suggest the need for more scroll-stopping creative.
Instagram CPC Benchmarks
Instagram CPCs average $3.35 for Feed ads and $1.83 for Stories, higher than Facebook's rates due to a more engaged but premium audience on social media apps. In the United States, the average sits at $1.42, while global averages range from $1.20-$1.50. CPM typically falls between $6-$8.
Instagram Engagement Rates
Social Insider's 2025 Instagram Benchmarks report reveals Instagram experienced a 28% year-over-year decrease in engagement, with H1 2025 averaging just 0.45% engagement rate. Platform saturation is real.
| Content Type | Engagement Rate | YoY Change |
|---|---|---|
| Carousels | 0.55% | -15% |
| Reels | 2.7% | Stable |
| Static Images | 0.35% | -20% |
| Videos | 2.2% | -5% |
Smaller accounts consistently outperform larger ones on engagement. Nano-influencers (1K-10K followers) achieve 2.71-5.2% engagement rates, micro-influencers (10K-50K) land at 2.5-3.5%, mid-tier accounts (50K-100K) average 2.0-2.5%, and macro-influencers (100K+) settle at 2.3% average.
Instagram Reels Performance
Reels dominate Instagram engagement. Users spend 35-39% of total app time watching short-form video content, and the numbers reflect that attention. Average engagement rate hits 2.7%, reach rate covers 30.81% of followers, and impressions run 2x higher than other content types. For brands, the conversion rate lift reaches 55% higher than other formats, with average views generating 300-800 likes per Reel.
Meta Advantage+ AI Advertising Statistics
Meta's AI-powered advertising solutions represent the fastest-growing segment of their ad business. We've tested these extensively, and the results consistently surprise even skeptical clients.
Advantage+ Performance Metrics
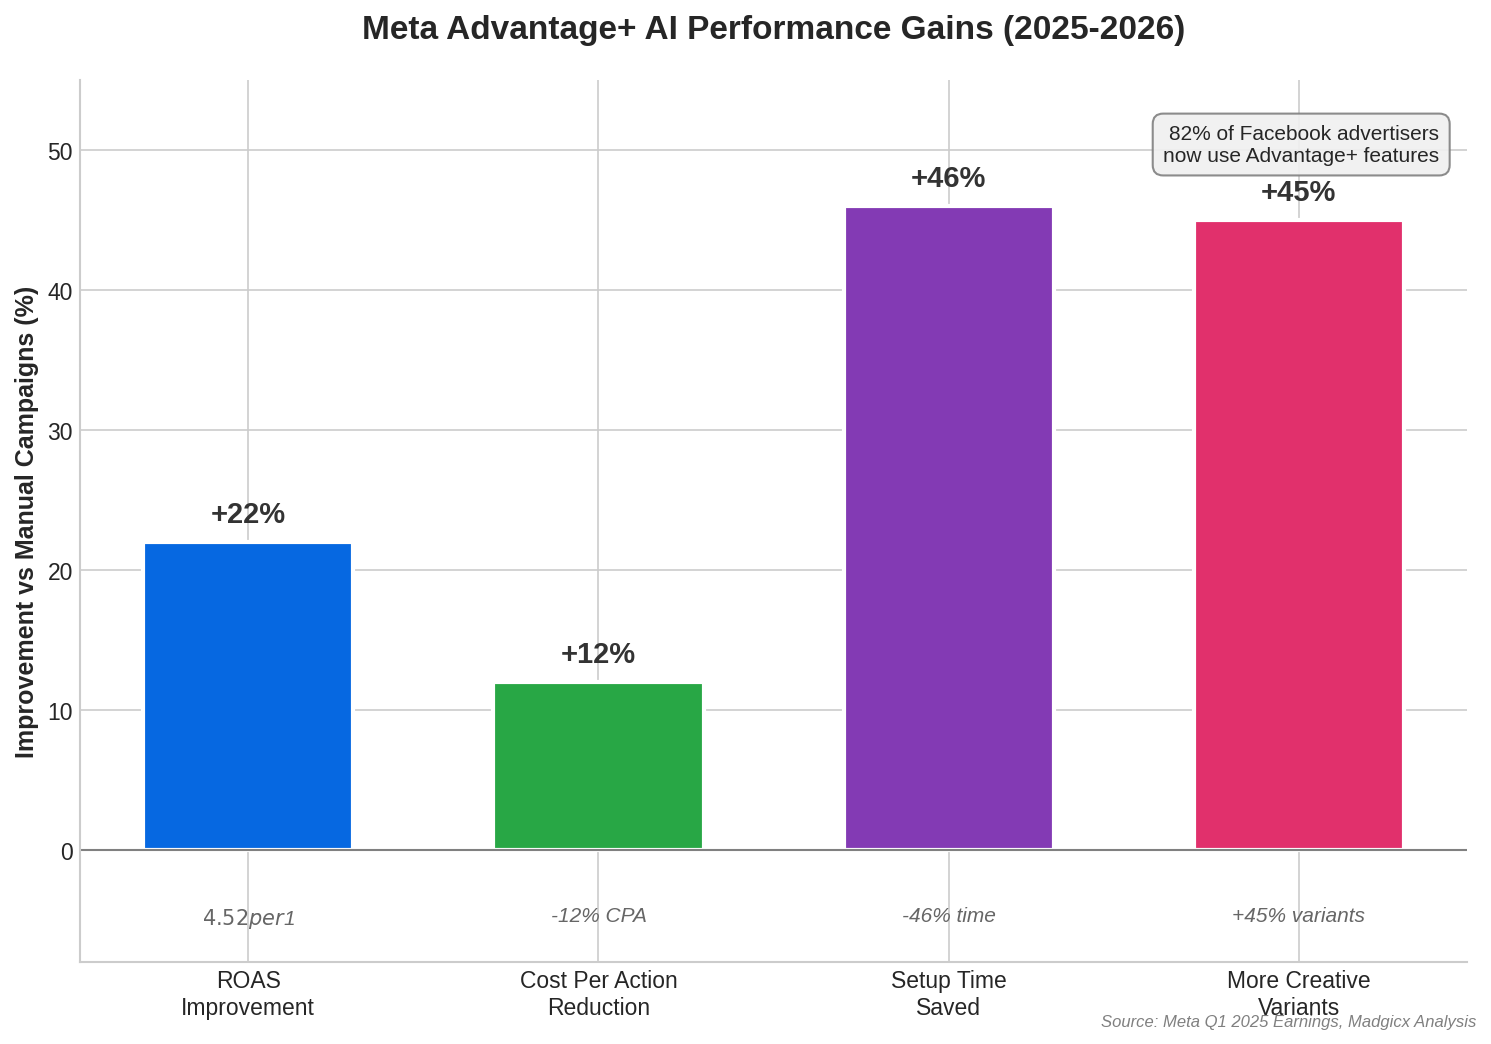
Madgicx's analysis of Meta's Q1 2025 earnings shows Advantage+ campaigns deliver $4.52 in revenue for every $1 spent, 22% higher than manually managed campaigns.
The ROI speaks for itself: $4.52 per $1 spent, with cost per action reduced by 12% on average. ROAS improves 15% compared to manual campaigns, while AI bidding delivers 27% higher ROAS than manual bidding. Creative automation produces 45% more ad variants without added production time, and campaign setup time drops by 46%. What does this mean for your team? Less time in Ads Manager, more time on strategy.
Adoption Rates
Adoption has accelerated rapidly. Now 35% of U.S. retail ad spend uses Advantage+ campaigns, up from 19% the previous year. Over 4 million advertisers use Meta's generative AI ad creative tools, 82% of Facebook advertisers use at least one Meta Advantage+ feature, and advertisers using video-generation tools increased 20% over Q2 2025.
AI-Driven Improvements
Meta's GEM (Generative Ads Recommendation Model) and sequence learning improvements drove measurable gains in Q4 2025. Facebook saw a 3.5% lift in ad clicks, Instagram gained 1%+ in conversions, overall ads quality increased 12%, and Meta Reels conversions improved 5%. Ad sets with 3-10 creative variations lower cost per action by 46%.
Mobile Advertising Statistics
Mobile dominates. That's the headline. With 94.1% of impressions happening on mobile devices, desktop-first creative strategies are essentially obsolete.
Mobile vs. Desktop Performance
SQ Magazine's Facebook Ad Statistics 2025 report confirms mobile devices account for 94.1% of all Facebook ad impressions, up from 92.7%.
The performance gap is significant: mobile engagement runs 62% higher than desktop, mobile CTR averages 1.72% versus 1.06% on desktop, mobile conversion rate reaches 9.3% compared to 6.7% on desktop, and mobile video view-through rate hits 32% versus just 17% on desktop.
Format Performance
Vertical video ads with audio generate 35% higher click-through rates. Mobile-first campaigns deliver 62% higher engagement overall. And carousel ads produce 111% higher ROAS compared to single-image ads.
Video Advertising Statistics
Video content continues to drive superior engagement and conversion across Meta platforms, and the shift toward short-form video has only accelerated.
Video Ad Performance
Video ads now account for 37.5% of total ad spend on Facebook. Facebook Reels ads saw a 29% year-over-year increase in impressions, with monthly Reels views hitting 27 billion. A majority of advertisers (67.55%) report videos receive more clicks than other formats, though video CTR averages 0.65%. Dynamic scene-switching AI video increases watch time by 21%.
Reels Advertising
Meta's investor reports show Reels make up 50% of all time spent on Instagram, with users sharing 3.5 billion Reels daily across Facebook and Instagram. CTR for Reels ads reaches 1.25%, engagement rate averages 2.7%, reach covers 30.81% of followers, and brands see conversion rate lifts of 55% compared to other formats.
Small Business Advertising Statistics
Small businesses represent a significant portion of Meta's advertiser base with distinct performance patterns. The platform's accessibility makes it a natural fit for local businesses testing digital advertising for the first time.
SMB Adoption and Investment
SQ Magazine's analysis shows over 68 million small businesses actively advertise on Facebook.
Small businesses spend an average of $427 per month on Facebook ads, 13% higher than the previous year. One in three small businesses generate 50%+ of their online revenue through Facebook ads. Local service providers achieve a 10.1% conversion rate, and geo-targeted ads deliver 3.4x higher CTR compared to non-targeted campaigns. Advantage+ Shopping performs 22% better than manual targeting, and 64% of small business advertisers prefer Facebook over other platforms, citing targeting ease as the primary reason.
Cost Efficiency for SMBs
In-app lead forms reduce CPL to $8.20 on average, a 16% improvement year-over-year. For small businesses watching every dollar, that efficiency matters.
Common Misconceptions About Meta Advertising
Misconception 1: Facebook Is Declining and Not Worth Advertising On
Despite narratives about Facebook's decline among younger users, the platform continues growing. Facebook's global advertising reach increased by 93.3 million users (4.3% growth) in the twelve months ending January 2025. With 3.07 billion monthly active users and 2.11 billion daily active users, Facebook remains the world's largest social network. While younger users may prefer Instagram or TikTok, they largely remain within Meta's ecosystem rather than leaving entirely.
Misconception 2: Lower CTR Means Unsuccessful Campaigns
Click-through rate varies dramatically by industry, campaign objective, and funnel stage. A 0.80% CTR in automotive services is average, while the same rate in travel would indicate underperformance. Lead generation campaigns consistently achieve 2.53% CTR because they target higher-intent users. Success should be measured against industry-specific benchmarks and business objectives, not arbitrary universal standards.
Misconception 3: AI Automation Means Less Control
While Advantage+ campaigns automate many decisions, successful advertisers combine AI optimization with strategic oversight. Meta reports that agencies combining automation with manual strategy layers achieve optimal results. AI handles real-time optimization across thousands of variables, while humans provide creative direction, brand safety guardrails, and strategic objectives. The 22% ROAS improvement from AI-driven campaigns requires quality creative input and ongoing performance monitoring.
Real-World Examples and Case Studies
Cozy Earth DPA Performance
Marpipe's case study analysis shows Cozy Earth scaled DPA (Dynamic Product Ads) spend by 220% using Meta's Advantage+ Shopping campaigns while maintaining profitable ROAS. The e-commerce brand leveraged AI-driven creative testing to identify winning product-creative combinations at scale.
Raymour & Flanigan ROAS Improvement
The furniture retailer achieved a 54% lift in ROAS through strategic DPA design optimization combined with Advantage+ audience expansion. This case demonstrates how established retail brands can improve efficiency by combining creative excellence with AI-powered targeting.
Aggregate Industry Performance
Meta's Q4 2025 earnings call revealed that advertisers using at least one of Meta's AI-driven optimization features (Advantage+ placements, automated bidding, or creative optimization) saw consistent improvements. Average ROAS for properly optimized campaigns ranges from 3-5x, Advantage+ Shopping campaigns reached a $20 billion annual run rate (70% year-over-year growth), and AI-driven campaigns require 62% less management time while delivering 28% better performance.
Frequently Asked Questions
What is the average ROI for Facebook advertising in 2026?
Properly optimized Facebook advertising campaigns deliver average ROAS between 2.79 and 5x, depending on industry, targeting strategy, and creative quality. Advantage+ AI-powered campaigns specifically achieve $4.52 return per $1 spent, representing a 22% improvement over manually managed campaigns. Rates below 2x ROAS suggest campaigns may not be profitable after accounting for ad costs and should be optimized.
How much should I budget for Facebook ads as a small business?
Small businesses spend an average of $427 per month on Facebook ads in 2025, representing a 13% increase from the prior year. For reliable performance data, Meta recommends starting with $10-50 per day per ad set. Advantage+ campaigns perform best with minimum budgets of $75-100 daily and at least 50 conversions per week per campaign to enable effective AI optimization.
What is a good click-through rate for Instagram ads?
Instagram CTR benchmarks vary significantly by placement. Feed ads average 0.22-0.88% CTR, with rates above 0.88% indicating strong performance. Story ads average 0.33-0.54% CTR, while Reels ads achieve approximately 1.25% CTR. If your Instagram CTR falls below 0.3%, consider testing more native, scroll-stopping creatives that fit seamlessly into users' Feeds.
Are Facebook ads still effective in 2026 compared to other platforms?
Facebook ads remain highly effective as part of a robust social media marketing strategy, with Meta generating $201 billion in 2025 revenue (22% year-over-year growth driven primarily by advertising performance improvements). Survey data shows 54% of marketers report Facebook ads are very effective for sales, and 29% report Facebook delivers the greatest ROI among all platforms. The key differentiator is Meta's AI infrastructure, which processes billions of ad auctions daily using machine learning optimization.
What's the difference between Meta Advantage and Advantage+ campaigns?
Meta Advantage includes optional automation add-ons like dynamic creatives or auto placements that enhance manual campaigns. Advantage+ offers full automation with minimal manual overrides: you set objectives and budgets while Meta's AI handles targeting, bidding, placements, and creative optimization. Advantage+ campaigns show a 12% lower cost per action and 15% higher ROAS on average, but require quality creative input, a sufficient number of shares, and sufficient conversion data to perform optimally.


