


Table of contents

Key Takeaways
- User-generated content drives measurable business outcomes: The UGC platform market reaching $7.37 billion in 2024 and projected growth to $57.92 billion by 2032 reflects proven ROI across industries, with brands seeing the highest ROI of 400% returns and 102.4% conversion lifts from UGC interaction.
- Q&A content delivers the highest conversion impact: With 177% conversion lift, Q&A functionality should be the first priority for UGC implementation, followed by ratings & reviews (108% lift) and visual content (104% lift), as these directly address customer objections and reduce purchase friction in your content strategy.
- Review volume and authenticity matter more than perfect ratings: Products need 30-50+ reviews to maximize credibility, while maintaining ratings between 4.75-4.99 stars optimizes conversion better than perfect 5.0 ratings, which 46% of consumers view with suspicion.
- Strategic UGC distribution across channels multiplies impact: Email campaigns with UGC see 78% higher click-through rates, social media campaigns with UGC achieve 35% higher CTR, and the ROBO multiplier of 3.91x demonstrates that online UGC drives substantial offline sales.
- Implementation success requires systematic processes: Proactive review solicitation, prominent display optimization, interactive features (filtering, search, voting), and cross-channel syndication all contribute to maximizing UGC's conversion impact—professional UGC platforms can accelerate results and provide data infrastructure for continuous optimization.
What Is User-Generated Content?
User-generated content (UGC) refers to any content—including reviews, ratings, photos, videos, questions, answers, testimonials, and social media posts—created by unpaid contributors rather than brands themselves. This content originates from customers, users, influencers (when unpaid), or any individual who voluntarily shares their experience with a product, service, or brand.
According to Grand View Research's comprehensive market analysis, UGC platforms are defined as software-as-a-service (SaaS) solutions that help organizations curate images, videos, and text from social media and other online resources to repurpose for creating their brand's authentic story. These platforms have evolved from simple review aggregators into sophisticated content management systems that integrate across the entire customer journey.
UGC changed everything. In 2012, Nielsen's landmark Global Trust in Advertising study found that 92% of consumers trusted recommendations from friends and family above all other forms of advertising. By 2021, this figure settled at 88% according to Nielsen's updated research—still 46 percentage points higher than the next closest paid advertising format.
For mid-market and enterprise businesses, UGC isn't optional anymore. The data is brutal. Consumers have become increasingly skeptical of brand-created messaging while simultaneously craving authentic information from peers. This creates both a challenge and an opportunity—brands that successfully leverage UGC can achieve significant competitive advantages in conversion rates, customer acquisition costs, and lifetime value metrics that directly impact bottom-line performance.
The UGC Market: Growth Trajectory and Investment Landscape
The numbers tell the story.
Market Size and Projected Growth
Grand View Research projects the global UGC platform market to reach $32.6 billion by 2030, growing at a compound annual growth rate (CAGR) of 29.4% from 2023 to 2030. The market was valued at $4.4 billion in 2022 and reached approximately $7.37 billion in 2024, according to SkyQuest Technology research.
The UGC platform market is growing at 29.4% annually—roughly three times faster than the overall martech industry. UGC has moved from emerging trend to mainstream requirement. North America currently dominates with 34.1% market share, while Asia Pacific is projected to demonstrate the highest CAGR through 2030.
Product Type and Format Distribution
Within the UGC market, different content types show varying adoption rates:
| Content Type | Market Share | Growth Driver |
|---|---|---|
| Audio & Video | 33.7% | High engagement rates, detailed product information, shareability on social platforms |
| Images | ~25% | Visual proof, authentic representation, mobile-first consumption |
| Reviews & Text | ~22% | SEO value, search result dominance, decision-making support |
| Q&A Content | ~19% | Highest conversion impact, addresses specific customer concerns |
The audio and video segment holds the maximum revenue share due to increased customer engagement potential, high sharing ability on social media platforms, availability of high-speed internet, and the detailed product information these formats can convey.
End-User Segmentation
The enterprise segment dominates the UGC market with a 63.1% revenue share as of 2022. This reflects the reality that larger organizations have both the resources to implement comprehensive UGC programs and the scale to realize substantial ROI from these investments. Mid-market businesses increasingly represent the fastest-growing segment as platform costs decrease and implementation complexity reduces.
UGC Impact on Consumer Trust and Purchase Decisions
Trust drives everything else.
Without consumer confidence in UGC, the conversion data doesn't matter. Multiple research institutions have documented the trust advantage customer content commands over traditional advertising.
The Trust Gap Between Earned and Paid Media
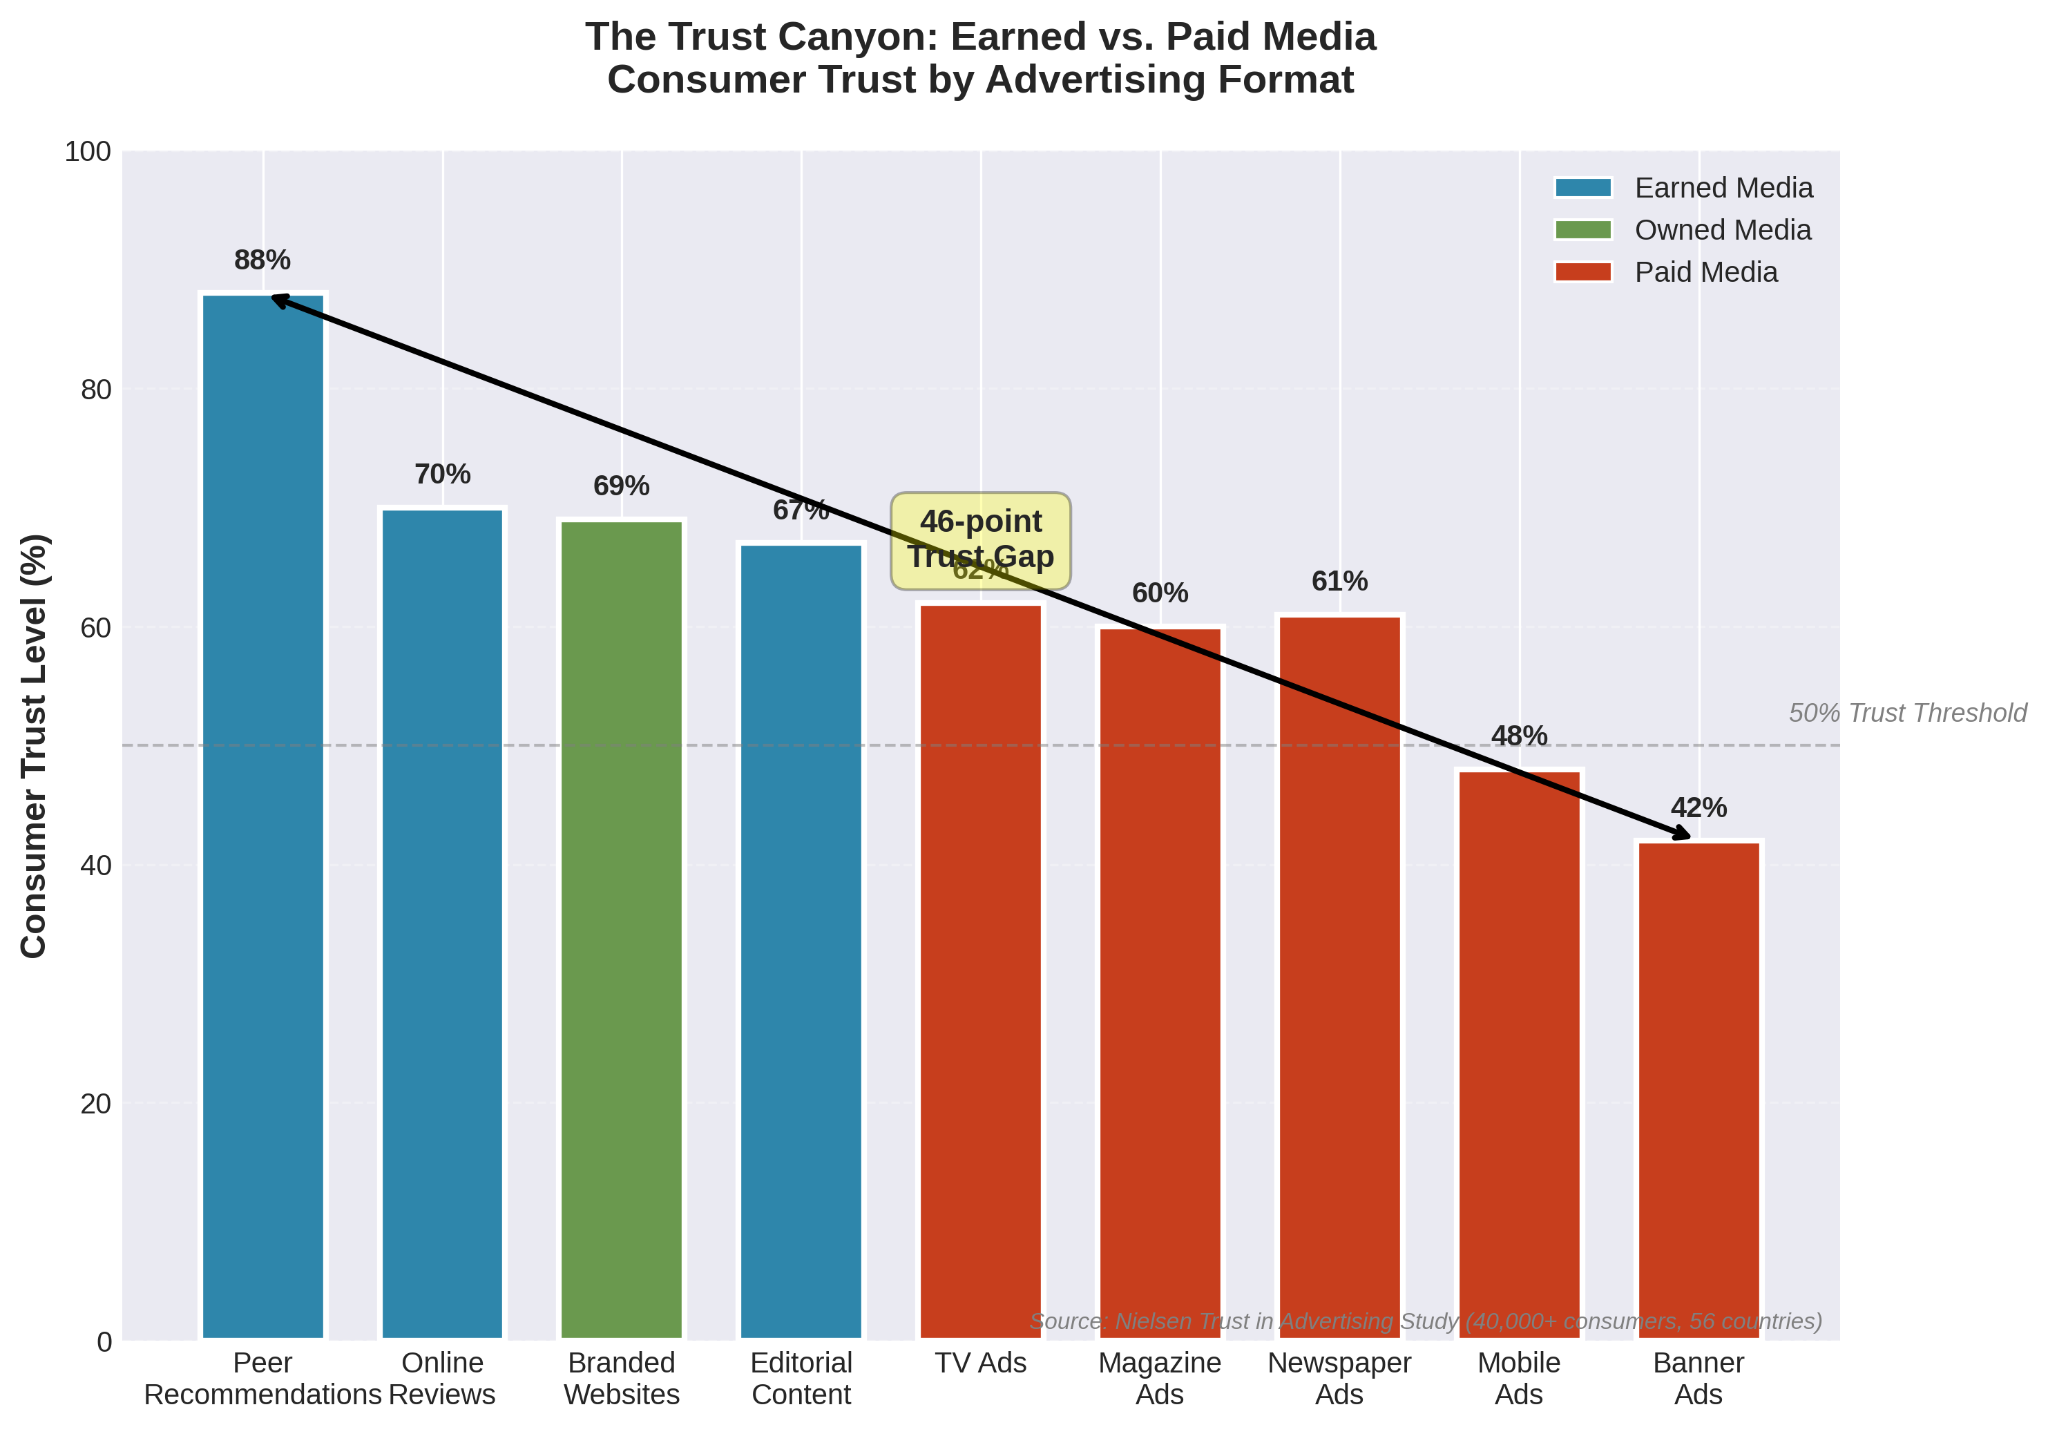
According to Nielsen's 2021 Trust in Advertising Study, which surveyed more than 40,000 consumers across 56 countries, 88% of global respondents trust recommendations from people they know more than any other channel. This represents an 18% increase from Nielsen's 2007 baseline study, indicating that earned media's trust advantage has actually grown during the digital transformation era.
Nielsen's trust hierarchy reveals a massive gap. Peer recommendations dominate at 88% trust, with online reviews second at 70%. Editorial content sits at 67%, branded websites at 69%. Compare that to paid advertising—TV ads at 62%, magazine ads at 60%, newspaper ads at 61%, and online banner ads at just 42%.
That 46-point spread between peer recommendations and banner ads isn't a trust gap. It's a trust canyon. And it directly predicts conversion performance.
UGC's Influence on Purchase Decisions
The impact on purchase behaviour? Massive.
Research from multiple sources confirms UGC's decisive role:
- 79% of consumers report that UGC highly impacts their purchasing decisions (industry-wide survey data)
- 84% of people are more likely to trust a brand if it uses UGC in marketing campaigns (EnTribe Survey)
- 93% of consumers find UGC helpful when making purchase decisions (multiple consumer research studies)
- 40% of shoppers rate UGC as "extremely" or "very" important when making purchase decisions (Salsify's 2024 Consumer Research Report)
- 13% of respondents stated they would abandon an online purchase altogether if there weren't any UGC available (Salsify research)
That 13% abandonment rate isn't theoretical. For enterprise decision-makers, this represents direct revenue walking out the door—losses that compound across thousands of SKUs and millions of potential transactions.
Generational Differences in UGC Trust
Trust patterns vary meaningfully across age cohorts, with implications for targeting strategies:
- 70% of Gen Z and 78% of millennials claim UGC plays an important part in their buying choices
- 91% of 18-34-year-olds trust online reviews as much as personal recommendations
- Millennials are 38% more likely to discover brands through recommendations
- 82% of Gen-Z trust their family and friends for advice on products more than any other source (McKinsey & Co)
The trend is clear. As younger consumers gain purchasing power, UGC's importance will only increase. Enterprise brands building long-term strategies must prioritize UGC infrastructure now to maintain relevance with future high-value customer segments.
UGC's Conversion Impact: Quantifying the Business Case
Trust metrics matter. But conversion data closes the deal.
PowerReviews' comprehensive analysis of 1.5 million online product pages from over 1,200 brand and retailer sites provides the most rigorous conversion impact data available—and the results aren't subtle: when shoppers interact with customer-created content, their likelihood of purchasing more than doubles compared to visitors who never engage with reviews, questions, photos, or ratings at all.
Overall Conversion Lift by Interaction Level
The mere presence of UGC creates measurable conversion improvements in blog articles:
- 3.8% conversion rate increase when visitors scroll to a point where they encounter UGC
- 8.5% increase in conversion among visitors who are served up some form of UGC on product pages
- 102.4% conversion lift among visitors who interact with UGC in some manner
This tiered impact structure reveals an important strategic insight: simply displaying UGC creates value, but the exponential lift comes from facilitating meaningful interaction with that content.
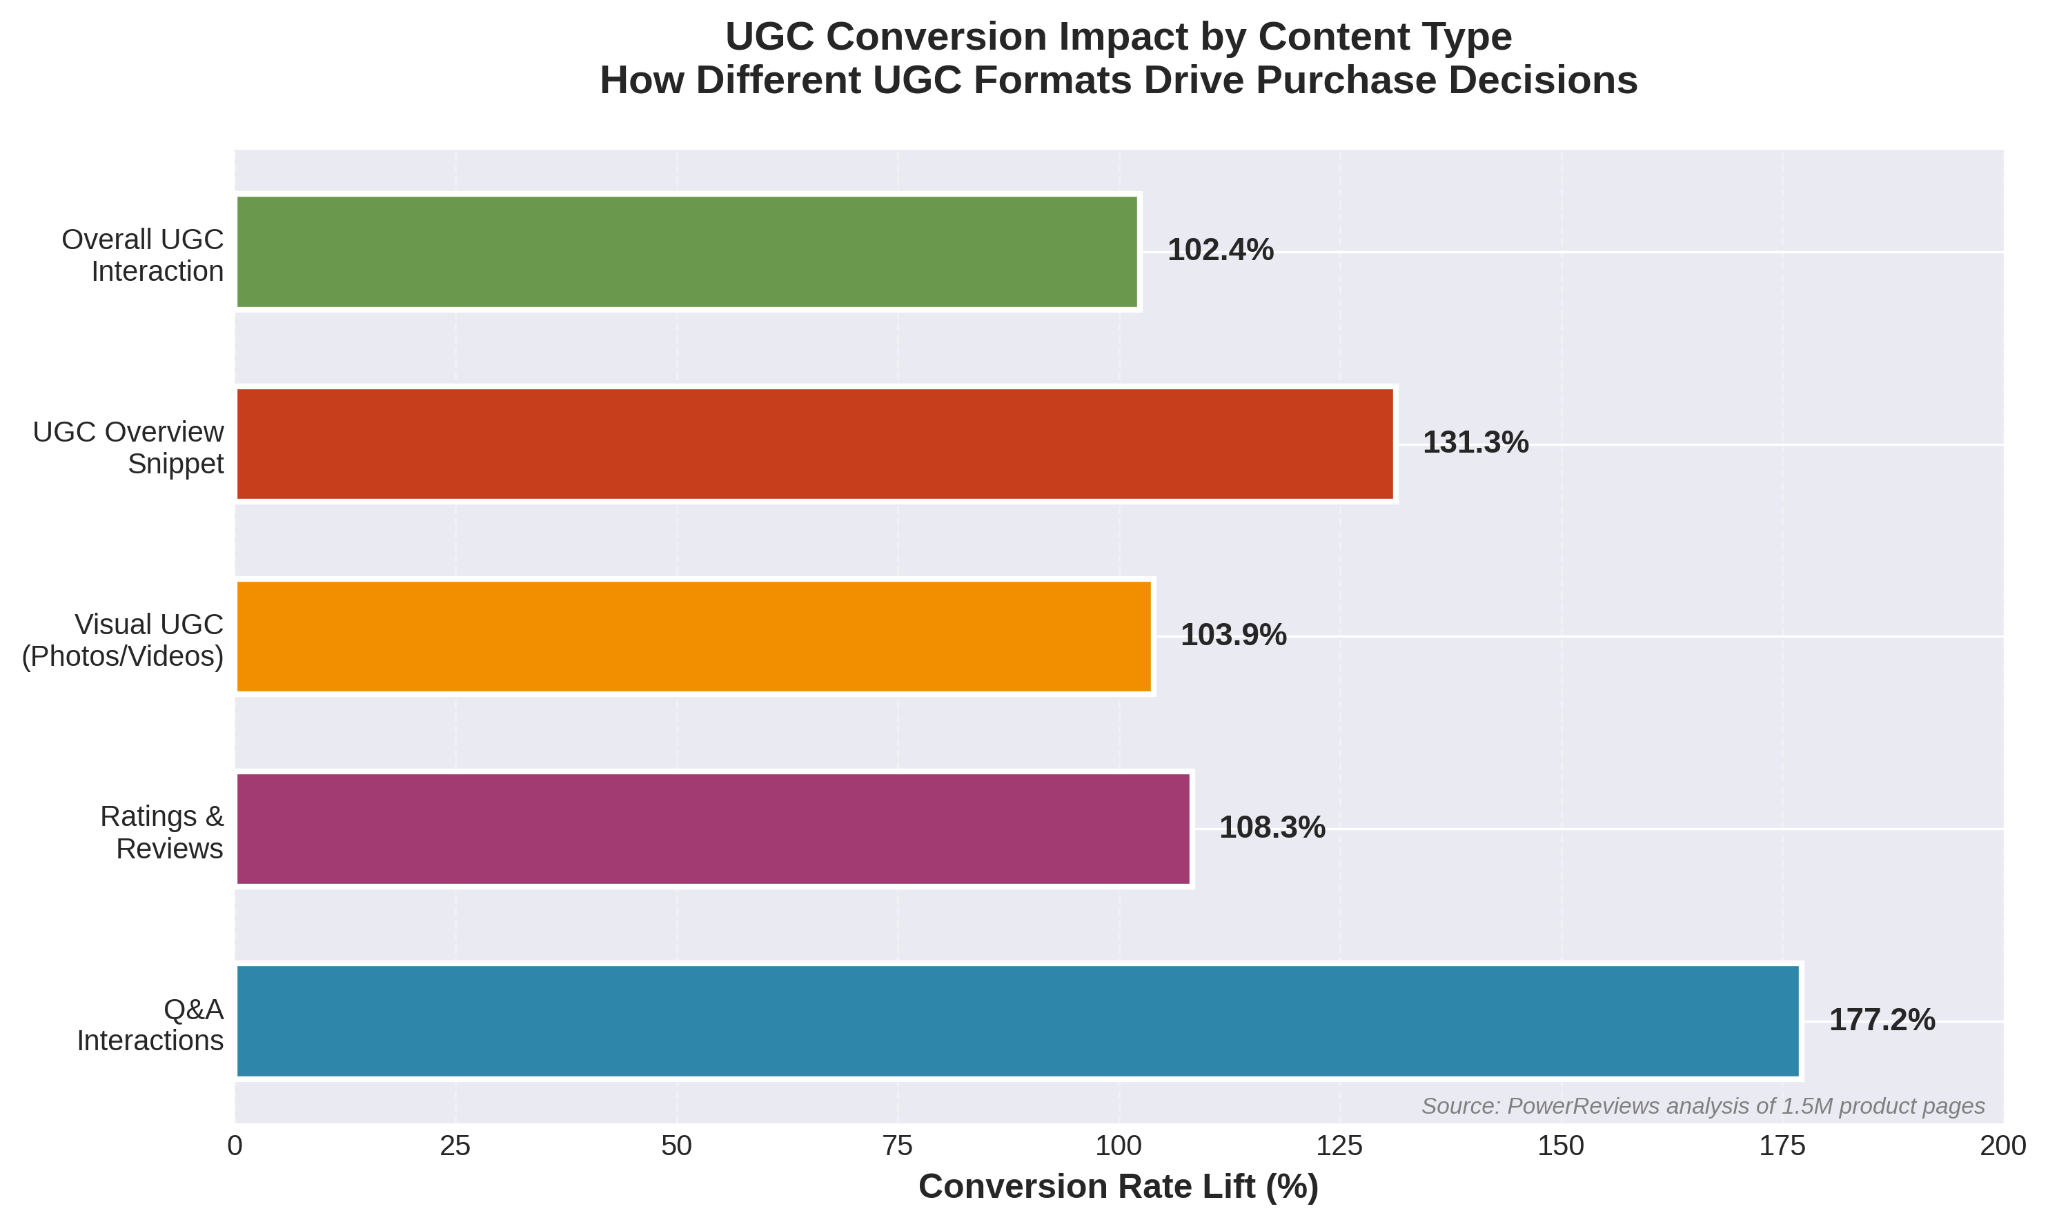
Conversion Impact by UGC Type
Different UGC formats drive varying conversion performance:
| UGC Type | Conversion Lift | Strategic Implication |
|---|---|---|
| Q&A Interactions | 177.2% | Highest impact format; addresses specific objections |
| Ratings & Reviews Interactions | 108.3% | Essential foundation; SEO and trust benefits |
| Visual UGC Interactions | 103.9% | Second highest lift; particularly important for visual products |
| UGC Overview Snippet Clicks | 131.3% | First impression matters; optimize snippet display |
The Q&A format's superior performance (177% lift) reflects its ability to address specific customer concerns in real-time. When potential buyers can see their exact questions answered by previous purchasers, objections dissolve with far greater effectiveness than generic marketing copy can achieve.
Specific Feature-Level Conversion Performance
Drilling down to individual UGC features reveals optimization opportunities:
Review Features:
- Clicking "Helpful Yes": 414.3% conversion lift
- Clicking "Helpful No": 292.9% conversion lift
- Using Review Search: 260.7% conversion lift
- Star Rating Filters: 111.8% conversion lift
- Reading Additional Reviews: 128% conversion lift
Q&A Features:
- Clicking "Show More Answers": 164.7% conversion lift
- Submitting "Add Your Answer": 131.3% conversion lift
- Asking New Questions: 150% conversion lift
Visual UGC Features:
- Clicking Image Gallery: 110.7% conversion lift
- Viewing Next Image/Video: 103.6% conversion lift
- Opening User-Submitted Photos: 103.9% conversion lift
These granular metrics provide clear direction for UX optimization. Features enabling deeper exploration (search, filtering, additional content access) consistently outperform passive viewing, indicating that empowering active investigation drives conversion more effectively than simple content display.
The Role of Review Volume and Rating Distribution
Not all UGC performs equally.
Review volume and rating distribution significantly impact conversion effectiveness, with counterintuitive patterns that challenge common assumptions.
Review Volume's Impact on Conversion
More reviews equal more conversions. The relationship is linear and dramatic.
PowerReviews' analysis of review volume impact reveals clear patterns:
- Products with 1-10 reviews: ~100% conversion lift vs. products with zero reviews
- Products with 11-30 reviews: ~200% conversion lift
- Products with 31-50 reviews: ~300% conversion lift
- Products with 51-100 reviews: ~350% conversion lift
- Products with 101+ reviews: over 250% conversion lift
This relationship varies by product category. For CPG products specifically:
- 1-10 reviews: 194.5% conversion lift
- 11-30 reviews: 286.2% conversion lift
- 31-50 reviews: 474.4% conversion lift
- 51-100 reviews: 579.5% conversion lift
- 101+ reviews: 686.2% conversion lift
The implication? Review generation should be treated as a continuous operational priority rather than a one-time campaign. The marginal conversion benefit of each additional review remains positive even past 100 reviews for most product categories.
The Optimal Star Rating for Conversion
Perfect 5.0-star ratings don't maximize conversion. Surprising, but true.
PowerReviews' rating analysis found:
- 4.75-4.99 star ratings achieve optimal conversion rates
- Products with 5.0-star ratings have comparable conversion rates to products rated 3.0-3.49 stars
- The biggest conversion leap occurs from 3.0-3.49 stars to 3.5-3.99 stars (20% increase)
- 46% of shoppers overall and 53% of Gen Z shoppers are suspicious of perfect 5-star ratings
Shoppers recognize that perfect ratings often indicate either insufficient review volume, filtered reviews, or fraudulent content. Ratings between 4.75-4.99 signal both quality and authenticity—excellent performance with the human imperfection that creates credibility.
Brands should embrace negative reviews rather than filter them. A small percentage of 1-3 star reviews increases the perceived authenticity of the overall review corpus, actually improving rather than harming conversion performance.
UGC Across Social Media Platforms
Social media platforms serve as both UGC generation engines and distribution channels. Platform-specific performance data informs where brands should focus content collection and engagement efforts.
Instagram's Dominance in UGC Marketing
CrowdRiff's 2024 Trends Report found:
- Instagram remains the preferred social network for internet users aged 16-34, especially for creating social media content.
- Instagram remains the preferred social network for internet users aged 16-34
- 81% of destination marketers have seen higher engagement since using UGC
- 98% of DMOs plan to distribute creator-made content through Instagram ads
- 91% of active users watch Instagram videos every week
- 49% of Gen Z'ers use Instagram Stories to find new products and services
Instagram's visual-first format aligns perfectly with UGC's strength in authentic product representation. The platform's features—Stories, Reels, Shopping tags—create seamless paths from UGC discovery to purchase consideration.
TikTok's Growing Influence
TikTok has emerged as a critical UGC platform, particularly for reaching younger demographics:
- 40% of US travellers over 30 have used TikTok rather than Google to research trips (MMGY Global)
- 56% of marketers reported short-form video was their top investment for 2024 (HubSpot State of Marketing Report)
- TikTok's algorithm favors authentic, user-generated content over polished brand content
- Meta's research shows Reel ads (vertical videos with audio) had 35% higher click-through rates than other Reel ad formats
Platform-Specific Performance Data
Different platforms show varying effectiveness for different objectives:
| Platform | Primary Strength | Engagement Rate | Best For |
|---|---|---|---|
| Visual storytelling, shopping integration | 91% weekly video views | Fashion, beauty, lifestyle, travel | |
| TikTok | Short-form video, algorithmic reach | Explosive viral potential | Gen Z targeting, trend-driven products |
| Broad demographic reach, community building | 4M posts liked per minute | CPG, family products, local businesses | |
| YouTube | Long-form content, product demonstrations | 10x more views than brand content | Complex products, tutorials, unboxing |
| Direct communication, trust | 41.6M messages sent per minute | B2B, high-consideration purchases |
Research by Nostro found that 28% of e-commerce marketers agree Instagram users generate the most engaging content out of any platform. This dominance reflects Instagram's ecosystem design, which actively encourages high-quality visual content creation and brand tagging.
Common Misconceptions About User-Generated Content
Three myths persist. All three cost brands money.
Misconception 1: Influencer Content Is More Effective Than Customer UGC
Wrong.
Multiple studies demonstrate customer UGC significantly outperforms influencer content for driving purchases.
According to EnTribe Survey data, 81% of respondents stated that the use of influencers in marketing initiatives has either no impact or a negative impact on how they view a brand. Meanwhile, 82% of consumers are likely to buy something from a brand if regular customer UGC is incorporated into marketing strategies.
The data is brutal:
- UGC is seen as 8 times more effective than influencer content in decision-making
- Only 20% of respondents trust paid-for familiar faces (Clear Channel and JCDecaux)
- 93% of marketers leveraging UGC claim it performs notably better than traditional branded content
Why? Consumers recognize influencer content as paid advertising, which triggers the same skepticism they apply to traditional ads. Authentic customer content is perceived as genuine peer recommendation—the most trusted information source according to Nielsen's research.
Brands should prioritize customer UGC collection and display over influencer partnerships for direct conversion impact. Influencers may still play a role in awareness building, but the conversion phase demands authentic customer voices.
Misconception 2: Perfect 5-Star Ratings Maximize Conversion
Reality: Products rated 4.75-4.99 stars convert better than perfect 5.0-star products because consumers distrust perfection.
As documented earlier, PowerReviews found that products with perfect 5.0-star ratings achieve conversion rates comparable to products rated just 3.0-3.49 stars—dramatically lower than the optimal 4.75-4.99 range.
Consumer psychology research explains this pattern:
- 46% of shoppers overall and 53% of Gen Z shoppers are suspicious of perfect 5-star ratings
- Consumers recognize that no product satisfies 100% of users 100% of the time
- Perfect ratings signal potential review filtering, fake reviews, or insufficient sample size
Best practice: Encourage all customers to leave honest reviews, including those with minor complaints. A small percentage of 3-4 star reviews validates the authenticity of your review corpus and actually improves conversion performance. Brands that filter negative reviews damage both their credibility and their conversion rates.
Misconception 3: Quantity of UGC Matters More Than Quality
Both matter. But they work differently.
Volume provides statistical credibility—consumers want 30+ reviews minimum for credible assessment. Fresh UGC improves SEO performance. More reviews cover diverse customer concerns and use cases.
Quality drives actual conversion. Detailed reviews convert better than brief ones. Q&A content must answer real questions, not generic queries. High-quality photos and videos drive significantly higher engagement than low-resolution snapshots.
PowerReviews analysis found that the average review is only 218 characters long, far below the consumer-preferred 500+ minimum. This indicates a quality gap even among brands collecting reviews at scale.
The fix: Implement structured review solicitation that encourages substantive, detailed responses. Questions like "What do you use this product for?" and "What should other customers know?" generate higher-quality content than simple star ratings. Offer incentives for photo/video upload to improve visual UGC coverage.
Real-World Examples and Case Studies
Theoretical conversion lift statistics gain practical meaning through specific implementation examples. These case studies demonstrate how mid-market and enterprise brands translate UGC principles into measurable business outcomes.
Bazaarvoice: Platform-Wide Performance Metrics
Bazaarvoice, a leading UGC platform, provides aggregated performance data across their client base:
- Clients see 3x conversions when social content is combined with ratings and reviews
- Having just 10 product reviews can lift conversion rate by 45%
- The average ROBO (research online, buy offline) multiplier is 3.91x—meaning every $1 of revenue influenced online translates to $3.91 in-store
- For every $1 spent on the Bazaarvoice platform, clients get back $4 (400% ROI)
- Bazaarvoice adds 2.71% contribution to total revenue for participating brands
These platform-wide metrics demonstrate that UGC's impact scales across diverse industries and brand sizes. The 400% ROI statistic provides clear financial justification for mid-market and enterprise UGC investment.
Feelunique: $10 Million Annual Sales Impact
British online beauty retailer Feelunique implemented a comprehensive UGC strategy centered on customer reviews, Q&A, and visual content. The result: $10 million in annual sales directly attributable to UGC implementation.
Key elements of their approach:
- Systematic review solicitation across all product categories
- Prominent display of UGC on product pages and in email marketing
- Integration of customer photos into product galleries
- Q&A functionality to address pre-purchase questions
GANT: 5% Return Rate Reduction
Fashion retailer GANT leveraged visual UGC to address a critical e-commerce challenge: product returns. By featuring customer-submitted photos showing how products look in real-world conditions, GANT was able to reduce its return rate by 5% compared to more polished, professional content.
The business impact extends beyond conversion:
- Return rate reduction directly improves gross margins
- Visual UGC helps customers select correct sizes and styles
- Authentic photos manage expectations more effectively than brand photography
Iconic London: 126% Conversion Lift
Beauty brand Iconic London implemented visual UGC across their e-commerce platform, featuring customer makeup looks and tutorials. The brand achieved a 126% lift in conversion rates compared to pages without visual UGC.
Success factors:
- High-quality user-submitted photos showcased diverse skin tones and applications
- Integration with Instagram allowed seamless content flow from social to e-commerce
- Customer photos appeared alongside professional product images, providing both aspiration and authenticity
Financial Performance and ROI Metrics
The business case is clear. Multiple research sources provide convergent ROI data.
Direct Revenue Impact
- Bazaarvoice's Forrester study found 400% ROI, with every dollar invested returning four dollars
- 93% of marketers leveraging UGC claim it performs notably better than traditional branded content
- Brands utilizing UGC experience a 29% higher web conversion rate compared to those that don't
- For every $1 of revenue influenced online, UGC influences $3.91 in-store (ROBO multiplier)
Cost Savings and Efficiency Gains
UGC provides value beyond direct conversion lift:
- Reduced content creation costs: Customer photos and videos eliminate the need for expensive product photography and help in delivering relatable content.
- Improved SEO performance: Fresh UGC creates continuous new content that search engines reward
- Lower customer acquisition costs: Higher conversion rates mean lower cost per acquisition
- Enhanced customer lifetime value: Engagement with UGC correlates with increased loyalty
McKinsey research confirms that personalization (including UGC integration) can deliver 10-15% revenue increases along with 10-30% increases in marketing spend efficiency.
Time to ROI
Results come fast:
- Review collection and display: 30-60 days to measurable conversion improvement
- Comprehensive UGC content programs: 3-6 months to full platform ROI
- Visual UGC integration: 60-90 days to significant engagement metrics
- Q&A functionality: Immediate impact on objection resolution and conversion
Strategic Implementation Recommendations
Data without execution is just interesting numbers. Here's how to turn these statistics into business results through systematic implementation across collection, curation, and distribution.
UGC Collection Strategy
Proactive Solicitation:
- Implement post-purchase email campaigns requesting reviews (optimal timing: 7-14 days after delivery)
- Offer incentives for photo/video submissions, including Instagram Reels (contests, loyalty points, featured customer spotlights)
- Create frictionless submission processes (mobile-optimized, pre-filled fields, simple upload)
Social Media Harvesting:
- Monitor brand mentions and hashtags for user-generated content and online presence.
- Request permission to feature customer content in marketing materials
- Create branded hashtags that encourage customer content creation
Structured Review Programs:
- Use review solicitation that encourages detailed, substantive responses
- Ask specific questions about use cases and applications
- Implement verification processes to maintain authenticity
Display Optimization
Above-the-Fold UGC:
- Display review summaries and ratings from real people immediately visible on product pages
- Feature user photos in primary product image galleries
- Highlight Q&A content addressing common concerns
Interactive Features:
- Enable review filtering by star rating, keyword, and product features
- Allow customers to mark reviews as "helpful" or "not helpful"
- Implement review search functionality for specific concerns
- Display Q&A prominently with ability to ask new questions
Mobile Optimization:
- Ensure UGC displays appropriately on mobile devices (majority of traffic)
- Optimize image galleries for touch navigation
- Simplify UGC interaction on smaller screens
Cross-Channel Distribution
Email Marketing:
- Feature customer reviews in promotional emails (78% higher click-through rates with UGC in emails)
- Include customer photos in product recommendation emails
- Use testimonials in welcome and nurture campaigns
Social Media:
- Redistribute customer content across brand social channels
- Create customer spotlight series featuring authentic stories
- Use UGC in paid social advertising (Meta shows 35% higher CTR)
Retail Partners:
- Syndicate reviews to retail partner websites
- Ensure UGC displays consistently across all sales channels
- Leverage syndication networks for maximum distribution
Frequently Asked Questions
What types of user-generated content have the highest impact on conversion rates?
Q&A content delivers the highest conversion impact, with visitors who interact with questions and answers converting at 177.2% higher rates than average. This is followed by ratings and reviews (108.3% lift) and visual UGC, including authentic content, photos and videos (103.9% lift). The superior performance of Q&A reflects its ability to address specific customer objections and concerns in real-time, directly removing barriers to purchase. For optimal results, brands should implement all three UGC types as they serve complementary functions in the customer decision journey.
How many reviews does a product need to significantly impact conversion?
Research shows a linear relationship between review volume and conversion, with measurable impact beginning at just 1-10 reviews. Products with 11-30 reviews see conversion rates over 2x higher than products with zero reviews. The most substantial improvements occur at 31-50 reviews, and benefits continue increasing up to 101+ reviews, which show over 250% conversion lift. However, the optimal target varies by product category and price point—higher-priced items and complex products benefit from larger review volumes (50-100+) while lower-priced impulse items show strong performance with 20-30 reviews.
Does UGC work equally well across different industries?
UGC effectiveness varies by industry but demonstrates positive impact across all sectors. E-commerce, particularly fashion, beauty, and consumer electronics, shows the strongest performance with conversion lifts of 100-200%+. B2B sectors show lower but still significant impact (30-60% conversion improvement) with longer sales cycles. Service industries benefit particularly from detailed testimonials and case studies provided by marketing professionals. Product complexity is often more predictive than industry—products requiring significant consideration (furniture, appliances, technology) benefit more from extensive UGC than commodity items.
How do you balance negative reviews without hurting conversion?
Paradoxically, some negative reviews actually improve conversion performance by increasing perceived authenticity. Products with ratings between 4.75-4.99 stars convert better than perfect 5.0-star products because 46% of shoppers overall (53% of Gen Z) are suspicious of perfect ratings. The key is responding professionally to negative reviews, demonstrating that legitimate concerns receive attention. Research shows conversion rates remain strong even when 10-15% of reviews are 3 stars or below, provided the overall average stays above 4.0 and brands engage constructively with criticism.
What is the ROI timeline for investing in a UGC program?
Different UGC initiatives show varying ROI timelines. Basic review collection and display typically show measurable conversion improvements within 30-60 days of implementation, enhancing brand awareness. Comprehensive UGC programs including visual content, Q&A, and syndication generally achieve full platform ROI within 3-6 months. Visual UGC integration shows significant engagement improvements within 60-90 days. According to Bazaarvoice's Forrester study, mature UGC programs deliver 400% ROI, with every dollar invested returning four dollars. The fastest path to ROI is implementing Q&A functionality, which shows immediate impact on objection resolution and conversion.


